1 performance management report service group: provide security guard services team leader: major...
TRANSCRIPT

1
Performance Management Report
Service Group: Provide Security Guard Services
Team Leader:
Major Patricia Haynes
Team Members:
Lawrence Brown
Marco Kittrell
Udon Cheek
Triumph Technologies
ORS
National Institutes of Health
Date: 14 January 2005

2
Table of Contents
Main Presentation
PM Template ……………………………….……………………… 3
Relationships…………………………………………………………4
Customer Perspective……………………….…………………… 5
Internal Business Process Perspective………………………… 10
Learning and Growth Perspective……………………………………………………. 13
Financial Perspective……………………………………… 16
Conclusions and Recommendations……………………………….. 19
Appendices………………………………………………………………....22

3
DS4: Perform perimeter vehicle security inspections -- CVI and W. Cedar, perimeter garage
Provide Security Guard Services
Service Group
Date: 28 April 2004
Team Leader
Our team uses an operational excellence strategy to provide management and oversight to the NIH Guard Services performance-based service contract to deliver services to customers. By focusing on the consistent application of security policies and procedures, we will increase our customers confidence in their safety and security while at the NIH campus and local NIH facilities. Our trained and qualified guard staff will demonstrate our commitment to the professional delivery of guard services that will be evident to our customers through their daily encounters with guard personnel. We work to deliver these services under all threat conditions in a smooth and cost-efficient manner without compromising security and safety concerns.
Strategy Description
DS5: Perform underground vehicle security inspections -- parking garages
DS6: Provide guard services for special events
Team Members
Patricia Haynes
Lawrence Brown, Glenn Colevas, Marco Kittrell, Udon Cheek
Service Strategy
Performance Management Plan (PMP)
DS3: Provide guard perimeter security services -- visitor center and employee entrances
DS2: Provide building security guard services off campus
DS1: Provide building security guard services on campus
Discrete Services
Division Approval/Date: Associate Director Approval/Date:
The Security Guard Services team strives to reduce the probability of weaponized vehicles from entering the NIH Bethesda Campus, along with ensuring a safe and secure environment for NIH personnel and others at NIH facilities both on and off-campus in the DC Metro area. We provide professional and reliable security services that are implemented in a manner that is sensitive to the NIH research culture and diversity of its staff and visitors.
Value Proposition
Operational Excellence
Customer Intimacy
Product Leadership
Growth
Sustain
Harvest

4
Relationships
Value Proposition : Strive to reduce the probability of weaponized vehicles from entering the NIH campus, along with ensuring a safe and secure environment for NIH personnel and others both on and off campus in a manner that is sensitive to the NIH culture and diversity of its staff and visitors.
:
Customer
InternalProcesses
Financial
Learning & Growth
,
IB1
L2
F7
,
Decrease the probability of weaponized vehicles from entering the NIH Bethesda campus
-
C1
Increase consistency in guard service delivery to minimize disruption Optimize available
guard resources
Use innovative technology to enhance skills and improve performance
C2
Provide a positive environment that is safe and secure for personnel and others
Stakeholder
High Impact Objectives-Provide Security Guard Services

5
Customer Perspective

6
Customer Perspective
Objective MeasureFY 04
TargetFY05
TargetFY06
TargetInitiative Owner
C1a: Number of breaches by commercial vehicles not being tested using steps in SOP 0 0 0 QA Team
C1b: Number of breaches by passenger vehicles not being tested using steps in SOP 0 0 0 QA Team
C1c: Number of failures to properly escalate positive ion scans when it occurs 0 0 0 QA Team
Implement the QASP
C1: Decrease the probability of weaponized vehicles from entering the NIH Bethesda
campus

7
• C1. Decrease the Probability of weaponized vehicles from entering the NIH Bethesda campus
• C1a.Number of breaches by commercial vehicles• Oct-Dec 03: 28• Jan-March 04: not available• March-May 04: 0• June-August 04: 0 • Sept-Dec 04: 0
• C1b. Number of breaches by passenger vehicles• Oct-Dec 03: 19• Jan-March 04: not available• March-May 04: 17• June-August 04: 7 • Sept-Dec 04: 32
• C1c. Number of failures to properly escalate positive ion reading• Oct-Dec 03: not available• Jan-March 03: not available• March-May 04: 0• June-August 04: 0 • Sept-Dec 04: not available

8
Customer Perspective (cont.)
Objective MeasureFY04
TargetFY05
TargetFY06
TargetInitiative Owner
C2a: Number of failures to fully screen employees 0 - 50 0 - 50 QA Team
C2b: Number of failures to fully screen visitors0 - 50 0 - 50 QA Team
C2c: Number of failures to properly escalate positive ion scan when it occurs 0 0 QA Team
C2d. Percent of posts with current SOPs in Guard Duty Book
95 - 100%
95 - 100%
QA Team
C2e: Hours supporting Special EventsQA Team
Cu
sto
mer C2: Provide an environment that
is safe and secure for personnel and others while at NIH facilities
Implement the QASP

9
• C2. Provide an environment that is safe and secure for personnel and others while at NIH facilities
• C2a.Number of failures to fully screen employees• Oct-Dec 03: 95• Jan- March 04: not available• March-May 04: 34• June-August 04: 18 • Sept-Nov 04: 20
• C2b. Number of failures to fully screen visitors• Oct- Dec 03: 81• Jan-March: not available• March-May 04: 3• June-August 04: 0 • Sept – Nov 04: 2
• C2c. Number of failures to properly escalate positive ion reading• Oct-Dec 03: not available• Jan- March: not available• March-May 04: 0• June-August 04: 0 • Sept-Nov 04: 0
• C2d. Number of posts with current SOPs in Guard Duty Book• Oct-Dec 03: not available• Jan-March 04: not available• March-May 04: 100%• June-August 04: 100% • Sept –Nov 04: 0
• C2e. Hours supporting special events not avialable

10
Internal Processes Perspective

11
Internal Process Perspective
Objective MeasureFY04
TargetFY05
TargetInitiative Owner
IB1: Increase the consistency in guard service delivery to minimize disruption to the NIH community
IB1: Average processing time to complete visitor vehicle inspection
Under 4 minutes
Under 4 minutes
Implement the QASP QA TeamInte
rnal
B
usi
nes
s

12
• IB1. Increase the consistency in guard service delivery to minimize disruption to the NIH community
• IB1a. Average processing time to complete visitor vehicle inspection
• Oct-Dec 03: 2.7 minutes• Jan-March 04: not available• March-May 04: 3.1 minutes• June-August 04: 3.5 minutes • Sept-Nov 04: 3.5 minutes

13
Learning & Growth Perspective

14
Learning & Growth
ObjectiveFY04
TargetFY05
TargetInitiative Owner
LG2a: Hours of skill enhancement by technology type
> FY03 >FY04 Tom
LG2b: Number of technology tools acquired to increase NIH security
> FY03 > FY04
Obtain Automatic Vehicle Counters
Automatic DL Scanners
Andover Readers at Employee
Gates/Bldgs
Patty
LG2: Use innovative technology to enhance skills and improve performance
Lea
rnin
g a
nd
Gro
wth

15
• LG2. Increase Knowledge Skills and Abilities of staff
• LG2a. Hours of skill enhancement by technology type• FY 03 : Average 8/hrs per employee• FY 04: TBD
• LG2b. Number of technology tools acquired to increase NIH security
• FY 03: = 3 significant tools (perimeter system, Visitor center, Commercial Vehicle Inspection Center
• FY04: = 3 significant tools

16
Financial Perspective

17
Financial Measures
Objective MeasureFY04
TargetFY05
TargetInitiative Owner
F7a: Total hours per 2-week period 1,700/wk >=FY04 Scott
F7b: Percent of weekly Billing Details Reports submitted on-time by contractor
95 - 100%
95 - 100%
QA TeamImplement the QASP
Fin
anci
al
F7: Optimize available guard resources

18
• F7. Optimize available guard resources• F7a. Total hours per two week period = ???
• F7b. Percent of weekly billing details report submitted on-time by contractor
• Oct- Dec 03: ???• Jan- March 04: ??• March-May 04: 100%• June- Aug 04: 99% • Sept-Nov 04: 100%

19
Conclusions / Initiatives

20
What changes have we made based on monitoring our data?
• QA team performs random review guard activity;• Increased Disincentives on the QASP;• Collect Complaint Data;

21
How do we plan to contribute in the future?
• Implement automated entry points at all perimeter entrances on a 7x24 schedule for authorized personnel
• Implement automated driver license scan to create access ID
- Speed up vehicle and pedestrian access- Eliminates separate building security at many locations
• Full time 7x24 Concierge Service at Visitors’ Center
• Implement separate patient’s entrance with dedicated concierge (Mon – Fri from 6:00am – 6:00pm)
• Single entry point for all commercial vehicles with new screening technology

22
Appendices
23
AppendicesAppendix
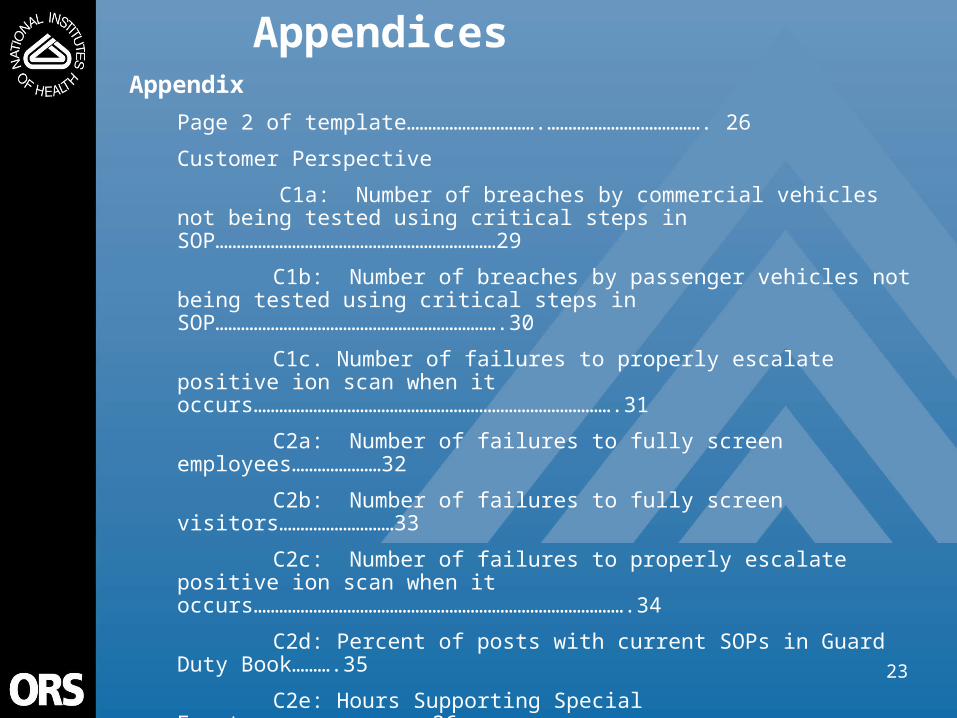
Page 2 of template………………………….………………………………. 26
Customer Perspective
C1a: Number of breaches by commercial vehicles not being tested using critical steps in SOP…………………………………………………………29
C1b: Number of breaches by passenger vehicles not being tested using critical steps in SOP………………………………………………………….30
C1c. Number of failures to properly escalate positive ion scan when it occurs………………………………………………………………………….31
C2a: Number of failures to fully screen employees…………………32
C2b: Number of failures to fully screen visitors………………………33
C2c: Number of failures to properly escalate positive ion scan when it occurs…………………………………………………………………………….34
C2d: Percent of posts with current SOPs in Guard Duty Book……….35
C2e: Hours Supporting Special Events………………………………….36
C3a. Number of observations of deficient professional conduct and demeanor while on duty……………………………………………………….N/A
C4a: Number of substantiated complaints after adjudication……….N/A
C4b: Customer Satisfaction Ratings for Security Guard Services….N/A
24
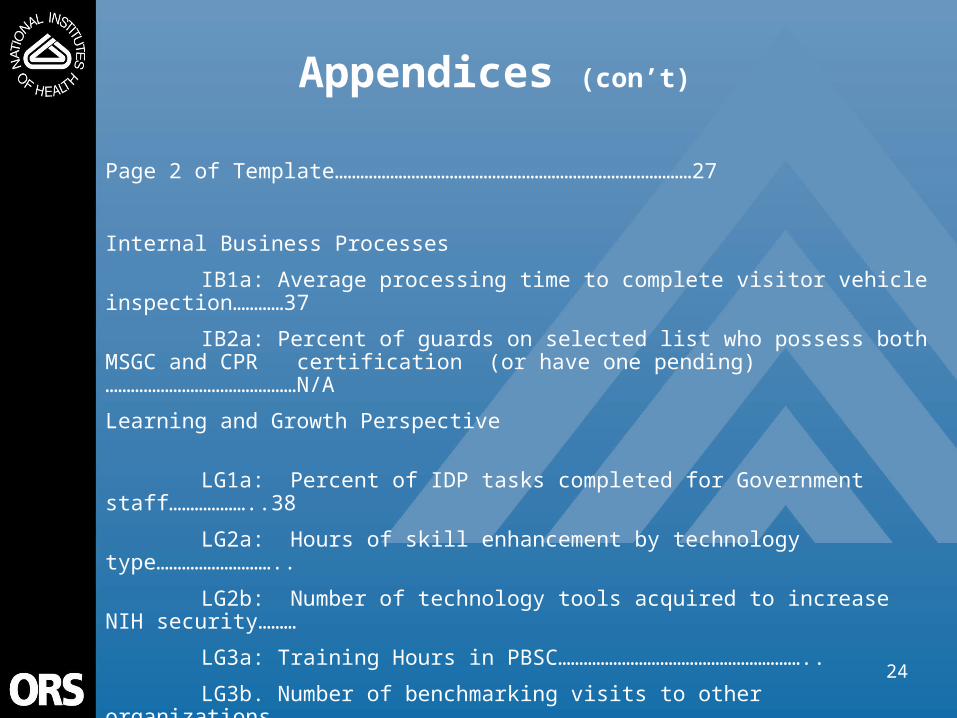
Page 2 of Template…………………………………………………………………………27
Internal Business Processes
IB1a: Average processing time to complete visitor vehicle inspection…………37
IB2a: Percent of guards on selected list who possess both MSGC and CPR certification (or have one pending)………………………………………
N/A
Learning and Growth Perspective
LG1a: Percent of IDP tasks completed for Government staff………………..38
LG2a: Hours of skill enhancement by technology type………………………..
LG2b: Number of technology tools acquired to increase NIH security………
LG3a: Training Hours in PBSC…………………………………………………..
LG3b. Number of benchmarking visits to other organizations………………..
Appendices (con’t)

25
Page 3 of Template…………………………………………………………………………28
Financial Perspective
F1a: Number of employees and visitors screened on-campus/month………39
F2a: Number of employees and visitors screened off-campus/month………..39
F3a: Number of vehicles screened at employees entrances/month …………..40
F4a: Number of vehicles checked at visitor gates/month………………………..40
F5a: Number of parking garage inspections……………………………………….41
F6a: Number of potential attendees per special event
F7a: Total hours per 2-week period……………………………………………….42
F7b: Percent of weekly billing detail reports submitted on-time by contractor..43
Appendices (con’t)

26
PMP- page 2Objective Measure
FY04 Target
FY05 Target
FY06 Target
Initiative Owner
C1a: Number of breaches by commercial vehicles not being tested using critical steps in SOP 0 0 QA Team
C1b: Number of breaches by passenger vehicles not being tested using critical steps in SOP 0 0 QA Team
C1c: Number of failures to properly escalate positive ion scan when it occurs
95 - 100%
95 - 100%
QA Team
C2a: Number of failures to fully screen employees 0 - 50 0 - 50 QA Team
C2b: Number of failures to fully screen visitors0 - 50 0 - 50 QA Team
C2c: Number of failures to properly escalate positive ion scan when it occurs 0 0 QA Team
C2d. Percent of posts with current SOPs in Guard Duty Book
95 - 100%
95 - 100%
QA Team
C2e: Hours supporting Special EventsQA Team
C3: Project a positive and professional image in the delivery
of NIH Guard services to our customers
C3: Number of observations of deficient professional conduct and demeanor while on duty (e.g., sleeping on post, talking on phone, reading on post, not in possession of flashlight, pen and notepad, traffic vest)
0 - 15 0 - 15 Implement the QASP QA Team
C4a: Number of substantiated complaints after adjudication Baseline 0 - 30 Display contact signs QA Team
C4b: Customer Satisfaction Ratings for Security Guard Services 95% -
100%95% - 100%
Develop items for 2004 NIH Security Survey with OQM
Patty
Implement the QASP
Cu
sto
mer
C2: Provide an environment that is safe and secure for personnel and others while at NIH facilities
Implement the QASP
C1: Decrease the probability of weaponized vehicles from entering
the NIH Bethesda campus
C4: Increase customer satisfaction with the delivery of
NIH Guard services

27
PMP- page 3Objective Measure
FY04 Target
FY05 Target
Initiative Owner
IB1: Increase the consistency in guard service delivery to minimize disruption to the NIH community
IB1: Average processing time to complete visitor vehicle inspection
Under 4 minutes
Under 4 minutes
Implement the QASP QA Team
IB2: Improve contract management
IB2: Percent of guards on selected list who possess both Maryland Security Guard Certification (MSGC) and CPR certification (or have application pending)
95 - 100%
95 - 100%
Implement the QASP QA Team
ObjectiveFY04
TargetFY05
TargetInitiative Owner
LG1: Increase knowledge, skills and abilities of staff
LG1a: Percent of IDP tasks completed for Government Staff
> FY03 > FY04 Tom
LG2a: Hours of skill enhancement by technology type
> FY03 >FY04 Tom
LG2b: Number of technology tools acquired to increase NIH security
> FY03 > FY04
Obtain Automatic Vehicle Counters
Automatic DL Scanners
Andover Readers at Employee
Gates/Bldgs
Patty
LG1a: Training hours in PBSC Baseline > FY04 Patty
LG1b: Number of benchmarking visits to other organizations
Baseline > FY04 Patty
LG2: Use innovative technology to enhance skills and improve performance
Inte
rnal
Bu
sin
ess
Lea
rnin
g a
nd
Gro
wth
LG3: Learn best practices from others

28
PMP- page 4Objective Measure
FY04 Target
FY05 Target
Initiative Owner
F1: Minimize the unit cost of providing building security services on campus (DS1)
F1: Number of employees and visitors screened on-campus/month
Baseline >=FY04 Patty/Larry
F2: Minimize the unit cost of providing building security services off campus (DS2)
F2: Number of employees and visitors screened off-campus/month
Baseline >=FY04 Patty/Larry
F3: Minimze the unit cost of providing guard perimeter security services (visitor center, employee entrances) (DS3)
F3: Number of vehicles screened at employee entrances/month
Baseline >=FY04 Patty/Larry
F4: Minimize the unit cost of performing vehicle security inspections (CVI, W. Cedar, perimeter garage) (DS4)
F4: Number of vehicles checked at visitor gates/month
Baseline >=FY04 Patty/Larry
F5: Minimize the unit cost of performing underground vehicle security inspections (parking garages) (DS5)
F5: Number of parking garage inspections Baseline >=FY04 Patty/Larry
F6: Minimize the unit cost of providing guard services for special events (DS6)
F6: Number of potential attendees per special event
Udon
F7a: Total hours per 2-week period 1,700/wk >=FY04 Scott
F7b: Percent of weekly Billing Details Reports submitted on-time by contractor
95 - 100%
95 - 100%
QA TeamImplement the QASP
Implement the Monthly Statistics Report of Vehicles
and People
Fin
anci
al
F7: Optimize available guard resources

29
C1a. Number of breaches by commercial vehicles not being tested using critical steps in SOP
00 0
0
20
40
60
80
100
Bre
ache
s
MAR APR MAY Quarterly TotalCase Samples 160 160 160 480Breaches 0 0 0 0Incentive/Disincentive $24,000.00
1. Obtain and review driver’s license
2. Review manifest and/or bill of lading
3. Log appropriate information
4. Conduct ion-swab for steering wheel
5. Conduct ion-swab inside of cargo/storage
6. Analyze ion-swab using ion detection-scan

30
C1b. Number of breaches by passenger vehicles not being tested using critical steps in SOP
4
12
0
0
20
40
60
80
100
MAR
APRM
AY
Bre
ach
es
MAR APR MAY Quarterly TotalCase Samples 880 880 880 2640Breaches 13 4 0 17Incentive/Disincentive -$24,000.00
1. Visitor: Obtain driver’s license and review
Employee: Check ID Badge
2. Visitor: Ask for destination
Employee: Check parking hanger/pass
3. Log appropriate information
4. Conduct ion-swab for steering wheel
5. Conduct ion-swab inside of cargo/storage
6. Analyze ion-swab using ion detection-scan

31
C1c. Number of failures to properly escalate positive ion scan when it occurs
00 0
0
20
40
60
80
100F
ailu
re to
Pro
per
ly E
scal
ate
1. Attempt to keep vehicle from departing
2. Notify NIH Police
3. Notify immediate supervisor
MAR APR MAY Quarterly TotalCase Samples 80 80 80 240Failure to Properly Escalate 0 0 0 0Incentive/Disincentive $6,000.00

32
C2a. Number of failures to fully screen employees
18 16
0
0
20
40
60
80
100
MAR
APRM
AY
Fai
lure
s
MAR APR MAY Quarterly TotalCase Samples 480 480 480 1440Failures 18 16 0 34Incentive/Disincentive $6,000.00
1. Ask for NIH badge2. Ensure photo matches individual3. Ensure badge isn’t expired

33
C2b. Number of failures to fully screen visitors
2 1
0
0
20
40
60
80
100
MAR
APRM
AY
Fai
lure
s
MAR APR MAY Quarterly TotalCase Samples 640 640 640 1920Failures 2 1 0 3Incentive/Disincentive $6,000.00
1. Obtain visitor identification (county, state, or federal) 2. Log information in sign-in sheet 3. Provide visitor pass 4. Direct person to x-ray/screening area 5. Visitor places metal objects into designated baskets 6. Visitor walks through the magnetometer 7. Repeat steps 5 & 6 if signal is activated 8. Use hand-held (wand) if signal is activated 9. Use hand-held for visitors with medical conditions10. Packages/objects placed on conveyor belt11. Objects scanned/food visually inspected

34
C2c. Number of failures to properly escalate positive ion scan when it occurs
00 0
0
20
40
60
80
100
Fai
lure
to P
rop
erly
Esc
alat
e
MAR APR MAY Quarterly TotalCase Samples 80 80 80 240Failure to Properly Escalate 0 0 0 0Incentive/Disincentive $3,000.00
1. Attempt to keep package/person from departing2. Notify NIH Police3. Notify immediate supervisor

35
C2d. Percent of posts with current SOPs in Guard Duty Book
100%100% 100%
0%
20%
40%
60%
80%
100%P
ost
s w
ith C
urr
ent S
OP
s
MAR APR MAY Quarterly TotalCase Samples 80 80 80 240Posts with Current SOPs 80 80 80 240Incentive/Disincentive $3,000.00
1. Posts with current NIH issued SOPs

36
C2e. Hours supporting special events

37
IB1a. Average processing time to complete visitor inspection
3.13.253.2
0
2
4
6
8
10
MAR
APRM
AY
Av
era
ge
Wa
it T
ime
s (
min
ute
s)
MAR APR MAY Quarterly TotalCase Samples 80 80 80 240Average Wait Time (minutes) 3.2 3.2 3.1 3.1Incentive/Disincentive $5,000.00
• Note: Processing-time measurement begins when guard makes contact with first vehicle of inspection group

38
LG1a. Percent of IDP tasks completed for government tasks

39
F2. Number of employees and visitors screened off- campus and on-campus per week/ year/ month
On Campus TotalsTotal weekly count = 195,763 per weekTotal monthly count= 783,052 per monthTotal yearly count= 10,179,676 per year
Average Screenings per Week by Period
11,007
24,734
18,636
23,423
19,924 19,528
21,252
13,018
8,686
6,286
1,520887 749 509
1,881
19,383
4,340
-
5,000
10,000
15,000
20,000
25,000
Off-Campus On-Campus
Off-Campus TotalsTotal weekly count = 45,864 per weekTotal monthly count= 183,456 per monthTotal yearly count= 2,384,928 per year

40
F4. Vehicle Count: Typical Week At NIH = 115,456 per week
Vehicle Count by location
- 1,000 2,000 3,000 4,000 5,000 6,000
355/ Center
355/ South (Emp)
355/ South (Visitor)
355/ Wilson
OGR/ Lincoln
OGR/ Center (CVI)
Saturday
Friday
Thursday
Wednesday
Tuesday
Monday
Sunday

41
Commercial Vehicle Count
1,5003,0004,5006,0007,5009,000
Number Of Vehicles
Month
Commercial Vehicle InspectionTrucks Cars
Trucks 1,094,886,016,6412,07,498,1210,210,49,379,787,4812,88,46113,
Cars 3,4213,422,511,919,411,510,712,010,810,012,08,6212,810,2167,
Nov-03
Dec-03
Jan Feb Mar Apr May Jun July Aug Sep Oct Nov Dec Tot
Vehicles inspected at the CVI in 2004.
Cars 167,507Trucks 113,808

42
F7a. Total hours for a two week period

43
F7b. Percent of weekly Billing Details Report submitted on-time by contactor
100%100%100%
0%
20%
40%
60%
80%
100%M
AR
APR
MAY
Re
po
rts
Su
bm
itte
d o
n T
ime
MAR APR MAY Quarterly TotalCase Samples 4 4 4 12Reports Submitted on Time 4 4 4 12Incentive/Disincentive $5,000.00
1. Submit “Billing Details” report on time.