#.1 oracle wait interface in oracle 10g. #.2 today’s session twelve wait event interface...
TRANSCRIPT

#.1
Oracle Wait Interfacein Oracle 10g

#.2
Today’s Session
Twelve wait event interface enhancements in Oracle 10g that we really like.Documentation gaps in some areas make this
information harder to come by. We will assume everyone is familiar with
wait event concepts and the wait event interface in Oracle 9i or earlier.
#.3
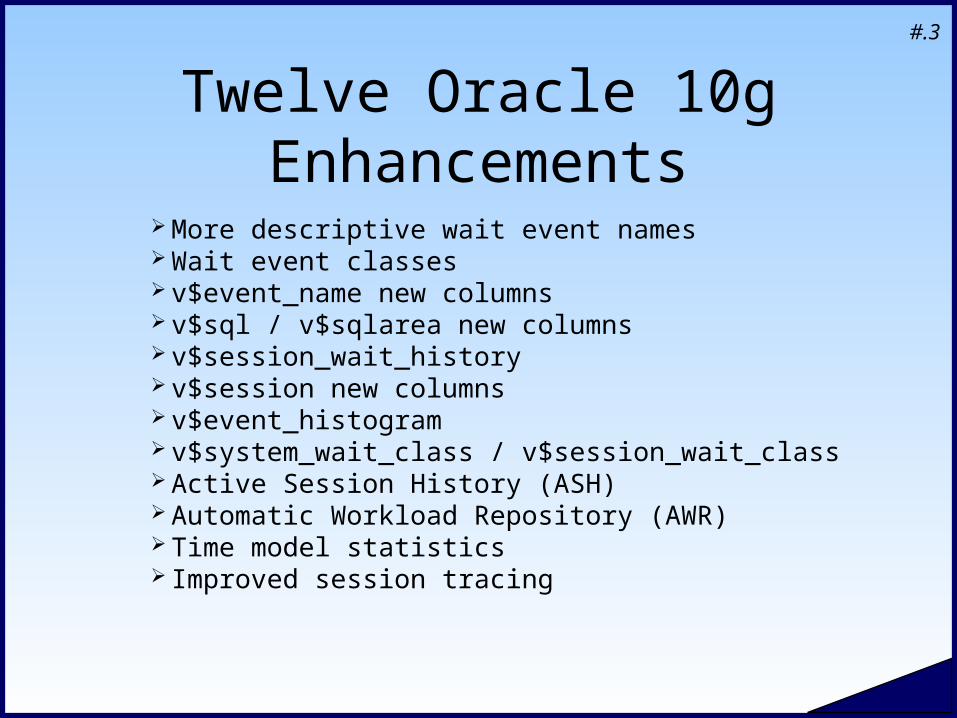
Twelve Oracle 10g Enhancements
More descriptive wait event names Wait event classes v$event_name new columns v$sql / v$sqlarea new columns v$session_wait_history v$session new columns v$event_histogram v$system_wait_class / v$session_wait_class Active Session History (ASH) Automatic Workload Repository (AWR) Time model statistics Improved session tracing

#.4

#.5
Waits
I/O
Library Cache
Locks
Redo
Buffer Cache
SQL*Net
Wait Areas
We’ll discuss Waits in these logical database areasWe’ll discuss Waits in these logical database areas
#.6
Copyright 2006 Kyle Hailey
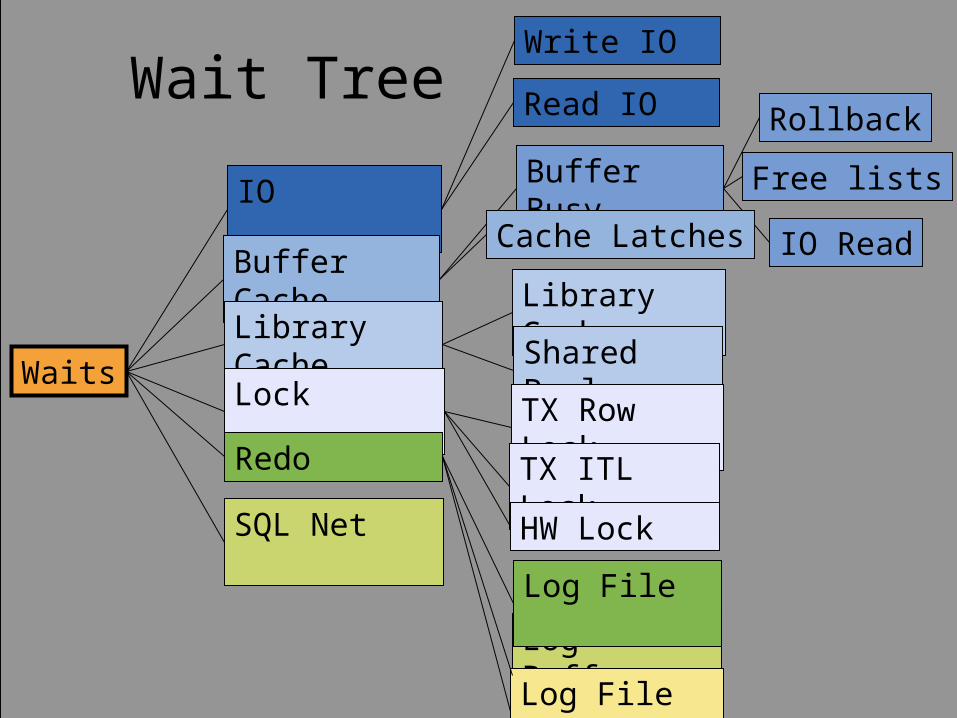
Wait Tree
Waits
IO
Buffer Cache
Library Cache
Lock
Redo
SQL Net
Buffer Busy
Rollback
Free lists
IO ReadCache Latches
Library Cache
Shared Pool
TX Row Lock
TX ITL Lock
HW Lock
Write IO
Read IO
Log Buffer
Log File Sync
Log File

#.7
What are P1,P2,P3 ? Each Wait has a 3 parameters P1,P2,P3 Give detailed information Meaning different for each wait Meaning definitions in V$event_name
Select
name,
parameter1,
parameter2,
parameter3
from v$event_name;
col parameter1 for a10col parameter1 for a10col parameter2 for a10col parameter2 for a10col parameter3 for a10col parameter3 for a10select parameter1 ,parameter2 , parameter3 select parameter1 ,parameter2 , parameter3 from v$event_namefrom v$event_namewhere name = '&1';where name = '&1';

#.8
Wait Arguments Exampleselect parameter1 ,parameter2 , parameter3 select parameter1 ,parameter2 , parameter3 from v$event_name;from v$event_name;
NAME PARAMETER1 PARAMETER2 PARAMETER3------------------------------ ----------- --------------- ---------------
latch: cache buffers chains address number triesfree buffer waits file# block# set-id#buffer busy waits file# block# class#latch: redo copy address number trieslog buffer spaceswitch logfile commandlog file sync buffer#db file sequential read file# block# blocksenq: TM - contention name|mode object #
table/partitionundo segment extension segment#enq: TX - row lock contention name|mode usn<<16 | slot sequencerow cache lock cache id mode requestlibrary cache pin handle address pin address
100*mode+namesplibrary cache load lock object address lock address
100*mask+namesppipe put handle address record length timeout

#.9
Copyright 2006 Kyle Hailey
Wait Analysis requires p1,p2,p3
Of the top 30 wait events 8 can be solved without ASH
The rest need Sql_id and/or P1,P2,P3
free buffer waitslog buffer spacelog file switch (archiving needed)log file switch (checkpoint incomplete)log file switch completionlog file syncswitch logfile commandwrite complete waits

#.10
More Descriptive Names
Prior to Oracle 10g many wait events had vague names that covered many situations: latch freeenqueuebuffer busy waits
For these waits you had to look at parameter values to learn the wait condition.
Oracle 10g gives the most common of these types of waits more descriptive names.

#.11
latch free
Prior to Oracle 10g: Could indicate a wait on any of dozens of different latches.
Oracle 10g: The 26 most common latches have their own wait event.The rest continue to use the generic “latch free”
wait event.
#.12
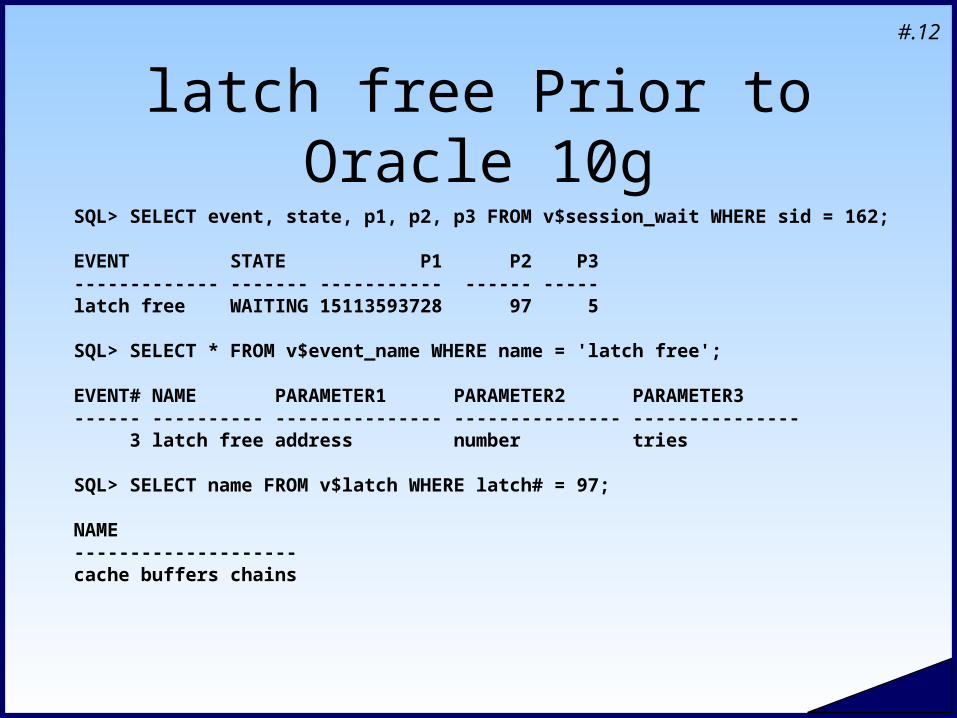
latch free Prior to Oracle 10gSQL> SELECT event, state, p1, p2, p3 FROM v$session_wait WHERE sid = 162;
EVENT STATE P1 P2 P3------------- ------- ----------- ------ -----latch free WAITING 15113593728 97 5
SQL> SELECT * FROM v$event_name WHERE name = 'latch free';
EVENT# NAME PARAMETER1 PARAMETER2 PARAMETER3------ ---------- --------------- --------------- --------------- 3 latch free address number tries
SQL> SELECT name FROM v$latch WHERE latch# = 97;
NAME--------------------cache buffers chains

#.13
latch free in Oracle 10g
SQL> SELECT event, state 2 FROM v$session_wait 3 WHERE sid = 162;
EVENT STATE ------------------------------ -------latch: cache buffers chains WAITING
The more descriptive wait event name saves us the effort of decoding wait event parameters.
#.14
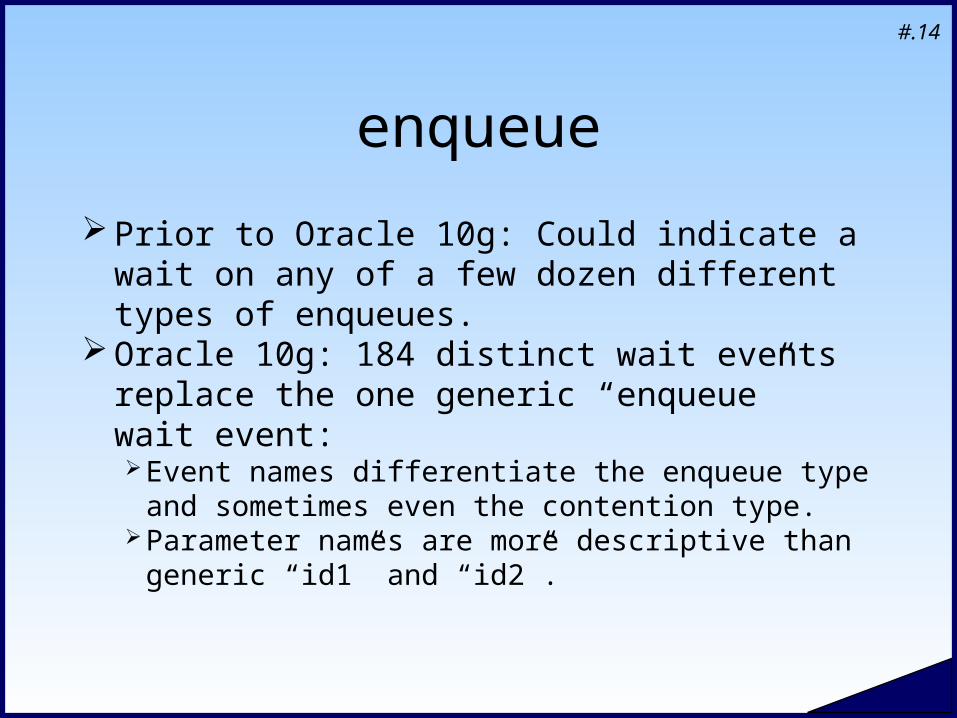
enqueue
Prior to Oracle 10g: Could indicate a wait on any of a few dozen different types of enqueues.
Oracle 10g: 184 distinct wait events replace the one generic “enqueue” wait event: Event names differentiate the enqueue type and
sometimes even the contention type.Parameter names are more descriptive than
generic “id1” and “id2”.
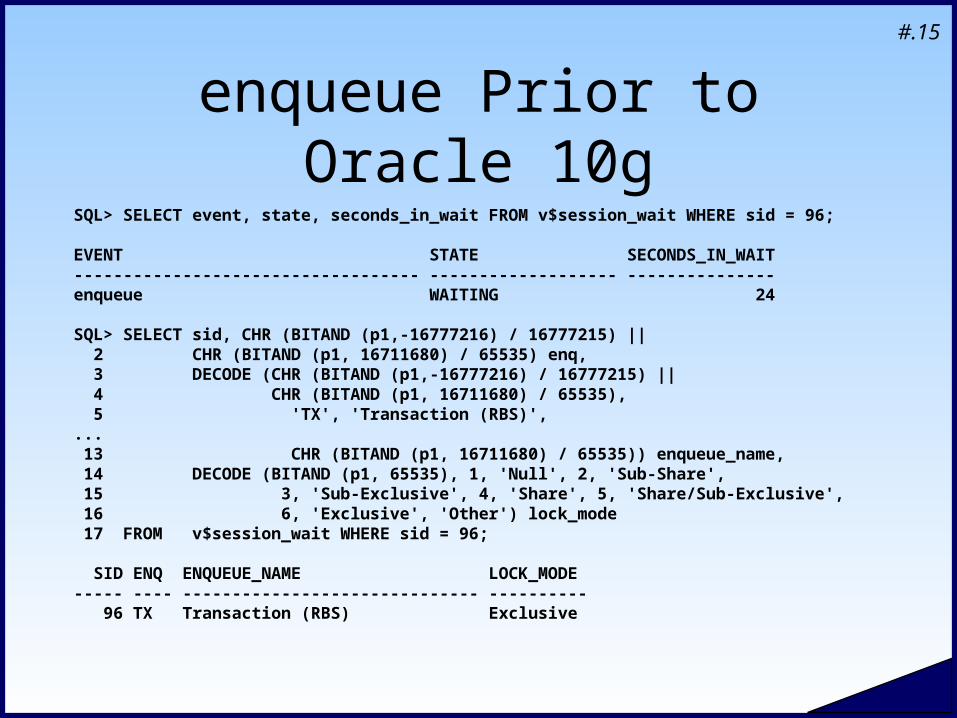
#.15
enqueue Prior to Oracle 10gSQL> SELECT event, state, seconds_in_wait FROM v$session_wait WHERE sid = 96;
EVENT STATE SECONDS_IN_WAIT----------------------------------- ------------------- ---------------enqueue WAITING 24
SQL> SELECT sid, CHR (BITAND (p1,-16777216) / 16777215) || 2 CHR (BITAND (p1, 16711680) / 65535) enq, 3 DECODE (CHR (BITAND (p1,-16777216) / 16777215) || 4 CHR (BITAND (p1, 16711680) / 65535), 5 'TX', 'Transaction (RBS)',... 13 CHR (BITAND (p1, 16711680) / 65535)) enqueue_name, 14 DECODE (BITAND (p1, 65535), 1, 'Null', 2, 'Sub-Share', 15 3, 'Sub-Exclusive', 4, 'Share', 5, 'Share/Sub-Exclusive', 16 6, 'Exclusive', 'Other') lock_mode 17 FROM v$session_wait WHERE sid = 96;
SID ENQ ENQUEUE_NAME LOCK_MODE----- ---- ------------------------------ ---------- 96 TX Transaction (RBS) Exclusive

#.16
enqueue in Oracle 10gSQL> SELECT event, state, seconds_in_wait FROM v$session_wait WHERE sid = 143;
EVENT STATE SECONDS_IN_WAIT----------------------------------- ------------------- ---------------enq: TX - row lock contention WAITING 495
Separate events for separate TX issues: SQL> SELECT name, parameter1, parameter2, parameter3 2 FROM v$event_name 3 WHERE name LIKE 'enq: TX%';
NAME PARAMETER1 PARAMETER2 PARAMETER3 ------------------------------ ------------- --------------- ------------- enq: TX - contention name|mode usn<<16 | slot sequence enq: TX - row lock contention name|mode usn<<16 | slot sequence enq: TX - allocate ITL entry name|mode usn<<16 | slot sequence enq: TX - index contention name|mode usn<<16 | slot sequence

#.17
enqueue in Oracle 10g
More descriptive parameter names, too: SQL> SELECT name, parameter1, parameter2, parameter3 2 FROM v$event_name 3 WHERE name IN ('enq: HW - contention', 'enq: SQ - contention');
NAME PARAMETER1 PARAMETER2 PARAMETER3 ------------------------------ ------------- --------------- ------------- enq: HW - contention name|mode table space # block enq: SQ - contention name|mode object # 0

#.18
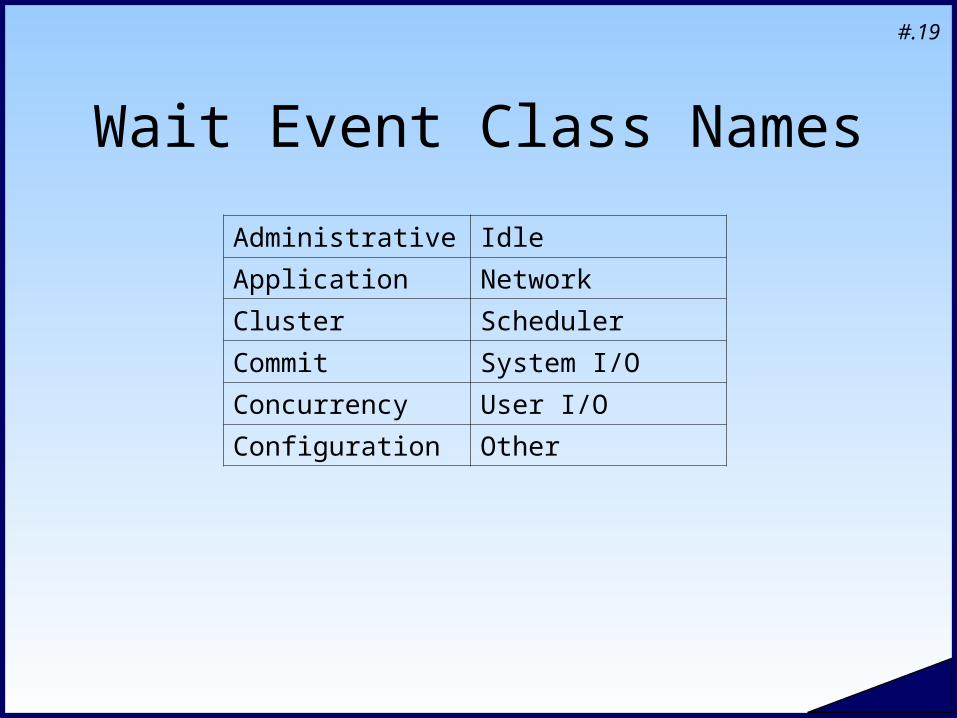
Wait Event Classes
Every wait event belongs to one of 12 classes. Classes can help point toward a root cause. Almost 70% of all wait events belong to a class
called “Other.” Most of the wait events that occur frequently
belong to wait event classes with helpful names.
#.19
Wait Event Class Names
Administrative Idle
Application Network
Cluster Scheduler
Commit System I/O
Concurrency User I/O
Configuration Other

#.20
Wait Class Assignments
SQL> SELECT wait_class, name 2 FROM v$event_name 3 WHERE name LIKE 'enq: TX%' 4 ORDER BY wait_class, name;
WAIT_CLASS NAME--------------- ----------------------------------------Application enq: TX - row lock contentionConcurrency enq: TX - index contentionConfiguration enq: TX - allocate ITL entryOther enq: TX - contention

#.21
v$event_name
Three new columns show which wait class a wait event belongs to:
SQL> DESCRIBE v$event_name Name Null? Type ----------------------------------------- -------- ------------------- EVENT# NUMBER EVENT_ID NUMBER NAME VARCHAR2(64) PARAMETER1 VARCHAR2(64) PARAMETER2 VARCHAR2(64) PARAMETER3 VARCHAR2(64) WAIT_CLASS_ID NUMBER WAIT_CLASS# NUMBER WAIT_CLASS VARCHAR2(64)

#.22
v$sql and v$sqlarea
Six new columns give more information about how time was spent executing a SQL statement:application_wait_timeconcurrency_wait_timecluster_wait_time user_io_wait_time plsql_exec_time java_exec_time
Times are in microseconds.
#.23
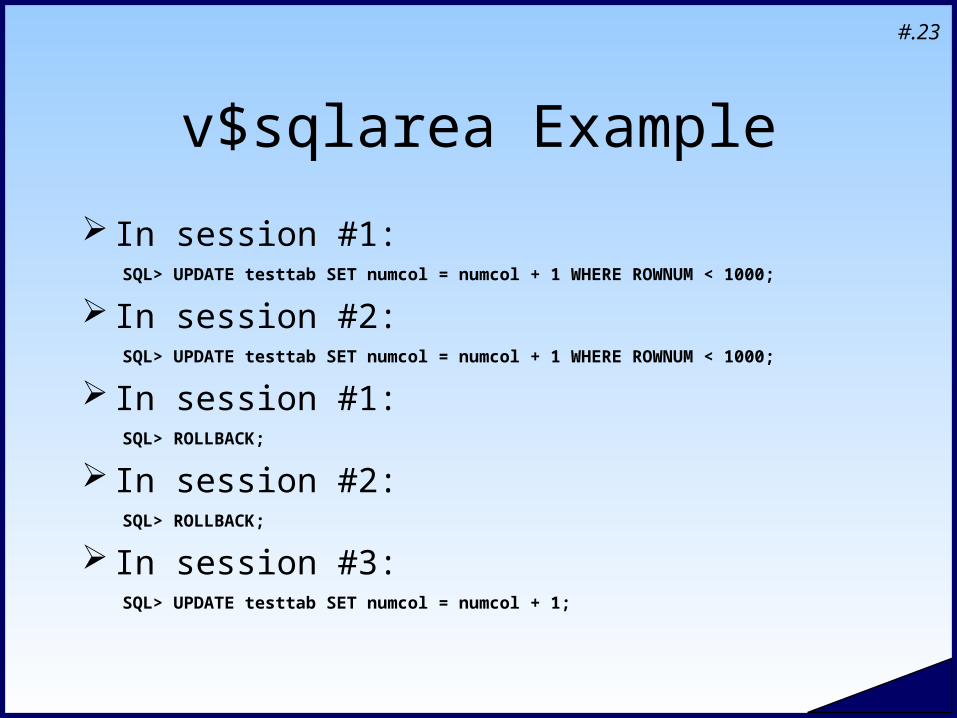
v$sqlarea Example
In session #1: SQL> UPDATE testtab SET numcol = numcol + 1 WHERE ROWNUM < 1000;
In session #2: SQL> UPDATE testtab SET numcol = numcol + 1 WHERE ROWNUM < 1000;
In session #1: SQL> ROLLBACK;
In session #2: SQL> ROLLBACK;
In session #3: SQL> UPDATE testtab SET numcol = numcol + 1;
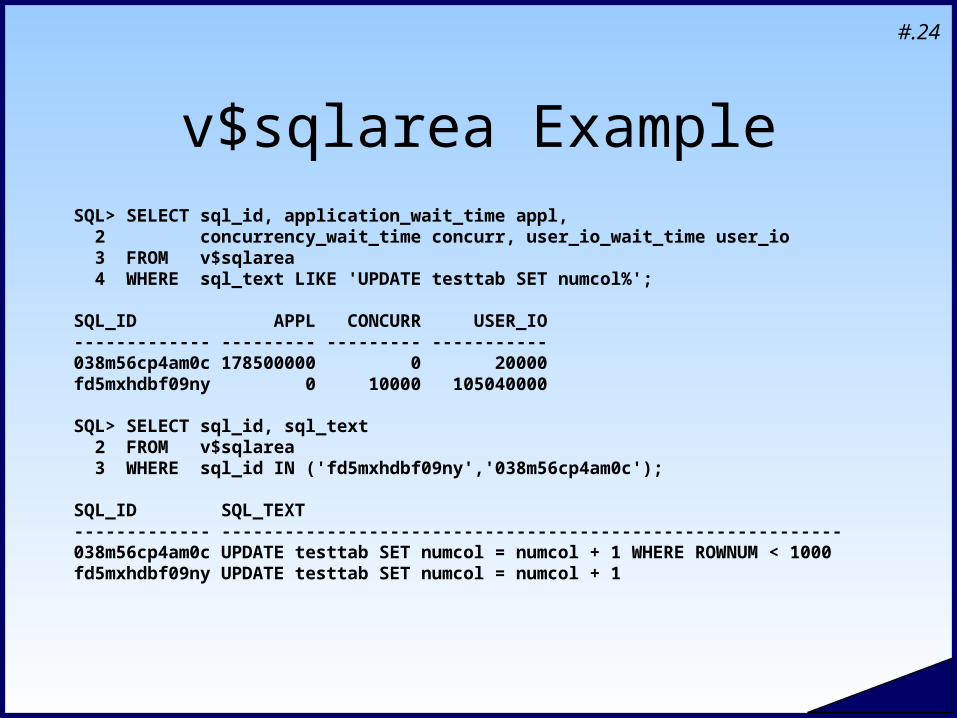
#.24
v$sqlarea ExampleSQL> SELECT sql_id, application_wait_time appl, 2 concurrency_wait_time concurr, user_io_wait_time user_io 3 FROM v$sqlarea 4 WHERE sql_text LIKE 'UPDATE testtab SET numcol%';
SQL_ID APPL CONCURR USER_IO ------------- --------- --------- -----------038m56cp4am0c 178500000 0 20000fd5mxhdbf09ny 0 10000 105040000
SQL> SELECT sql_id, sql_text 2 FROM v$sqlarea 3 WHERE sql_id IN ('fd5mxhdbf09ny','038m56cp4am0c');
SQL_ID SQL_TEXT------------- -----------------------------------------------------------038m56cp4am0c UPDATE testtab SET numcol = numcol + 1 WHERE ROWNUM < 1000fd5mxhdbf09ny UPDATE testtab SET numcol = numcol + 1

#.25
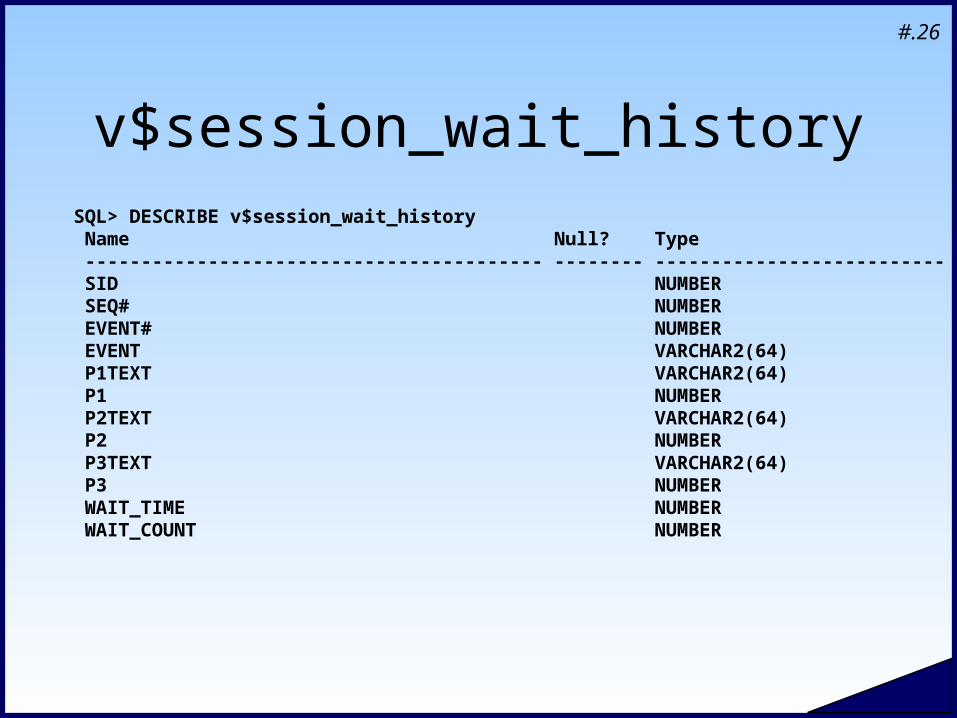
v$session_wait_history
New view in Oracle 10g. Similar to v$session_wait, but shows the last
ten wait events for each session. The seq# column is supposed to show the
order in which the waits occurred, with 1 being the most recent wait:Different from seq# in v$session.Does not appear to work as documented (on our
10.1.0.3 system on Solaris).
#.26
v$session_wait_historySQL> DESCRIBE v$session_wait_history Name Null? Type ----------------------------------------- -------- -------------------------- SID NUMBER SEQ# NUMBER EVENT# NUMBER EVENT VARCHAR2(64) P1TEXT VARCHAR2(64) P1 NUMBER P2TEXT VARCHAR2(64) P2 NUMBER P3TEXT VARCHAR2(64) P3 NUMBER WAIT_TIME NUMBER WAIT_COUNT NUMBER
#.27
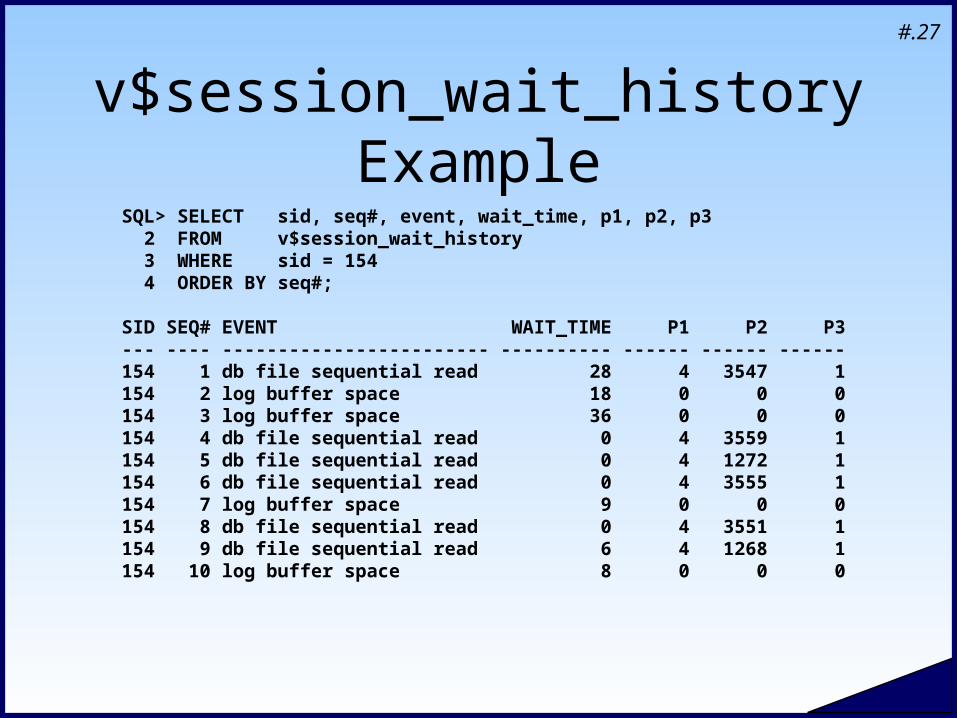
v$session_wait_history Example
SQL> SELECT sid, seq#, event, wait_time, p1, p2, p3 2 FROM v$session_wait_history 3 WHERE sid = 154 4 ORDER BY seq#;
SID SEQ# EVENT WAIT_TIME P1 P2 P3--- ---- ------------------------ ---------- ------ ------ ------154 1 db file sequential read 28 4 3547 1154 2 log buffer space 18 0 0 0154 3 log buffer space 36 0 0 0154 4 db file sequential read 0 4 3559 1154 5 db file sequential read 0 4 1272 1154 6 db file sequential read 0 4 3555 1154 7 log buffer space 9 0 0 0154 8 db file sequential read 0 4 3551 1154 9 db file sequential read 6 4 1268 1154 10 log buffer space 8 0 0 0
#.28
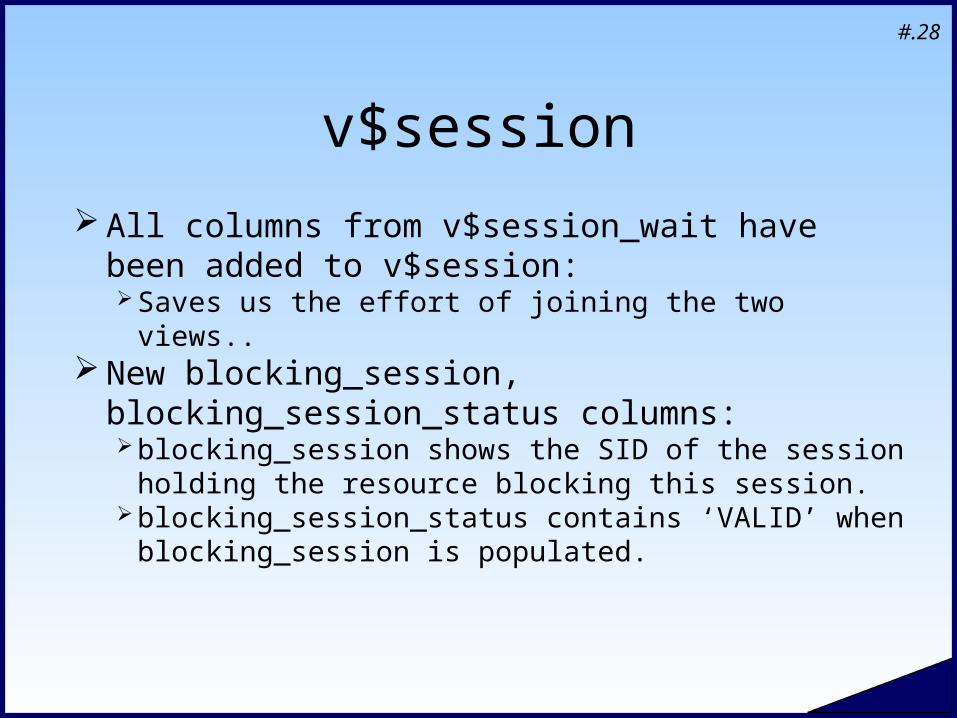
v$session
All columns from v$session_wait have been added to v$session:Saves us the effort of joining the two views..
New blocking_session, blocking_session_status columns:blocking_session shows the SID of the session
holding the resource blocking this session.blocking_session_status contains ‘VALID’ when
blocking_session is populated.

#.29
v$session Example
Prior to Oracle 10g: SQL> SELECT s.sid, w.state, w.event, w.seconds_in_wait siw, 2 s.sql_address, s.sql_hash_value hash_value, w.p1, w.p2, w.p3 3 FROM v$session s, v$session_wait w 4 WHERE s.sid = w.sid 5 AND s.sid = 154;
Oracle 10g: SQL> SELECT sid, state, event, seconds_in_wait siw, 2 sql_address, sql_hash_value hash_value, p1, p2, p3 3 FROM v$session 4 WHERE sid = 154;
#.30
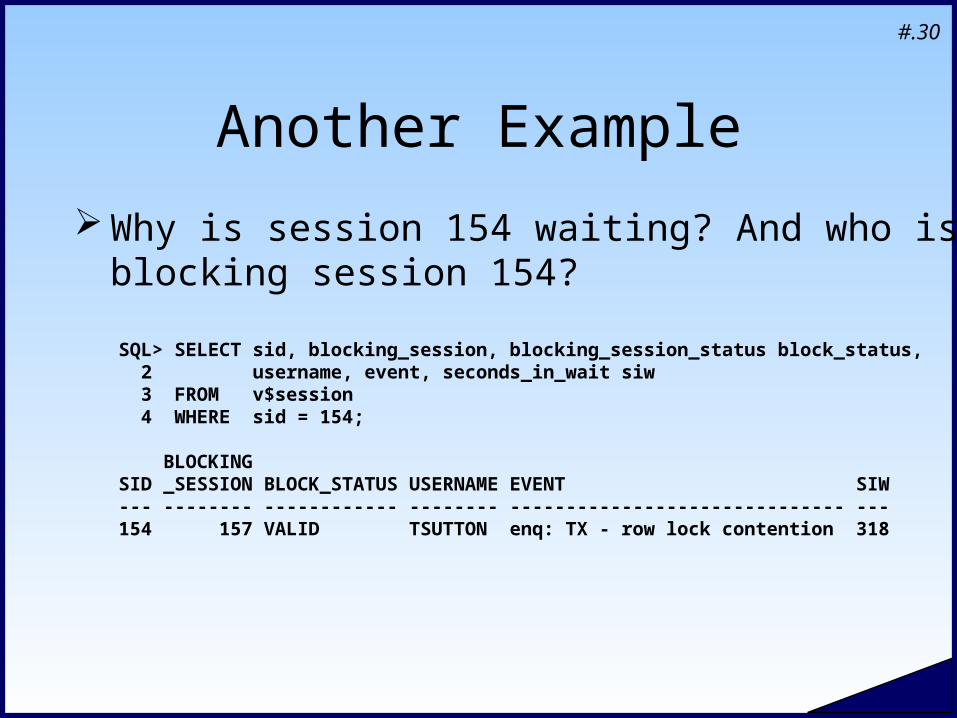
Another Example
Why is session 154 waiting? And who is blocking session 154?
SQL> SELECT sid, blocking_session, blocking_session_status block_status, 2 username, event, seconds_in_wait siw 3 FROM v$session 4 WHERE sid = 154;
BLOCKING SID _SESSION BLOCK_STATUS USERNAME EVENT SIW --- -------- ------------ -------- ------------------------------ --- 154 157 VALID TSUTTON enq: TX - row lock contention 318
#.31
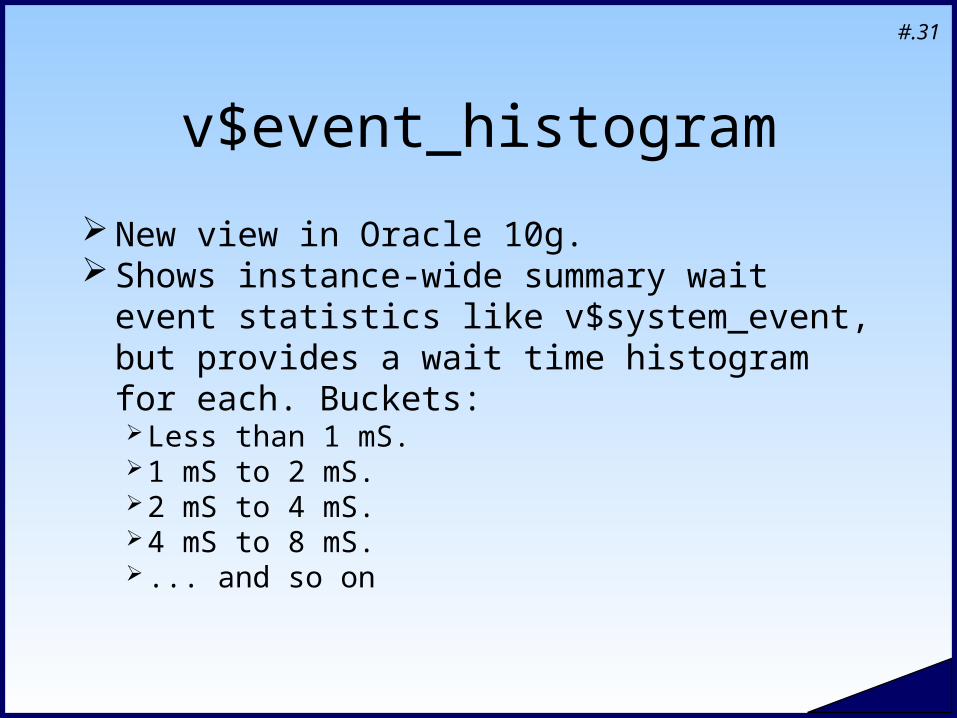
v$event_histogram
New view in Oracle 10g. Shows instance-wide summary wait event
statistics like v$system_event, but provides a wait time histogram for each. Buckets:Less than 1 mS.1 mS to 2 mS.2 mS to 4 mS.4 mS to 8 mS. ... and so on

#.32
v$event_histogramSQL> DESCRIBE v$event_histogram Name Null? Type ----------------------------------------- -------- --------------------------- EVENT# NUMBER EVENT VARCHAR2(64) WAIT_TIME_MILLI NUMBER WAIT_COUNT NUMBER
#.33
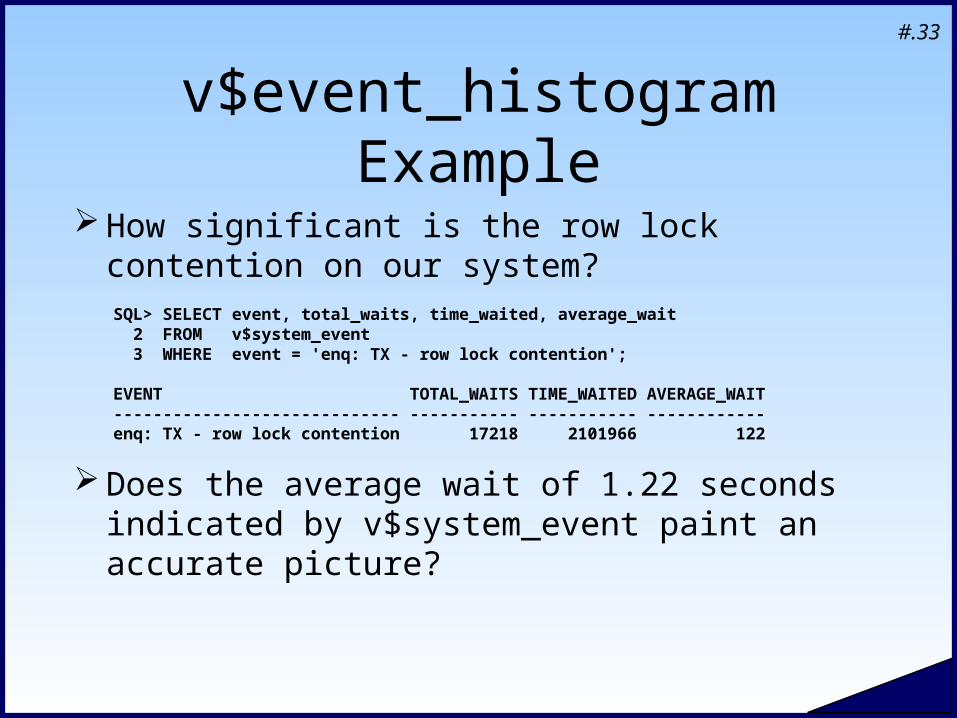
v$event_histogram Example
How significant is the row lock contention on our system?
SQL> SELECT event, total_waits, time_waited, average_wait 2 FROM v$system_event 3 WHERE event = 'enq: TX - row lock contention';
EVENT TOTAL_WAITS TIME_WAITED AVERAGE_WAIT ----------------------------- ----------- ----------- ------------ enq: TX - row lock contention 17218 2101966 122
Does the average wait of 1.22 seconds indicated by v$system_event paint an accurate picture?
#.34
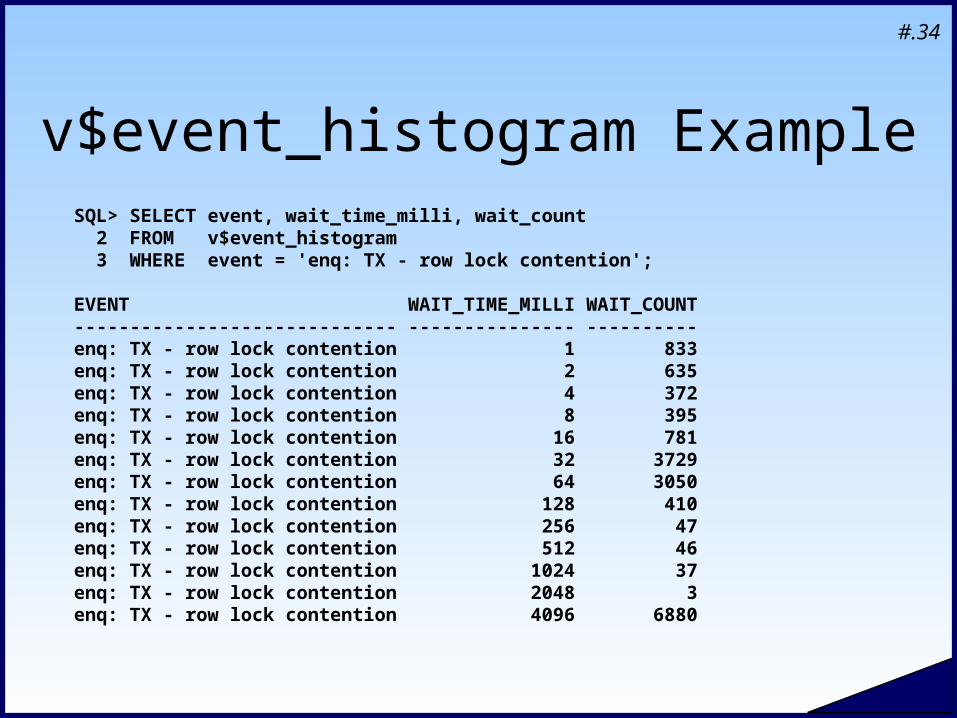
v$event_histogram ExampleSQL> SELECT event, wait_time_milli, wait_count 2 FROM v$event_histogram 3 WHERE event = 'enq: TX - row lock contention';
EVENT WAIT_TIME_MILLI WAIT_COUNT----------------------------- --------------- ----------enq: TX - row lock contention 1 833enq: TX - row lock contention 2 635enq: TX - row lock contention 4 372enq: TX - row lock contention 8 395enq: TX - row lock contention 16 781enq: TX - row lock contention 32 3729enq: TX - row lock contention 64 3050enq: TX - row lock contention 128 410enq: TX - row lock contention 256 47enq: TX - row lock contention 512 46enq: TX - row lock contention 1024 37enq: TX - row lock contention 2048 3enq: TX - row lock contention 4096 6880

#.35
v$system_wait_class and v$session_wait_class
New views in Oracle 10g. Show wait counts and total time waited since
instance startup and session start. Similar to v$system_event and v$session_event,
but summarized by wait class. Times are in centiseconds.
#.36
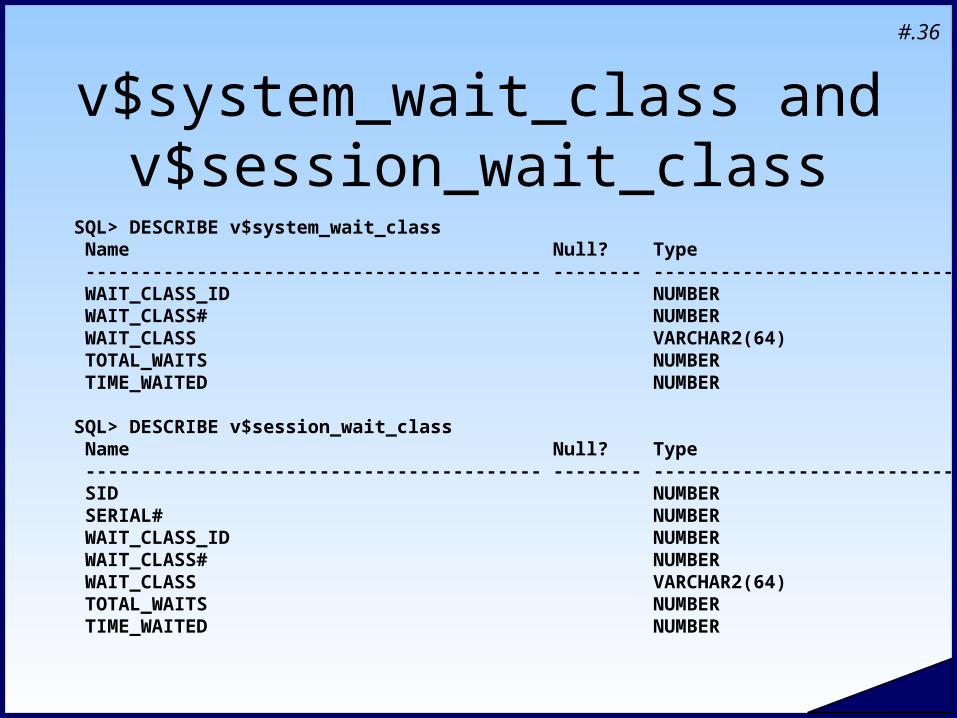
v$system_wait_class and v$session_wait_class
SQL> DESCRIBE v$system_wait_class Name Null? Type ----------------------------------------- -------- --------------------------- WAIT_CLASS_ID NUMBER WAIT_CLASS# NUMBER WAIT_CLASS VARCHAR2(64) TOTAL_WAITS NUMBER TIME_WAITED NUMBER
SQL> DESCRIBE v$session_wait_class Name Null? Type ----------------------------------------- -------- --------------------------- SID NUMBER SERIAL# NUMBER WAIT_CLASS_ID NUMBER WAIT_CLASS# NUMBER WAIT_CLASS VARCHAR2(64) TOTAL_WAITS NUMBER TIME_WAITED NUMBER

#.37
v$system_wait_class Example
SQL> SELECT wait_class, time_waited 2 FROM v$system_wait_class 3 ORDER BY time_waited DESC;
WAIT_CLASS TIME_WAITED------------- -----------Idle 777450022System I/O 1261584User I/O 116667Configuration 116481Application 72301Other 12432Commit 3496Concurrency 319Network 1
#.38
Active Session History
New MMNL background process samples v$session once each second.
Data captured on active sessions is available in v$active_session_history, usually for 1-4+ hours.
Automatic Workload Repository captures one out of every ten samples in its hourly snapshots.

#.39
Active Session HistorySQL> DESCRIBE v$active_session_history Name Null? Type ----------------------------------------- -------- --------------------------- SAMPLE_ID NUMBER SAMPLE_TIME TIMESTAMP(3) SESSION_ID NUMBER SESSION_SERIAL# NUMBER USER_ID NUMBER SQL_ID VARCHAR2(13) SQL_CHILD_NUMBER NUMBER SQL_PLAN_HASH_VALUE NUMBER SQL_OPCODE NUMBER SERVICE_HASH NUMBER SESSION_TYPE VARCHAR2(10) SESSION_STATE VARCHAR2(7) QC_SESSION_ID NUMBER QC_INSTANCE_ID NUMBER EVENT VARCHAR2(64) EVENT_ID NUMBER EVENT# NUMBER SEQ# NUMBER P1 NUMBER P2 NUMBER P3 NUMBER WAIT_TIME NUMBER TIME_WAITED NUMBER CURRENT_OBJ# NUMBER CURRENT_FILE# NUMBER CURRENT_BLOCK# NUMBER PROGRAM VARCHAR2(48) MODULE VARCHAR2(48) ACTION VARCHAR2(32) CLIENT_ID VARCHAR2(64)
#.40
Active Session History
v$active_session_history shows detailed wait information, current SQL statement, object/file/block information, and more.
When a wait that was sampled by ASH completes, Oracle fills in the time_waited column in the v$active_session_history row with the actual duration of the wait.

#.41
ASH is “Always On”
You may not have to turn on tracing or begin monitoring v$ views when users report a problem, because ASH is already sampling data.
In some cases you may be able to diagnose and resolve a problem on first detection, even if you learn of the problem after the fact.You may not need to get users to reproduce the
problem.

#.42
Sampling versus Collecting
ASH samples v$session once each second. Very different from extended SQL trace, which collects data on every wait and every OCI call. A session could encounter hundreds of waits in one
second, and ASH will only capture data for one of them. Use ASH to view aggregate data on many
sessions over a period of time. Don’t use ASH to count waits, get maximum wait
times, or look at a short time period.

#.43
ASH Example
SQL> SELECT DECODE (session_state, 'WAITING', event, NULL) event, 2 session_state, COUNT(*), SUM (time_waited) time_waited 3 FROM v$active_session_history 4 WHERE module = 'ARXENV' 5 AND sample_time > SYSDATE - (2/24) 6 GROUP BY DECODE (session_state, 'WAITING', event, NULL), 7 session_state;
EVENT SESSION_STATE COUNT(*) TIME_WAITED------------------------------ ------------- -------- ----------- ON CPU 124 0log file sync WAITING 2 52686db file scattered read WAITING 2 28254db file sequential read WAITING 1 6059control file sequential read WAITING 1 9206SQL*Net break/reset to client WAITING 1 9140enq: TX - row lock contention WAITING 922 930864016
#.44
Automatic Workload Repository
Conceptually similar to Statspack. Collects “snapshots” of system-wide performance
statistics, plus ASH’s sampling of session activity. You can generate activity reports using awrrpt.sql
or Enterprise Manager interface. Out of the box, Oracle 10g databases collect
snapshots hourly and retain data for seven days.

#.45
AWR Management
Snapshot data is stored in SYS-owned tables in the SYSAUX tablespace.
Use dbms_workload_repository to:Collect a snapshot on demand.Purge snapshots.Adjust snapshot interval.Adjust snapshot retention period.Disable AWR snapshot collection.

#.46
AWR versus Statspack
AWR benefits:More tightly integrated into Oracle kernel, reducing
snapshot collection overhead.Snapshots include sampling of ASH data.Data collected by AWR is accessible via views with
names starting DBA_HIST.DBA_HIST views are documented.
Statspack has been updated to be “10g aware”.
#.47
Time Model Statistics
New concept in Oracle 10g. Two new views provide a more detailed
picture of how Oracle spends time:Separates out background and user processes.Provides data not previously available, such as
how much time was spent in PL/SQL execution. Times are in microseconds.

#.48
Time Model StatisticsSQL> DESCRIBE v$sys_time_model Name Null? Type ---------------------------------------- -------- --------------------------- STAT_ID NUMBER STAT_NAME VARCHAR2(64) VALUE NUMBER
SQL> DESCRIBE v$sess_time_model Name Null? Type ---------------------------------------- -------- --------------------------- SID NUMBER STAT_ID NUMBER STAT_NAME VARCHAR2(64) VALUE NUMBER

#.49
Time Model Statistics
Some important notes about these statistics:Statistics do not include background processes
unless “background” appears in the statistic name. “DB time” shows elapsed time spent in Oracle
calls. (Basically CPU time plus non-idle waits.)

#.50
Time Model Statistics ExampleSQL> SELECT stat_name, value / 1000000 seconds FROM v$sys_time_model 2 ORDER BY seconds DESC;
STAT_NAME SECONDS------------------------------------------------ ----------DB time 80970.190sql execute elapsed time 75057.271DB CPU 44448.628background elapsed time 29333.160PL/SQL execution elapsed time 8824.538background cpu time 5170.311parse time elapsed 1270.147hard parse elapsed time 838.068PL/SQL compilation elapsed time 176.731sequence load elapsed time 112.334connection management call elapsed time 44.644failed parse elapsed time 11.946hard parse (sharing criteria) elapsed time 5.579hard parse (bind mismatch) elapsed time 4.610failed parse (out of shared memory) elapsed time 0.000Java execution elapsed time 0.000inbound PL/SQL rpc elapsed time 0.000
#.51
Tracing Improvements
Enabling extended SQL trace in another session is now more convenient.
Tracing sessions in a connection pooling or shared server environment is no longer impractical.
New dbms_monitor package offers these two benefits and more.

#.52
Tracing Prior to Oracle 10g
Tracing sessions in Oracle 9i and earlier had annoyances:dbms_support usually missing or not installed.dbms_system.set_ev not officially supported.ALTER SESSION SET EVENTS to set 10046
event has a syntax hard (for some of us) to remember.

#.53
Easier Tracing in Oracle 10g
Control tracing of your own session: EXECUTE dbms_monitor.session_trace_enable (waits=>TRUE, binds=>TRUE); EXECUTE dbms_monitor.session_trace_disable ();
Control tracing of another session: EXECUTE dbms_monitor.session_trace_enable (session_id=>153, waits=>TRUE); EXECUTE dbms_monitor.session_trace_disable (session_id=>153);
Tracing sessions in Oracle 10g is easier because dbms_monitor is provided and installed in every Oracle 10g database by default.
#.54
Tracing Prior to Oracle 10g
Straightforward if session being traced uses dedicated server connection.
Tracing session using shared server architecture leads to multiple trace files that have to be merged manually.
Tracing an end-user session that does not map to one Oracle session (eg: connection pooling or multiplexing) is not practical.

#.55
New Tracing Features in 10g
Tracing can be enabled for sessions with a specific client identifier:
EXECUTE dbms_session.set_identifier ('client identifier'); EXECUTE dbms_session.clear_identifier ();
Tracing can be enabled for sessions with specific service / module / action combination:
EXECUTE dbms_application_info.set_module ('module name', 'action name'); EXECUTE dbms_application_info.set_action ('action name');
Trace data split over multiple trace files can be merged into one trace file for TKPROF processing:
$ trcsess output= [clientid=] [service=] [module=] [action=] [session=]

#.56
Connection Pooling Example
Application server connection pooling code:EXECUTE dbms_session.set_identifier ('session_id from application table');...do the work for this end user session...EXECUTE dbms_session.clear_identifier ();
Trace the end-user session assigned session_id 12345 in the application’s sessions table:
SQL> EXECUTE dbms_monitor.client_id_trace_enable -> (client_id=>'12345', waits=>TRUE, binds=>TRUE);
Consolidate trace data into one trace file suitable for use by TKPROF:
$ cd $ORACLE_BASE/admin/$ORACLE_SID/udump$ trcsess output=mytracefile.trc clientid=12345

#.57
Twelve Oracle 10g Enhancements
More descriptive wait event names Wait event classes v$event_name new columns v$sql / v$sqlarea new columns v$session_wait_history v$session new columns v$event_histogram v$system_wait_class / v$session_wait_class Active Session History (ASH) Automatic Workload Repository (AWR) Time model statistics Improved session tracing

#.58
Wrapping Up
Oracle 10g includes many enhancements to the wait event interface that should make performance management using wait event methodologies easier than ever.
Some are just conveniences:More descriptive event names, wait event classes,
dbms_monitor.session_trace_enable... Some provide data previously unavailable:
New v$sql columns, time model statistics, v$event_histogram...