1 of 37 chapter: 7 >> krugman/wells ©2009 worth publishers tracking the macroeconomy
TRANSCRIPT

1 of 37
chapter:
7
>>
Krugman/Wells
©2009 Worth Publishers
Tracking the Macroeconomy
2 of 31
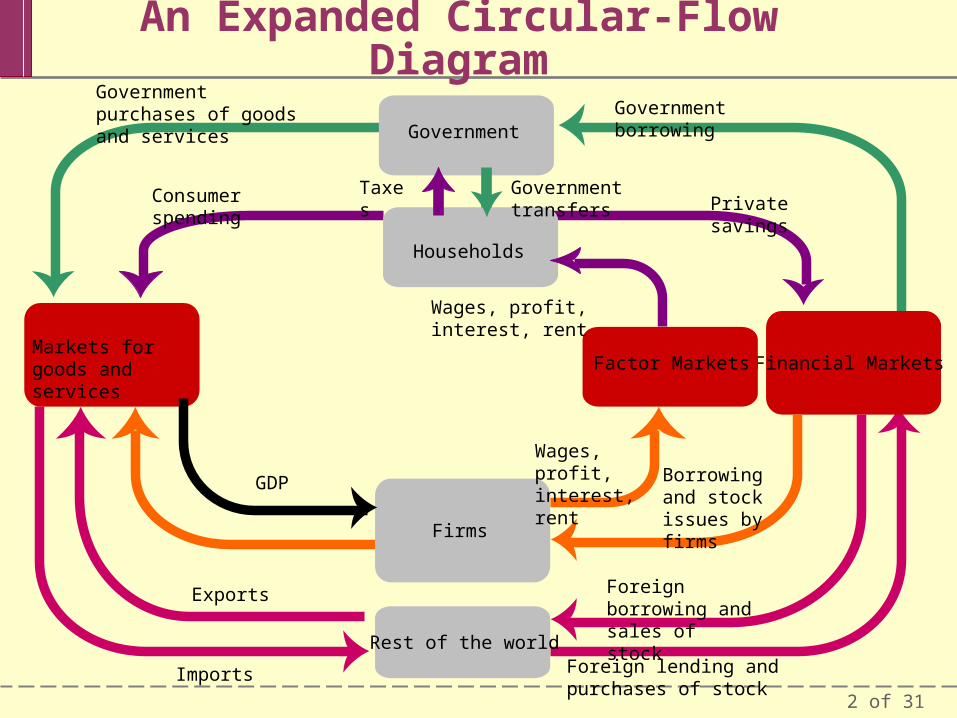
An Expanded Circular-Flow Diagram
Government
Firms
Markets for goods and services
Financial Markets
Households
Factor Markets
Rest of the world
Government purchases of goods and services
Government borrowing
Private savings
Government transfers
Wages, profit, interest, rent
Wages, profit, interest, rent
Borrowing and stock issues by firms
Foreign borrowing and sales of stock
Foreign lending and purchases of stock
Exports
Imports
GDP
Taxes
Consumer spending

3 of 37
The National Accounts
Almost all countries calculate a set of numbers known as the national income and product accounts.
The national income and product accounts, or national accounts, keep track of the flows of money between different parts of the economy.
4 of 37
Gross Domestic Product
Gross domestic product or GDP measures the total value of all final goods and services produced in the economy during a given year. It does not include the value of intermediate goods.
Aggregate spending, the sum of consumer spending, investment spending, government purchases of goods and services, and exports minus imports = the total spending on domestically produced final goods and services in the economy.

5 of 37
Calculating Gross Domestic Product
GDP can be calculated three ways:
Add up the value added of all producers
Add up all spending on domestically-produced final goods and services. This results in the equation: GDP = C + I + G + X - IM
Add up all income paid to factors of production Wages
Interest
Rent
Profit

6 of 37
Calculating Gross Domestic Product

7 of 37
PITFALLS
GDP: What’s In and What’s OutIncluded domestically produced final goods and services (including
capital goods) new construction of structures changes to inventories
Not Included intermediate goods and services inputs used goods financial assets like stocks and bonds foreign-produced goods and services

8 of 37
Real vs. Nominal GDP
Real GDP is the total value of the final goods and services produced in the economy during a given year, calculated using the prices of a selected base year.
Nominal GDP is the value of all final goods and services produced in the economy during a given year, calculated using the prices current in the year in which the output is produced.

9 of 37
Real vs. Nominal GDP
Nominal versus Real GDP in 1993, 2000, and 2007
Nominal GDP (billions of current dollars)
Real GDP (billions of 2000 dollars)
1993 $6,657 $7,533
2000 9,817 9,817
2007 13,808 11,524
How to calculate Real GDP: Multiply the Quantity of the current product with the price of the product from the base year
10 of 37
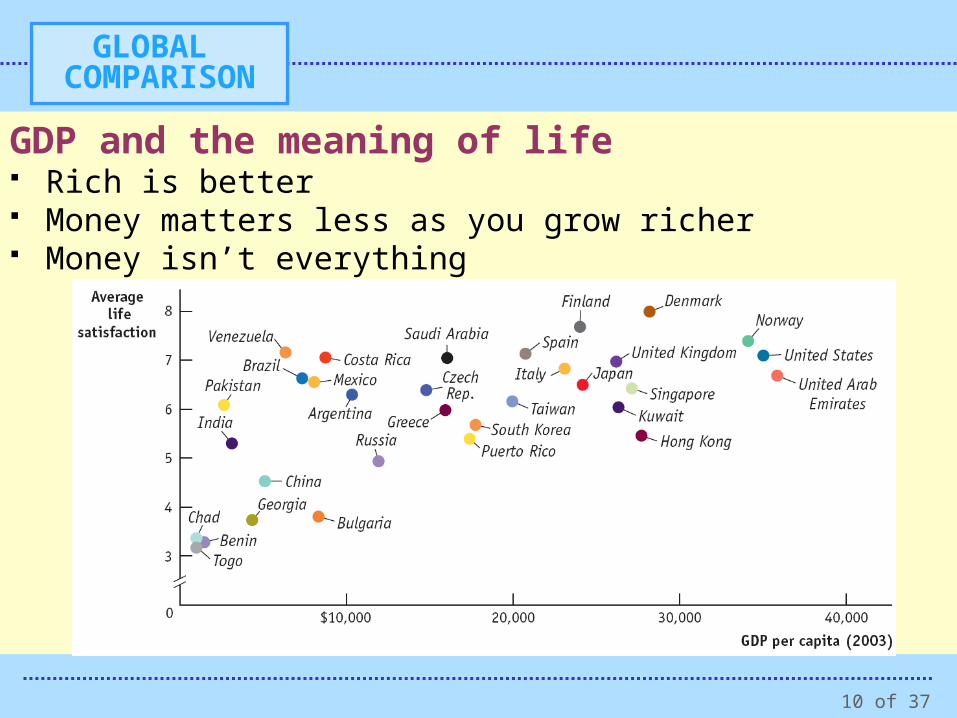
GLOBAL COMPARISON
GDP and the meaning of life Rich is better Money matters less as you grow richer Money isn’t everything

11 of 37
Price Indexes and the Aggregate Price Level
The aggregate price level is a measure of the overall level of prices in the economy.
To measure the aggregate price level, economists calculate the cost of purchasing a market basket.
A price index is the ratio of the current cost of that market basket to the cost in a base year, multiplied by 100.

12 of 37
Market Baskets and Price Indexes
Pre-frost Post-frost
Price of orange $0.20 $0.40
Price of grapefruit 0.60 1.00
Price of lemon 0.25 0.45
Cost of market basket (200 × $0.20) + (200 × $0.40) +
(200 oranges, 50 grapefruit, (50 × $0.60) + (50 × $1.00) +
100 lemons) (100 × $0.25) = $95.00 (100 × $0.45) = $175.00
Calculating GDP and Real GDP in a Simple Economy

13 of 37
Inflation Rate, CPI, and other Indexes
The inflation rate is the yearly percentage change in a price index, typically based upon Consumer Price Index, or CPI, the most common measure of the aggregate price level.
The consumer price index, or CPI, measures the cost of the market basket of a typical urban American family.

14 of 37
Consumer Price Index
Recreation5%
Education and communication
6%Other goods and services
4%
Food and beverages
16%
Motor fuel7%
Housing40%
Apparel4%
Transportation13%
Medical care5%

15 of 37
The CPI, the PPI, and the GDP Deflator
Percent change in CPI, PPI, GDP deflator
25%
20
15
10
5
0
-5
-10
-15
-20 1930 1940 1950 1960 1970 1980 1990 2000 2007
Year