1 of 37© boardworks ltd 2009 demography demography is the study of the size and structure of...
TRANSCRIPT

1 of 37 © Boardworks Ltd 2009
Demography
Demography is the study of the size and structure of populations, including a population’s age and sex distribution.
A population is all the organisms of one
species in a habitat. Populations of different
species form a community.

2 of 37 © Boardworks Ltd 2009
Demography
Demography is the study of the size and structure of populations, including a population’s age and sex distribution.
Birth rates, Death rates, Immigration rates and Emigration rates are basic factors that affect the growth and size of a population.
A population’s demographic rates are determined by the environmental conditions. Human populations are greatly affected by their level of economic development.
population
births
immigration
deaths
emigration

3 of 37 © Boardworks Ltd 2009
• On a piece of poster paper, draw the table below.
• On individual post its, write under each column factors that could affect birth rates and/or death rates:
BIRTH RATES DEATH RATES
• medical care• Sanitation• Food• Disease• Living conditions• Economy• War• Nutrition• Water supply
• Survival to reproductive age• Pre-natal care• Nutrition• Availability of contraception• Education of family planning• Lifestyle choices – women
choosing to have careers before families
4 of 37 © Boardworks Ltd 2009
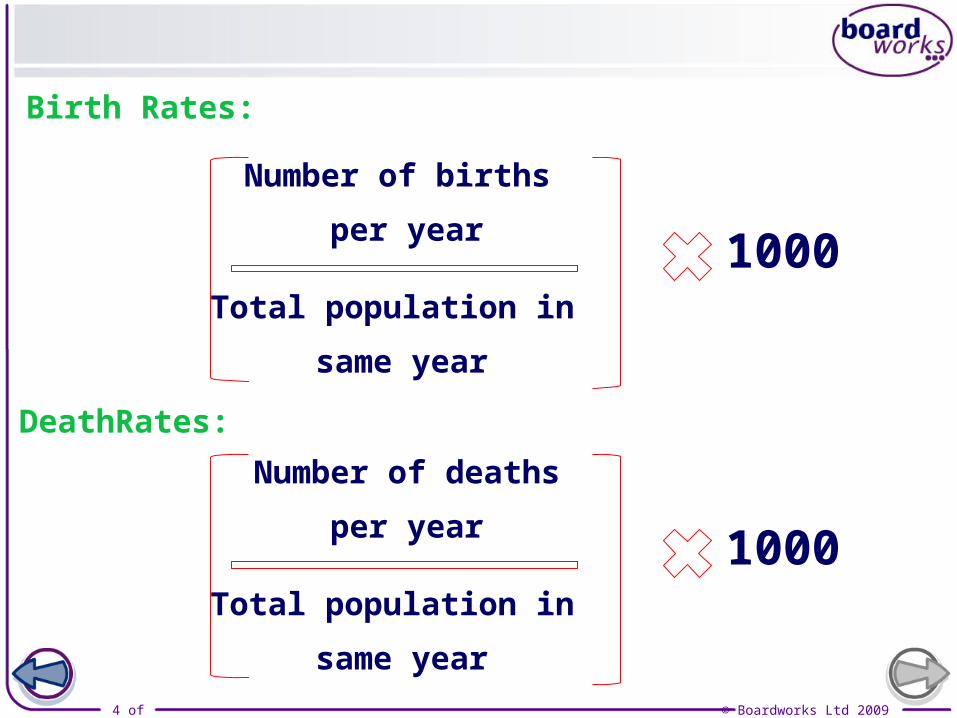
Birth Rates:
Number of births
per year
Total population in
same year
1000
DeathRates:
Number of deaths
per year
Total population in
same year
1000

5 of 37 © Boardworks Ltd 2009
Population Growth
Population growth is determined by:
births immigration deaths emigration
% Population Growth Rate (In a Given Period of Time):
Population change
during time period
Population at start
of period
100

6 of 37 © Boardworks Ltd 2009
LocationPopulation at start of
period
Number of Births
Number of Deaths
Number of immigrants
Number of
emigrants
Birth rate per year
Death rate per
year
Population change
during time period
% population growth rate
Gondor 31504 5232 3248 156 278
Narnia 5987456.0 100025 570000 2001 5123
Oz 3000005 95123 94123 5 7
Loompa Land 53 5 1 2 0
King's Landing 5000003 4000 900004 2544 500
Which location’s populations are decreasing?

7 of 37 © Boardworks Ltd 2009
LocationPopulation at start of
period
Number of Births
Number of Deaths
Number of immigrants
Number of
emigrants
Birth rate per year
Death rate per
year
Population change
during time period
% population growth rate
Gondor 31504 5232 3248 156 278
Narnia 5987456.0 100025 570000 2001 5123
Oz 3000005 95123 94123 5 7
Loompa Land 53 5 1 2 0
King's Landing 5000003 4000 900004 2544 500
Which location’s populations are decreasing?
King’s Landing, Gondor and Oz
116 177 -6138 -4.6742 25 2899 4.8473 76 -11 -0.365
163 26 23 15.0198 400 -10373055 -20.7

8 of 37 © Boardworks Ltd 2009
116 177 -6138 -4.6742 25 2899 4.8473 76 -11 -0.365
163 26 23 15.0198 400 -10373055 -20.7

9 of 37 © Boardworks Ltd 2009
• Complete the following questions in your pack:
• 2 a, b, c• 3 a and b

Population PyramidsWhat’s
occurring?

11 of 37 © Boardworks Ltd 2009
Population pyramids

12 of 37 © Boardworks Ltd 2009
• For each of the population pyramids on your sheet, comment on whether the birth rate, death rate and life expectancy is low or high. Then compare this to the demographic transition curve you drew yesterday, to decide which stage of the transition each country is in.
• Once you have finished, there is a second sheet to work through, that must be completed.

13 of 37 © Boardworks Ltd 2009

Homework: Define the following Key Words
• Population• Growth curve• Survival curve• Life expectancy• Age population pyramid• Population growth rate• Demographic transition• Birth rate• Death rate• Immigration rate• Emigration rate

Spec Check!
Have you got notes for all of the lessons we have done so far?

BBC 7 Billion and You – What’s Your Number?
http://www.bbc.co.uk/news/world-15391515
• What number person were you on earth?• What is the current UK population?• How many people have been born since the
start of last lesson?