1 measuring health care quality at the international level: challenges and preliminary results from...
TRANSCRIPT

1
Measuring health care quality at the international level:
Challenges and preliminary results from the OECD Health Care Quality Indicators Project
Ed Kelley
Head, OECD Health Care Quality Indicators Project
European Health Forum Gastein
Gastein, Austria – October 6, 2005

2
Presentation outline
Why compare quality internationally? The HCQI Project Promise and practicalities in the use of
international quality data Using the data

3
Why compare quality internationally?
4
National and international use of health care data
To assess amount and appropriateness of services provided
To investigate volume-outcome relationships To compare quality of care
5
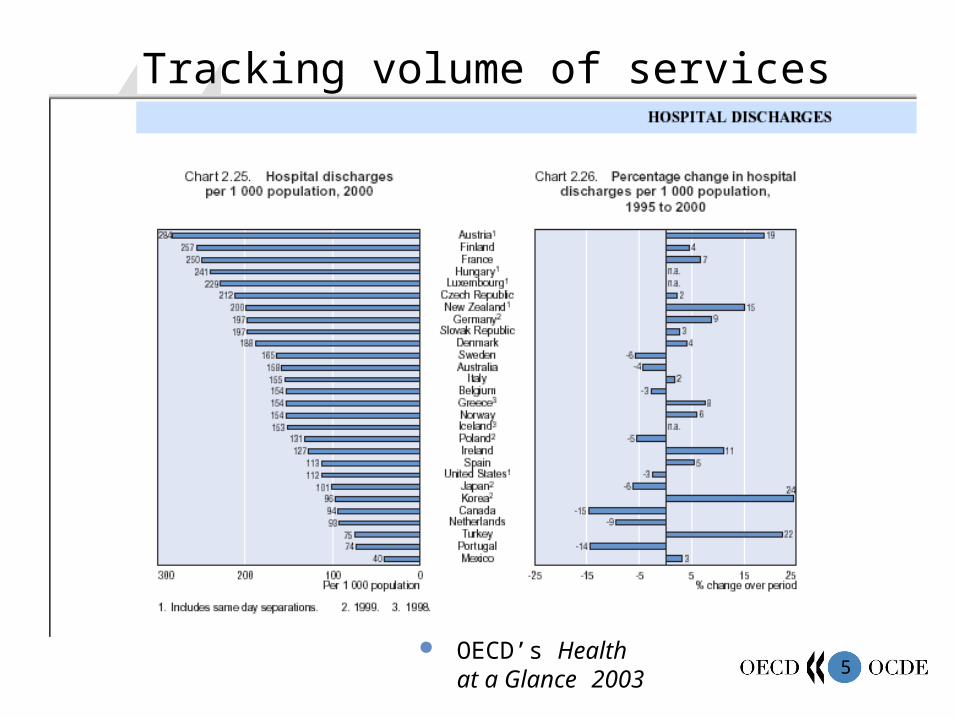
Tracking volume of services
OECD’s Health at a Glance 2003

6
Assessing volume-outcome relationships
Canadian Institute for Health Information, Health Care Canada, 2005
7
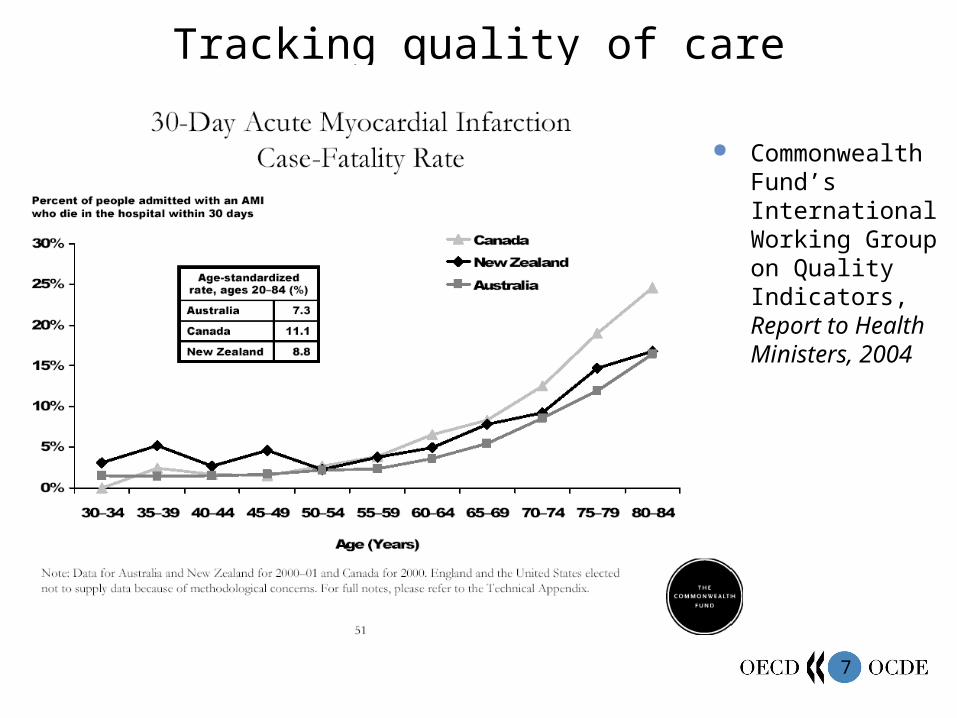
Tracking quality of care
Commonwealth Fund’s International Working Group on Quality Indicators, Report to Health Ministers, 2004
8
The Health Care Quality Indicators Project

9
Broad aims of the OECD’s HCQI Project
To develop a set of key indicators of the quality of health care for strategic international comparisons
Initial attention to indicators of the technical quality of health care (i.e. effectiveness)
Considering “Responsiveness/patient centeredness” in Phase 2
To be population-based, representative of the main disease and risk groups
10
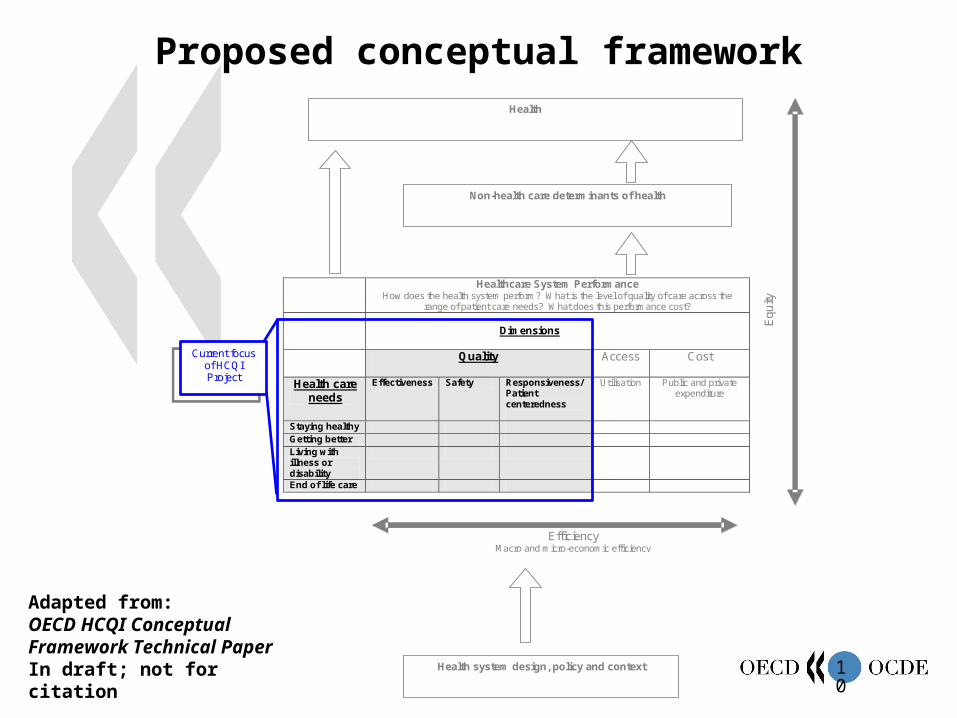
Adapted from:OECD HCQI Conceptual Framework Technical Paper In draft; not for citation
Proposed conceptual framework
Healthcare System Performance How does the health system perform? What is the level of quality of care across the
range of patient care needs? What does this performance cost?
Dimensions
Quality
Access Cost
Health care needs
Effectiveness Safety Responsiveness/ Patient centeredness
Utilisation Public and private expenditure
Staying healthy Getting better Living with illness or disability
End of life care
Equ
ity
Current focus of HCQI Project
Non-health care determinants of health
Health
Efficiency Macro and micro-economic efficiency
Health system design, policy and context
11
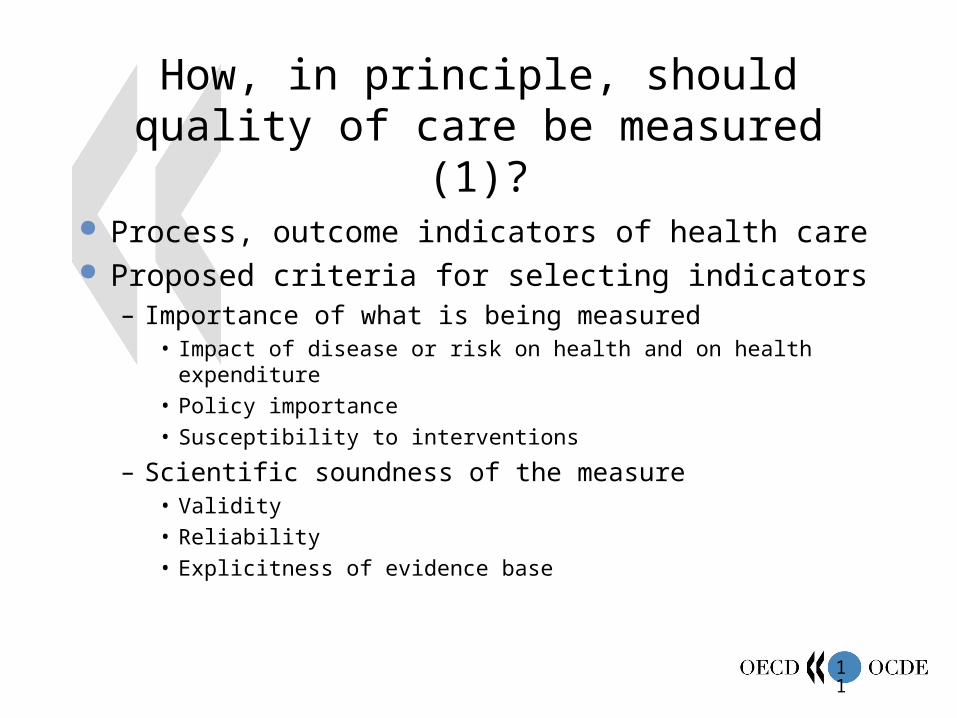
How, in principle, should quality of care be measured (1)?
Process, outcome indicators of health care Proposed criteria for selecting indicators
– Importance of what is being measured• Impact of disease or risk on health and on health
expenditure
• Policy importance
• Susceptibility to interventions
– Scientific soundness of the measure• Validity
• Reliability
• Explicitness of evidence base

12
How, in principle, should quality of care be measured (2)?
Proposed criteria for selecting indicators (continued)– Feasibility of obtaining internationally comparable
data• Existence of prototypes• Availability of data• Cost of measurement/collection

13
HQCI Work To-Date
OECD HCQI Conceptual Framework Technical Paper (8/05 draft)
OECD HCQI Initial Indicator Technical Paper (9/05 draft)
Expert panels convened to recommend indicators for 5 priority areas
These reports have been released as Health Technical Papers (Numbers 14-18) [www.oecd.org/health]

14
HCQI Work to DatePhase 1
Phase 2Analysis of available
measures, e.g.:
The Nordic Group
The Nordic Group
Conceptual work, Indicator review
Coping with the end of life
Living with illness and disability
Getting better
Staying healthy Stages of disease
EffectivenessSafety
Concepts of technical quality of healthcare
Coping with the end of life
Living with illness and disability
Getting better
Staying healthy Stages of disease
EffectivenessSafety
Concepts of technical quality of healthcare
Full report on broader measure set
15
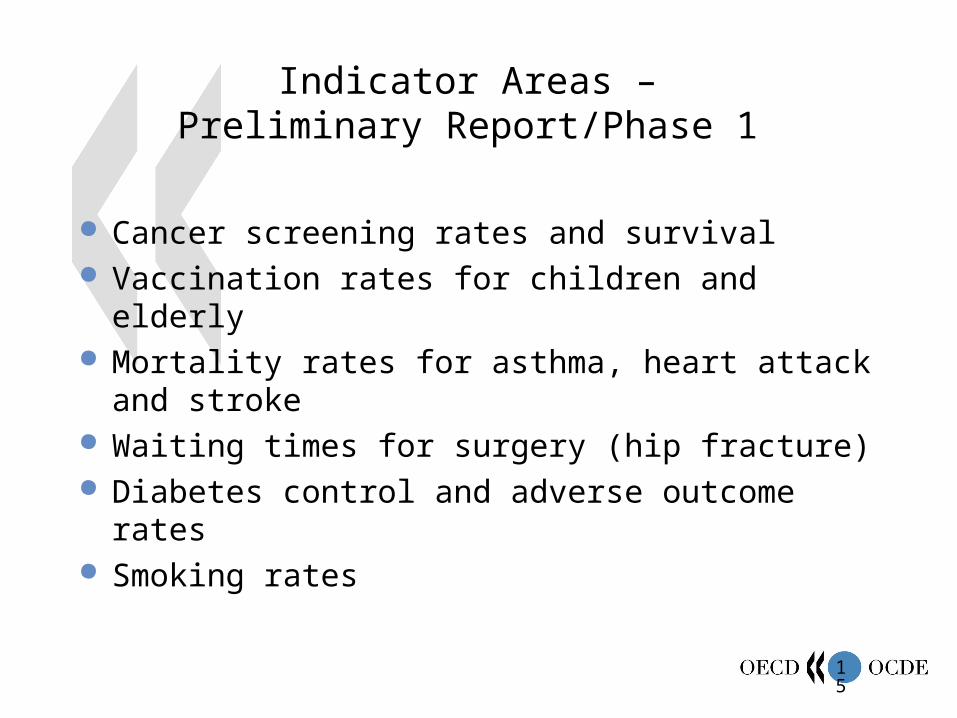
Indicator Areas – Preliminary Report/Phase 1
Cancer screening rates and survival Vaccination rates for children and elderly Mortality rates for asthma, heart attack and
stroke Waiting times for surgery (hip fracture) Diabetes control and adverse outcome rates Smoking rates
16
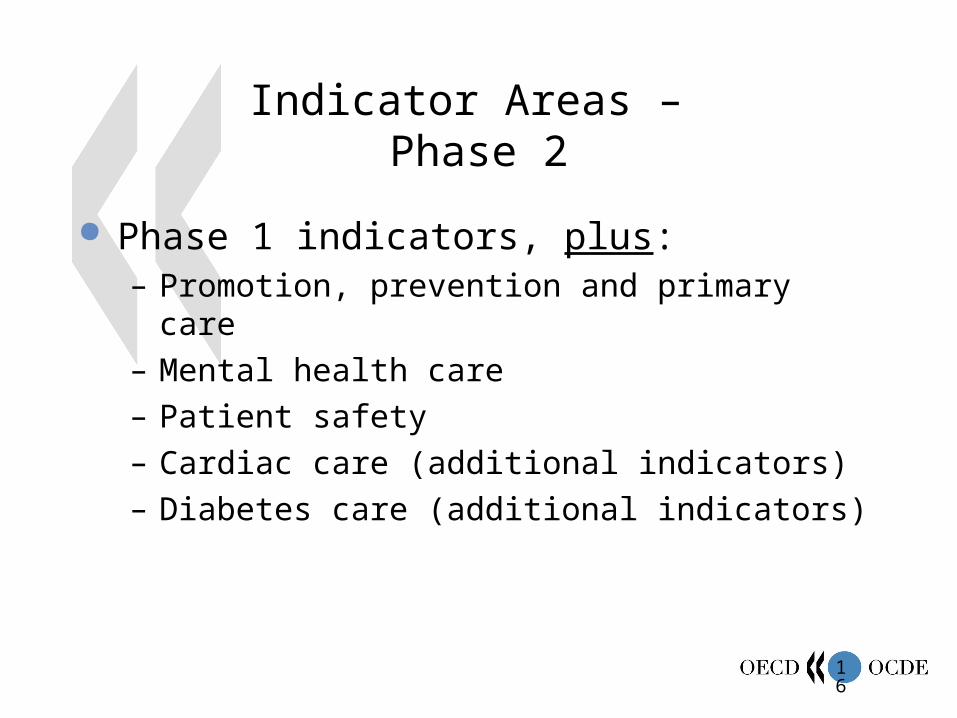
Indicator Areas – Phase 2
Phase 1 indicators, plus:– Promotion, prevention and primary care– Mental health care– Patient safety– Cardiac care (additional indicators)– Diabetes care (additional indicators)
17
Promise and practicalities in use of international quality data
18
Operational issues
Data availability
Indicator sensitivity and specificity

19
Data availability for HCQI Initial Report
SECTION ONE 1a 1b 2 3a 3b 4 5a 5b 6 7 8 9 10 11 12 13a 13b 14 15 16 17
Country/Indicator
Bre
ast
Can
cer
(obs
)
Bre
ast
Can
cer
(rel
)
Mam
mog
raph
y
Cer
vica
l Can
cer
(obs
)
Cer
vica
l Can
cer
(rel
)
Cer
vica
l Scr
een
Col
orec
tal C
ance
r (o
bs)
Col
orec
tal
Can
cer(
rel)
Inci
denc
e V
acci
ns
(p-m
-h)
Chi
ldho
od
Vac
cina
tion
Ast
hma
Mor
talit
y
AM
I
H S
trok
e
I S
trok
e
Wai
ting
times
fe
mur
Dia
bete
s (t
est
for
HbA
1c)
Dia
bete
s (p
oor
gluc
ose
cont
rol)
Ret
inal
Exa
ms
Maj
or
Am
puta
tions
Influ
enza
vac
cins
65
+
Sm
okin
g ra
tes
AustraliaAustriaCanadaCzech RepublicDenmarkFinlandFranceGermanyIcelandIrelandItalyJapanMexicoNetherlandsNew ZealandNorwayPortugalSlovak RepublicSpainSwedenSwitzerlandUnited KingdomUnited States

20
Data comparability – Frequently an issue
Minor issues: age ranges, time periods– Can be dealt with by appropriate footnotes
Major issues that can be addressed: Age standardization, inclusion criteria
Major issues that cannot be addressed in the short run: data sources, patient vs episode-based calculation, sampling

21
Data comparability
OECD’s HCQI Expert Group asked for data comparability analyses on: – Reference Population for Age Adjustment– Handling Missing Data– Notification on Cases of Vaccine-Preventable
Disease– Variation in Coding Practices– Effect of Unique Identifiers
22
Using the indicators
What do the indicators tell us about comparative performance ?
Why is comparative quality data relevant?– Monitoring change over time – Examining impact of specific policies– Benchmarking best practices

23
Comparing quality: Variation in performance across indicators
Selected HCQI Indicators: Flu vaccination (adults 65+, 2001-04) and Smoking rates (1999-2003)
78% 77%
71% 70% 69%
62% 62% 60%56% 56% 55%
46% 46% 44%
20%
34%
26%
18%
25%
15%
25% 24%
32%
24%27%
30%
22%
30% 29%30%26%28%
0%
10%
20%
30%
40%
50%
60%
70%
80%
90%
Austra
lia
Nethe
rland
s
United
King
dom
United
Sta
tes
Franc
e
Canad
a
New Z
ealan
dIta
ly
Spain
Germ
any
Switzer
land
Japa
n
Finlan
d
Norway
Denm
ark
Mex
ico
Per
cen
tag
e
Influenza vaccination rates, 65+ Smoking rates

24
Do countries perform well across types of indicators?Breast and Cervical cancer screening rates, Selected OECD countries 2001-04
98.0%
87.7%
79.0%
74.9%
70.6%
29.0%
70.3% 71.8%
67.0%70.3%
74.0%
45.1%
0.0%
10.0%
20.0%
30.0%
40.0%
50.0%
60.0%
70.0%
80.0%
90.0%
100.0%
1 2 3 4 5 7
Countries
Pe
rce
nt
Mammography screening rate
Cervical cancer screening rate

25
Using quality indicators - Monitoring change over time
Monitoring infant mortality rate declines over the long term
OECD’s Health at a Glance
26
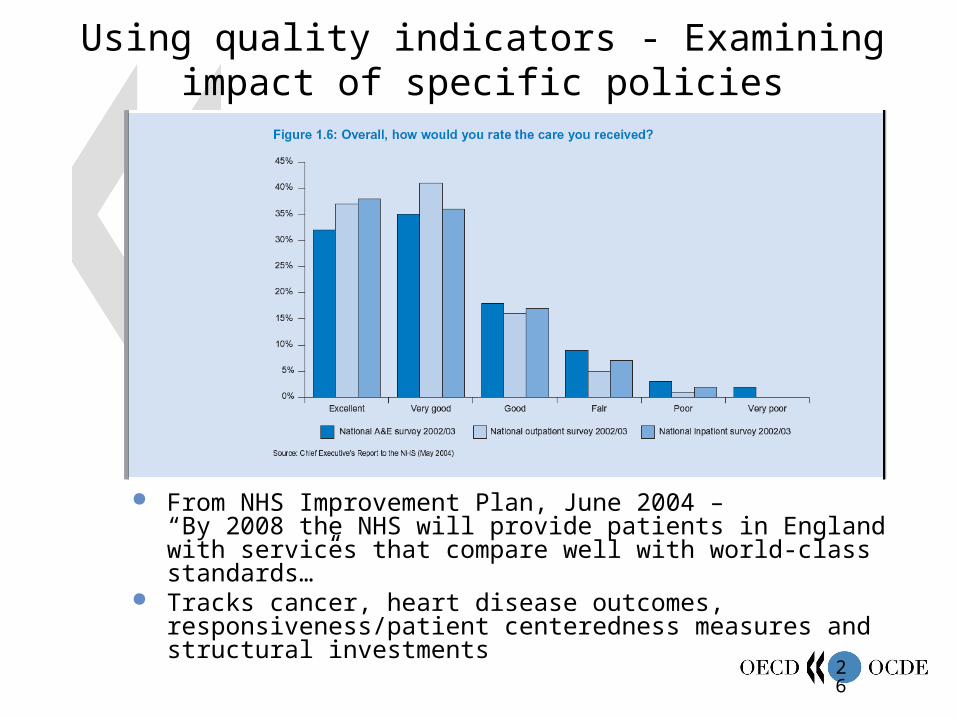
Using quality indicators - Examining impact of specific policies
From NHS Improvement Plan, June 2004 – “By 2008 the NHS will provide patients in England with services that compare well with world-class standards…”
Tracks cancer, heart disease outcomes, responsiveness/patient centeredness measures and structural investments

27
Using quality indicators - Benchmarking best practices
Comparison across performance groupings (top quintile, top decile, top performer/best in class)
Learning from examples of excellence
National example – US National Healthcare Quality Report

28
Contact Information
Ed Kelley, [email protected]+33-1-45-24-92-39 (phone) +33-1-45-24-90-98 (fax)