1 maryland health services cost review commission new all-payer model for maryland population-based...
TRANSCRIPT

1
Maryland Health Services Cost Review Commission
New All-Payer Model for MarylandPopulation-Based and Patient-Centered
Payment SystemsMay 2014

2
Outline of Presentation Introductions Overview of New Maryland All-Payer Model Opportunities for Success Implementation Approach Questions

Overview of New All-Payer Model

4
Approved New All-Payer Model Maryland is implementing a new All-Payer
Model for hospital payment Updated application submitted to Center for
Medicare and Medicaid Innovation in October 2013 Approved effective January 1, 2014
Focus on new approaches to rate regulation Moves Maryland
From Medicare, inpatient, per admission test To an all payer, total hospital payment per
capita test Shifts focus to population health and delivery
system redesign
5
Approved Model Timeline Phase 1 - 5 Year Hospital Model
Maryland all-payer hospital model Developing in alignment with the broader health care
system
Phase 2 – Total Cost of Care Model Phase 1 efforts will come together in a Phase 2 proposal To be submitted in Phase 1, End of Year 3 Implementation beyond Year 5 will further advance the
three-part aim

6
Approved Model at a Glance
All-Payer total hospital per capita revenue growth ceiling for Maryland residents tied to long term state economic growth (GSP) per capita 3.58% annual growth rate for first 3 years
Medicare payment savings for Maryland beneficiaries compared to dynamic national trend. Minimum of $330 million in savings
Patient and population centered-measures and targets to promote population health improvement Medicare readmission reductions to national average 30% reduction in preventable conditions under Maryland’s
Hospital Acquired Condition program (MHAC) over a 5 year period
Many other quality improvement targets

7
Creates New Context for HSCRC
Align payment with new ways of organizing and providing care
Contain growth in total cost of hospital care in line with requirements
Evolve value payments around efficiency, health and outcomes
Focus is on patients and quality of care
Better care
Better health
Lower cost

Focus Shifts from Rates to Revenues
Old ModelVolume Driven
New ModelPopulation and Value
Driven
Revenue Base Year
Updates for Trend,
Population, ValueAllowed
Revenue Target Year
Known at the beginning of year.
More units does not create more revenue
Rate Per Unit or Case
Units/Cases
Hospital Revenue
Unknown at the beginning of year. More
units/more revenue

9
Challenge for Integration of Efforts
Medical Homes Accountable Care
Organizations
Health Enterprise Zones (HEZ)
Enrollment Expansion-Medicaid-Private
Health Information Exchange--CRISP
State Health Improvement Process-Public
Health

10
Timeline of All-Payer Model Development
Hospital global model
Population-based
Preparation for Phase 2 focus on total costs of care model
Near Term (2014)
Mid-Term (2015-2017)
Long Term
(2016-Beyond)
Phase 1 (5 Year Model)

Opportunities for Success Under the New All-Payer Model

12
History Provides Example
U. S. Population
Occupied beds
1980 2010 %
CHG
227M 309 M +36%
755,000 473,000 -37%
DRGs and New Technology Reduced Length of Stay and Admissions and Freed Up $$$ for Major Improvements in Cardiac Care, Minimally Invasive Procedures, Advanced Imaging, New Medications and Other Care

13
New Model represents most significant change in nearly 40 years
Focus shifts to gain control of the revenue budget and focus on gaining the right volumes and reducing avoidable utilization resulting from care improvement
Potential for excess capacity will demand focus on cost control and opportunities to optimize capacity
Opens up new avenues for innovation Increased efficiency creates opportunities for
improved care and better population health
What Does This Mean?

14
Opportunities for Success
Mod
el O
pp
ort
un
itie
s
• Global revenue budgets providing stable model for transition and reinvestment
• Lower use—reduce avoidable utilization with effective care management and quality improvement
• Focus on reducing Medicare cost
• Integrate population health approaches
• Control total cost of care
• Rethink the business model/capacity and innovate
Deliv
ery
Syst
em
O
bje
ctiv
es • Improved
care and value for patients
• Sustainable delivery system for efficient and effective hospitals
• Alignment with physician delivery and payment model changes

15
Near Term Revenue Models
Global Budget Revenues (GBR,
TPR)
• Inflation Adjustment
• Demographic Shift Driven Volume
Non-GBR Revenues
• Inflation Adjustment
• Volume Governor• 50% variable cost
factor• Quality-based adjustments• Other statewide policy adjustments
16
Examples:30- Day Readmissions/Rehospitalizations Preventable Admissions (based on AHRQ
Prevention Quality Indicators)Nursing home residents—Reduce conditions
leading to admissions and readmissionsMaryland Hospital Acquired Conditions
(potentially preventable complications) Improved care coordination: particular
focus on high needs/frequent users, involvement of social services
Reduce Avoidable Utilization By Improving Care
17
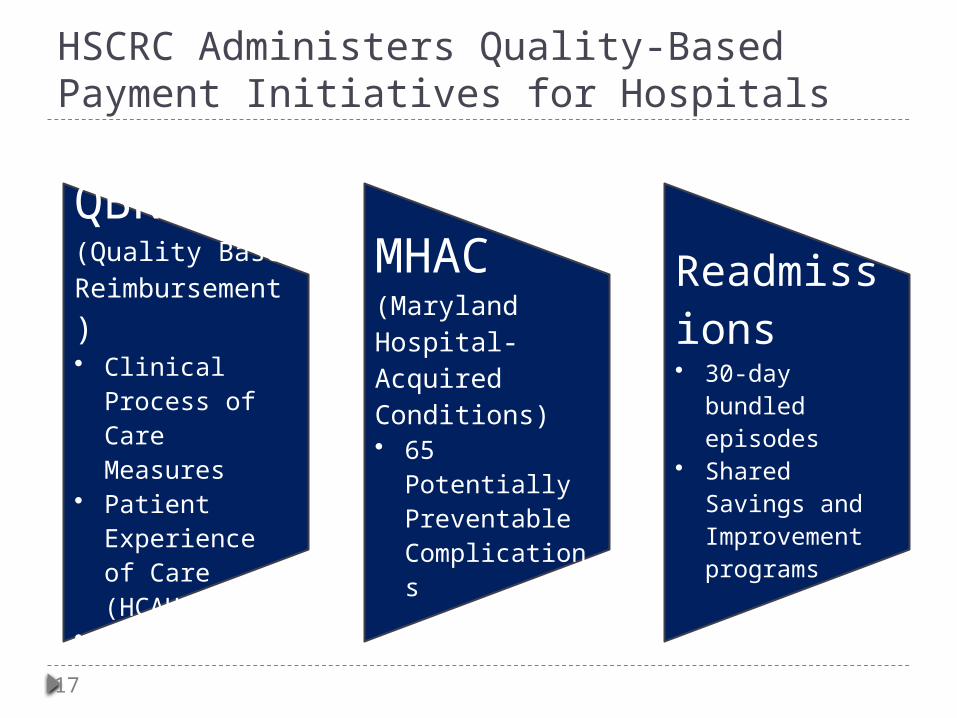
HSCRC Administers Quality-Based Payment Initiatives for Hospitals
QBR (Quality Based Reimbursement)• Clinical
Process of Care Measures
• Patient Experience of Care (HCAHPS)
• Mortality
MHAC (Maryland Hospital-Acquired Conditions)• 65 Potentially
Preventable Complications
Readmissions• 30-day bundled
episodes• Shared Savings
and Improvement programs

18
Aligning Quality-Based Programs with the Model 30% reduction target in Hospital Acquired
Conditions (HAC) Linked the financial impact of hospital
performance to statewide progress If state improvement rate is below or equal to 8%,
maximum revenue at risk is 4% If state improvement exceeds 8%, maximum revenue at
risk is 1%
Readmission target Positive incentive for hospitals that achieve 6.8%
improvement in all cause all hospital readmission rate
19
Medicare Focus: GO FOR “0” Medicare revenue growth below national
growth critical to generate savings Medicare is the least managed population in
Maryland Focus on high need patients and avoidable
utilization In particular, where better care reduces costs Requires improved coordination and focus
among providers, patients, and families

HSCRC Implementation Approach

21
HSCRC Public Engagement Short Term Process Phases Phase 1:
Fall 2013: Advisory Council - recommendations on broad principles
January 2014- July 2014: Workgroups Four workgroups convened Focused set of tasks needed for initial policy making of
Commission Majority of recommendations needed by July 2014
Phase 2: July 2014 – July 2015 Always anticipated longer-term implementation
activities July Workgroup reports to address proposed future
work plan Advisory Council reconvening

22
HSCRC
Advisory CouncilPhysic
ian Alignment
& Engagement
Performanc
eMeasuremen
t
Payment
Models
Data & Infrastructure
Stakeholder input
Workgroups
•Open meetings•Physicians, patients, andother providers, hospitals, payers participate
http://www.hscrc.state.md.us/

23
Advisory Council Advisory Council was charged with offering
guidance and advice on implementing Maryland’s newly approved model design
Best ways to meet the tight targets in model Setting priorities for implementation Establishing guiding principles Advice based on real-world experience

24
Advisory Council Recommendations 1. Focus on Meeting the Early Model Requirements
Focus on All-payer and Medicare tests Start with Global Budgets Reduce avoidable utilization
2. Meeting Budget Targets, Investments in Infrastructure, and Providing Flexibility for Private Sector Innovation
3. HSCRC as a Regulator, Catalyst, and Advocate 4. Consumer Involvement in Planning and
Implementation 5. Physician and Other Provider Alignment 6. Transparency and the Public Engagement Process

25
Public Engagement Process – Work Groups Engaged broad set of stakeholders in HSCRC
policy making and implementation of new model 4 workgroups and 6 subgroups 85 workgroup appointees Consumers, Employers, Providers, Payers, Hospitals
Established processes for transparency and openness Diverse membership Educational phase of process Call for Technical White Paper Shared Publically Access to information Opportunity for comment

26
HSCRC Work Group Descriptions
Alignment with Emerging Physician Models
Shared Savings Care Improvement
Care Coordination Opportunities
Post-Acute and Long-Term Care
Evidence-Based Care
Mid-Term (FY 2015-
017)
Reducing Potentially Avoidable Utilization to achieve Three-Part Aim
Statewide Targets & Hospital Performance Measurement
Measuring Potentially Avoidable Utilization
Value-Based Payments (integration of cost, quality, population health and outcomes)
Patient Experience and Patient-Centered Outcomes
Physician Alignment & Engagement
Performance Improvement
& Measurement
Note: More Detailed Work Group Descriptions reviewed by Commission January 13, 2014 and available on HSCRC website

27
HSCRC Work Group Descriptions
Mid-Term (FY 2015-
017)Data and
Infrastructure
Data Requirements Care Coordination Data and
Infrastructure Technical and Staff
Infrastructure Data Sharing Strategy
Note: More Detailed Work Group Descriptions reviewed by Commission January 13, 2014 and available on HSCRC website
Balanced Update Guardrails for Model
Performance Market Share Initial and Future Models
Payment Models

28
Workgroup Products (as of 5/12/14) Payment Model
Draft UCC Policy Recommendations Draft Update Factors Recommendation for FY 2015 Draft Readmission Shared Savings Recommendation for FY 2015 Final Report – Balanced Update and Short-Term Adjustments
Performance Measurement Final Recommendations– Maryland Hospital Acquired Conditions Final Recommendations – Readmissions First Draft – Efficiency Report
Data and Infrastructure Final Report - Data Requirements for Monitoring All-Payer Model
Physician Alignment and Engagement First Draft - Current Physician Payment Models and Recommendations for
Physician Alignment Strategies under the All-Payer Model