1 long term 2 enhanced surface water treatment rule – lt2 mark mcintire drinking water program...
TRANSCRIPT

1
Long Term 2 Enhanced Surface Water Treatment Rule – LT2
Mark McIntire
Drinking Water Program
SDWWA Water Seminar
February 7, 2006
Please ask questions as we go along

2
Surface Water Treatment Rule Review
Source for many large systems in SD.
Especially vulnerable to microbial contamination
Crypto, E. coli, and Giardia lamblia present in most surface waters

3
Disinfection & FiltrationDisinfection
Essential part of water treatment
Creates DBPs Crypto resists traditional
disinfectants
Filtration Most surface water systems filter Key barrier against microbial
contamination Physical process can remove Crypto Disinfection still necessary

4
Understanding “log” removal Refers to percent of Crypto that is removed or
inactivated by treatment or other measures
Log % removal/inactivation
0.5-log 68.4%
1-log 90%
2-log 99%
3-log 99.9%
4-log 99.99%
5-log 99.999%

5
“Log” Removal Example 1System B
Both systems provide the same level of Crypto removal/inactivation, but System B provides higher quality finished
water
So
urc
e
Wa
ter
Cry
pto
R
edu
ctio
nF
inis
hed
W
ater 1 Crypto oocyst
2-log removal/ inactivation (99%)
1 Crypto oocyst
System A
100,000 Crypto oocysts 100 Crypto oocysts
2-log removal/ inactivation (99%)
1,000 Crypto oocysts

6
“Log” Removal Example 2
5-log removal/ inactivation (99.999%)
System B
Both systems provide the same public health protection, but System A must work harder!
So
urc
e
Wa
ter
Cry
pto
R
edu
ctio
nF
inis
hed
W
ater 1 Crypto oocyst
2-log removal/ inactivation (99%)
1 Crypto oocyst
System A
100,000 Crypto oocysts 100 Crypto oocysts

7
“Log” Removal Example 3System B
System A and B have the same source water Crypto level but System A provides a greater level of removal/inactivation, resulting
in higher quality finished water!
So
urc
e
Wa
ter
Cry
pto
R
edu
ctio
nF
inis
hed
W
ater
10 Crypto oocysts
2-log removal/ inactivation (99%)
1 Crypto oocyst
System A
1,000 Crypto oocysts 1,000 Crypto oocysts
3-log removal/ inactivation (99.9%)
1 Crypto oocyst

8
M-DBP History LT2ESWTR (2006)
Improves microbial protectionBuilds on SWTR, IESWTR, & LT1ESWTRDoes not change any existing requirements
from SWTR suiteFlexible, risk-based rule based on new Crypto
data The amount of Crypto detected in the source water
determines the additional levels of required treatment

9
SWTRs Summary• All Subpart H systems
• Reduce risks from Giardia lamblia & viruses
SWTR (1989)
• Subpart H systems serving > 10,000• Address Crypto with improved treatment
IESWTR (1998)
• Requirements similar to IESWTR applied to Subpart H systems serving < 10,000
LT1ESWTR (2002)
• All Subpart H systems• Target additional treatment at highest-risk
systems
LT2ESWTR (2005)
Questions? NEXT

10
Purposes of the LT2ESWTR Improve public health protection
Reduce illness caused by Crypto and other microorganisms
Tailor requirements based on: Level of treatment Source water quality System size
Provide systems and states with flexibility
Most systems will only need to monitor

11
Applicability All Subpart H systems
Use surface water or GWUDI sourcesCWSs, NTNCWSs, TNCWSsWholesale systems
Compliance deadlines and options based on number of people servedDivided into four schedulesWholesale systems with own Subpart H
source(s) comply based on population of largest system in their CDS

12
SchedulesIf you have a Subpart H source and are this kind of system:
You are on
Schedule number:
System serving 100,000 or more people OR a wholesale system in a CDS that contains a system serving >100,000
1
System serving 50,000 to 99,999 people OR a wholesale system in a CDS that contains a system serving 50,000 to 99,999
2
System serving 10,000 to 49,999 people OR a wholesale system in a CDS that contains a system serving 10,000 to 49,999
3
System serving fewer than 10,000 and not a wholesale system
4

13
LT2ESWTR Process
Initial Round Source Water Monitoring
Bin Classification
Choose Toolbox Option(s)
Implement Tool(s)
Second Round Source Water Monitoring
Bin 1 systems
Small systems w/ low E. coli
2
1
3
4
5
Systems installing
max treatment
Systems Subject to LT20

14
Requirements based on: System size Wholesale status Source water Operating calendar
Initial round Start date based on system size For wholesale systems, based on largest
system in CDS Grandfathering is permitted
Source Water Monitoring1

15
Filtered PWSs are classified into one of four binsBased on initial monitoring results
May set additional requirementsBin 1: no additional treatmentBins 2, 3, 4: additional treatment or control
processes Covered in future trainings
Bin & Treatment Overview2

16
Range of treatment and control process options to meet bin requirements: Source protection and management Prefiltration Treatment performance Additional filtration Inactivation*
Offer Crypto treatment credits Options discussed in depth at future trainings
* Unfiltered systems are limited to these tools
Toolbox Options3

17
Implement Option(s) Install chosen treatment to meet bin
requirements: Schedule 1 – April 1, 2012 Schedule 2 – October 1, 2012 Schedule 3 – October 1, 2013 Schedule 4 – October 1, 2014
State can allow up to 2 additional years Covered in future trainings
4

18
Subsequent source water monitoring6 years after initial bin classification (filtered
systems)Same requirements apply
Can lead to bin reclassification Covered in future trainings
Follow-Up Monitoring5
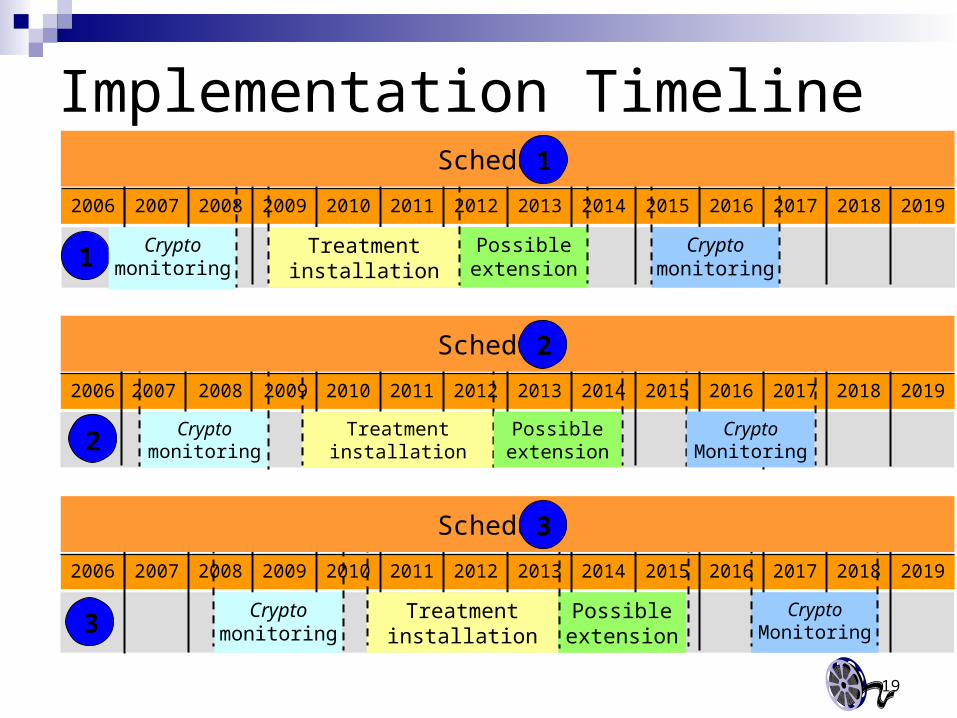
19
Implementation Timeline
1
201820172016 20192015201420132012201120102009200820072006
Treatment installation
Possible extension
Crypto monitoring
Crypto monitoring
Schedule 1
2
201820172016 20192015201420132012201120102009200820072006
Crypto monitoring
Treatment installation
Crypto Monitoring
Possible extension
Schedule 2
201820172016 20192015201420132012201120102009200820072006
Treatment installation
Crypto monitoring
Possible extension
Crypto Monitoring3
Schedule 3

20
201820172016 201920152014201320122011201020092008
Implementation Timeline
201820172016 201920152014201320122011201020092008
4 Crypto
CryptoMonitoring
Treatment installation
Possible extension
E. coli
E. coli
4 E. coli
E. coli
Crypto
Treatment installation
Crypto
E. coli4 Possible extension
E. coli
Schedule 4

21
Profiling and Benchmarking
Balance risks between microbial pathogens and DBPs
Impact of Stage 2 DBPR and Crypto requirements
Required when altering disinfection Develop profile for Giardia lamblia and
viruses Calculate benchmark
Requirements go into effect upon completion of initial monitoring

22
Source Water Sampling
Source Water Monitoring For systems using surface water and serving 10,000
people or more Must monitor for Crypto, E. Coli and turbidity once a month for
24 months Seasonal systems must collect at least 6 samples evenly spaced
through months of operation
Systems using surface water and serving less than 10,000 people (Schedule 4 system) must monitor for E. coli once every 2 weeks for 12 months,
However (next slide)

23
Source Water Sampling (cont.)
Systems less than 10,000 people using lake or reservoir sources If the annual mean E. coli concentration is greater than
10 E. coli per 100 mL, the system must collect 24 Crypto samples in either one or two years
Systems less than 10,000 people using flowing stream sources If the annual mean E. coli concentration is greater than
50 E. coli per 100 mL, the system must collect 24 Crypto samples in either one or two years

24
Source Water Sampling Schedules
System
Population
Submit Sampling Schedule &
Location
Begin
Monitoring
> 100,000 July 1, 2006 Oct. 1, 2006
50,000 to 99,999 Jan. 1, 2007 April 1, 2007
10,000 to 49,999 Jan. 1, 2008 April 1, 2008
< 10,000 July 1, 2008 Oct. 1, 2008
Systems must submit to State or CDX a sampling schedule that specifies the calendar dates when the system will collect each required sample, 3 months prior to start of sampling
Systems must collect the samples within two days before or two days after the dates indicated in their sampling schedule

25
Source Water Sampling Locations
Where do I collect my sample? Systems must submit a description of their sampling
location to the State or DCTS at the same time as the sampling schedule is required to be submitted.
Systems must collect source water samples (crypto, E. Coli and turbidity) prior to any chemical treatment.
Systems that recycle filter backwash water must collect source samples prior to the point of filter backwash addition.

26
Sampling Before Chemical Treatment & Filter Backwash Recycle
Sample point
Filter backwash recycle(if applicable)
Treatment plant
Source water
Chemicaladdition
Filter backwash recycle(if applicable)
Raw water intake
Raw water chemical building
Sample point 1
Note: Sample point 1 is BEFORE
introduction of recycle
Sample point 2

27
Approved Laboratories
Crypto and E. Coli sample analysis must be performed at EPA approved laboratories
Crypto samples must be sent to a lab from the list found on this EPA Website
http://www.epa.gov/ogwdw/disinfection/lt2/lab_aprvlabs.html E. Coli samples for this monitoring must be counts (enumeration),
not just presence/absence like routine monthly sampling Most labs in SD should be able to do this, but ask them first Also make sure that when you submit samples, the lab sheets indicate
that you want E. Coli counts not P/A
Turbidity – the system is allowed to take their own turbidity. Make sure your turbidimeter has been calibrated according to
manufacturers specifications.

28
Reporting Results Systems must report results from source water monitoring
no later than 10 days after the end of the first month following the month when the sample is collected
EPA should be contacting all systems with a letter telling you how to access the CDX system.
Systems serving at least 10,000 people must submit the results electronically through EPA’s CDX system. Hopefully the labs will be able to submit the results for you. Make sure you fill out the lab sheets completely.
Systems serving less than 10,000 will be allowed to submit their source water data directly to the state. However, if the system registers in the CDX system, they may be able to get the labs to submit their results for them.

29
Reporting Results (cont.)
What am I required to report?
For Crytpo Analysis1. PWS ID#
2. Facility ID #
3. Sample Collection Date
4. Sample Type (field or matrix spike)
5. Sample Volume Filtered (L)
6. Was 100% of filtered volume examined (yes/no)
7. Number of oocysts counted
For E. Coli Analysis1. PWS ID#
2. Facility ID #
3. Sample Collection Date
4. Analytical method #
5. Method Type
6. Source Type
7. E. Coli/100 mL
8. Turbidity (only for systems greater than 10,000)

30
Questions????
• Drinking Water Program
773-3754• Drinking Water Program website:
• http://www.state.sd.us/denr/dw
• EPA website:• http://www.epa.gov/OGWDW/