1 lecture 5: numpy and matplotlib - marsuniversity.github.io · numpy.linalg (linear algebra)...
TRANSCRIPT
LECTURE 5: NUMPY AND MATPLOTLIB Introduction to Scientific Python, CME 193 Feb. 6, 2014 Download exercises from: web.stanford.edu/~ermartin/Teaching/CME193-Winter15
Eileen Martin
1
Some slides are from Sven Schmit’s Fall ‘14 slides
• Numpy: basic objects, methods, functions • Numpy: linear algebra • Numpy: random • Matplotlib: 2D plots • Matplotlib: 3D plots • Scipy vs Numpy • Discuss assignment 4
2
Overview
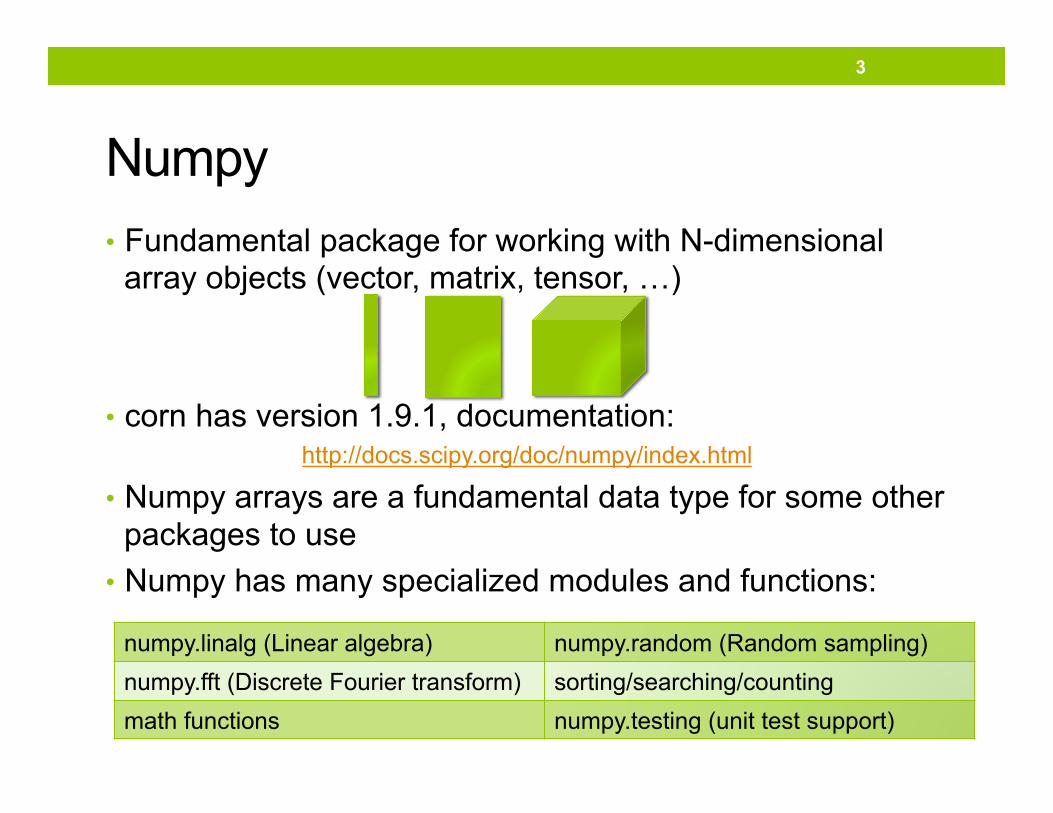
• Fundamental package for working with N-dimensional array objects (vector, matrix, tensor, …)
• corn has version 1.9.1, documentation:
http://docs.scipy.org/doc/numpy/index.html
• Numpy arrays are a fundamental data type for some other packages to use
• Numpy has many specialized modules and functions:
3
Numpy
numpy.linalg (Linear algebra) numpy.random (Random sampling) numpy.fft (Discrete Fourier transform) sorting/searching/counting math functions numpy.testing (unit test support)
4
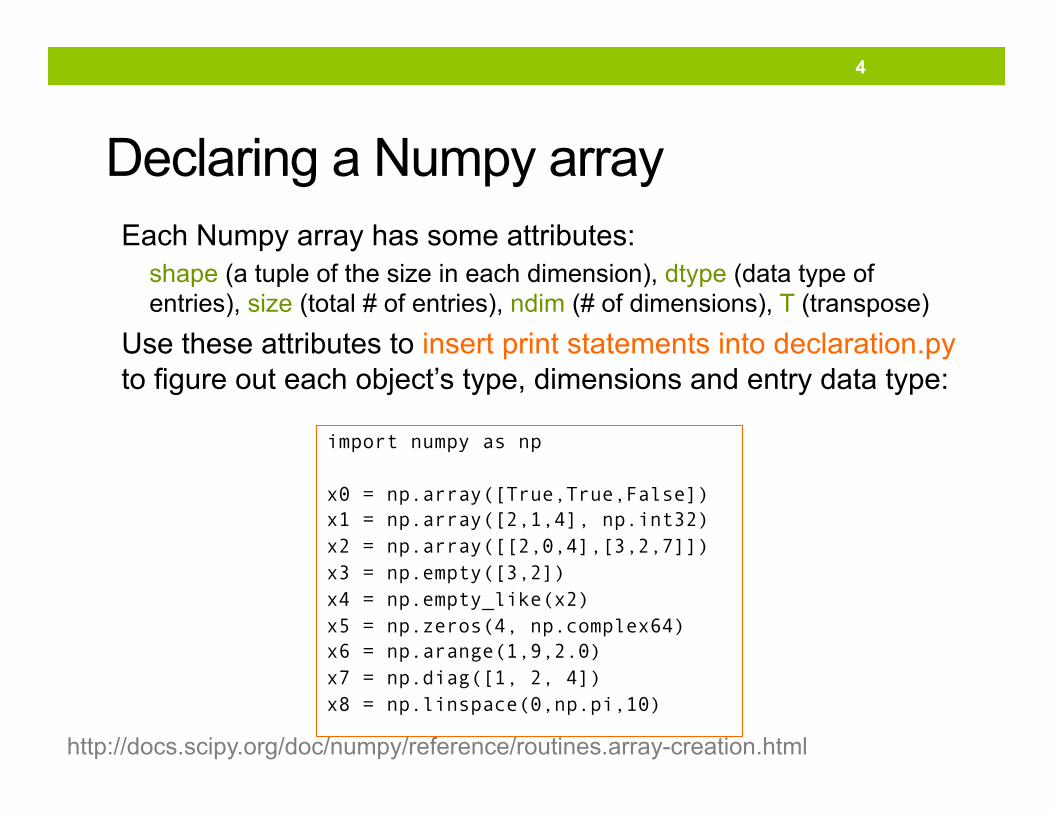
Declaring a Numpy array
import numpy as np x0 = np.array([True,True,False]) x1 = np.array([2,1,4], np.int32) x2 = np.array([[2,0,4],[3,2,7]]) x3 = np.empty([3,2]) x4 = np.empty_like(x2) x5 = np.zeros(4, np.complex64) x6 = np.arange(1,9,2.0) x7 = np.diag([1, 2, 4]) x8 = np.linspace(0,np.pi,10)
Each Numpy array has some attributes: shape (a tuple of the size in each dimension), dtype (data type of entries), size (total # of entries), ndim (# of dimensions), T (transpose)
Use these attributes to insert print statements into declaration.py to figure out each object’s type, dimensions and entry data type:
http://docs.scipy.org/doc/numpy/reference/routines.array-creation.html
5
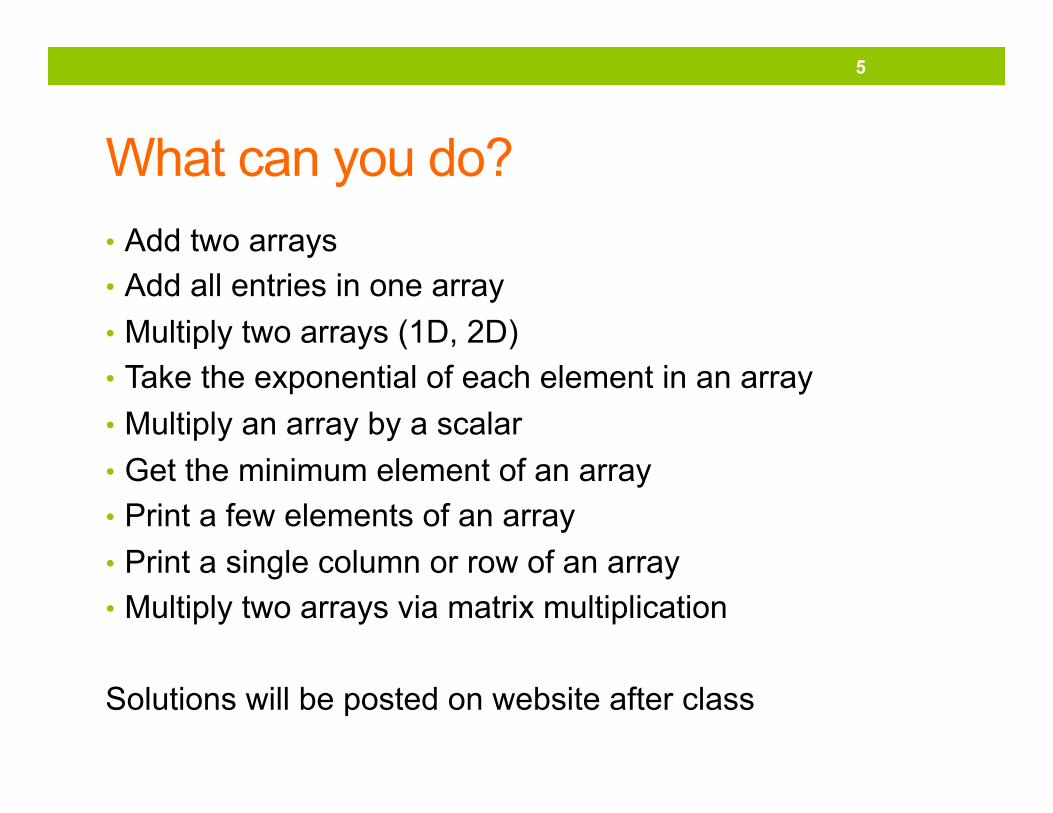
What can you do? • Add two arrays • Add all entries in one array • Multiply two arrays (1D, 2D) • Take the exponential of each element in an array • Multiply an array by a scalar • Get the minimum element of an array • Print a few elements of an array • Print a single column or row of an array • Multiply two arrays via matrix multiplication
Solutions will be posted on website after class
6
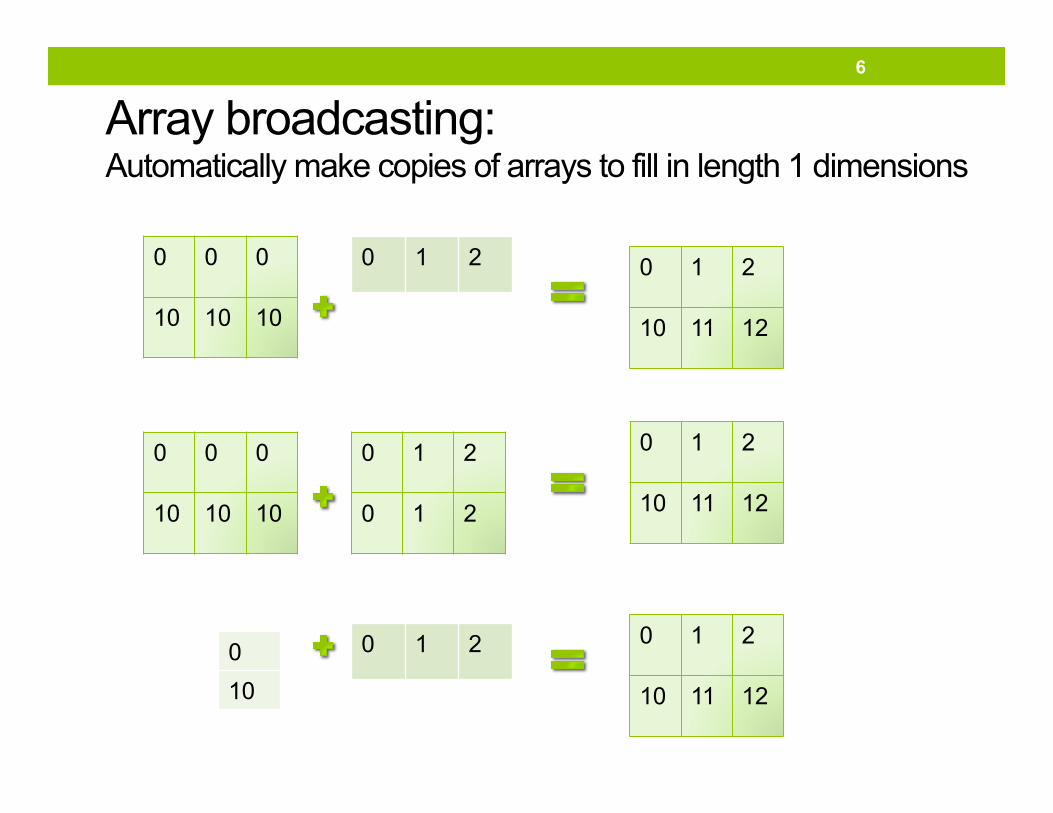
Array broadcasting: Automatically make copies of arrays to fill in length 1 dimensions
0 0 0
10 10 10
0 0 0
10 10 10
0 1 2
0 1 2
0 1 2
0 1 2
0 10
0 1 2
10 11 12
0 1 2
10 11 12
0 1 2
10 11 12
7
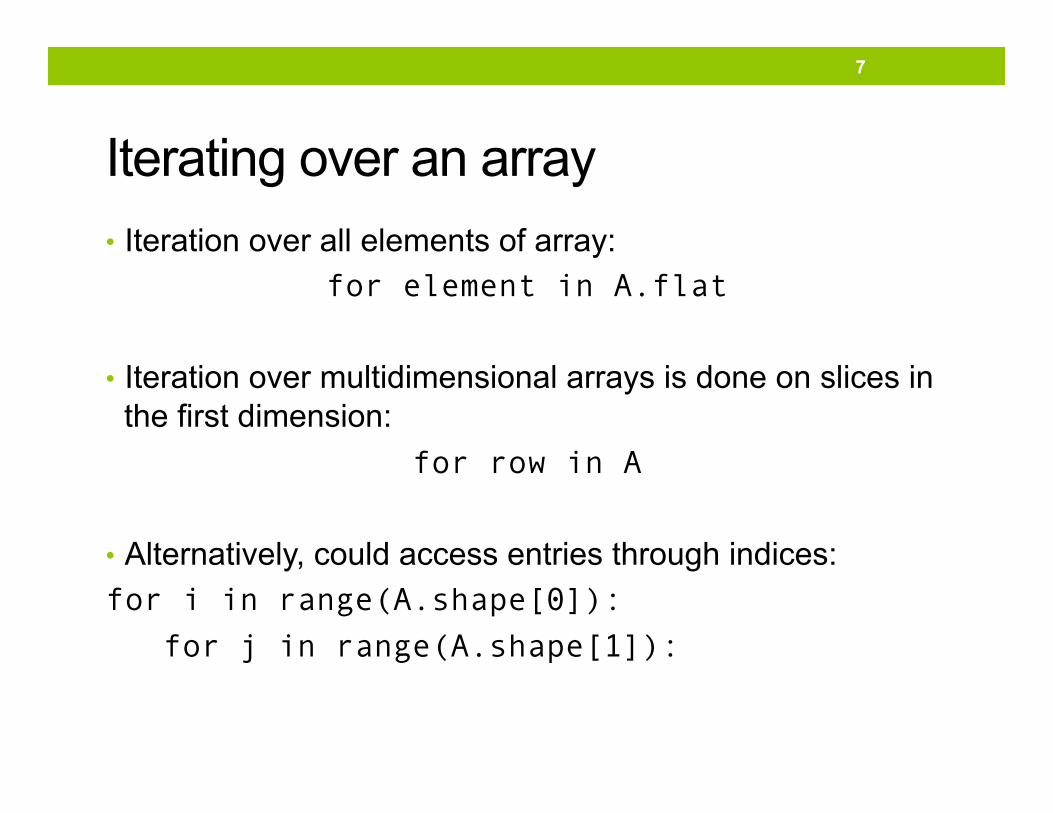
Iterating over an array • Iteration over all elements of array:
for element in A.flat
• Iteration over multidimensional arrays is done on slices in the first dimension:
for row in A
• Alternatively, could access entries through indices: for i in range(A.shape[0]): for j in range(A.shape[1]):
8
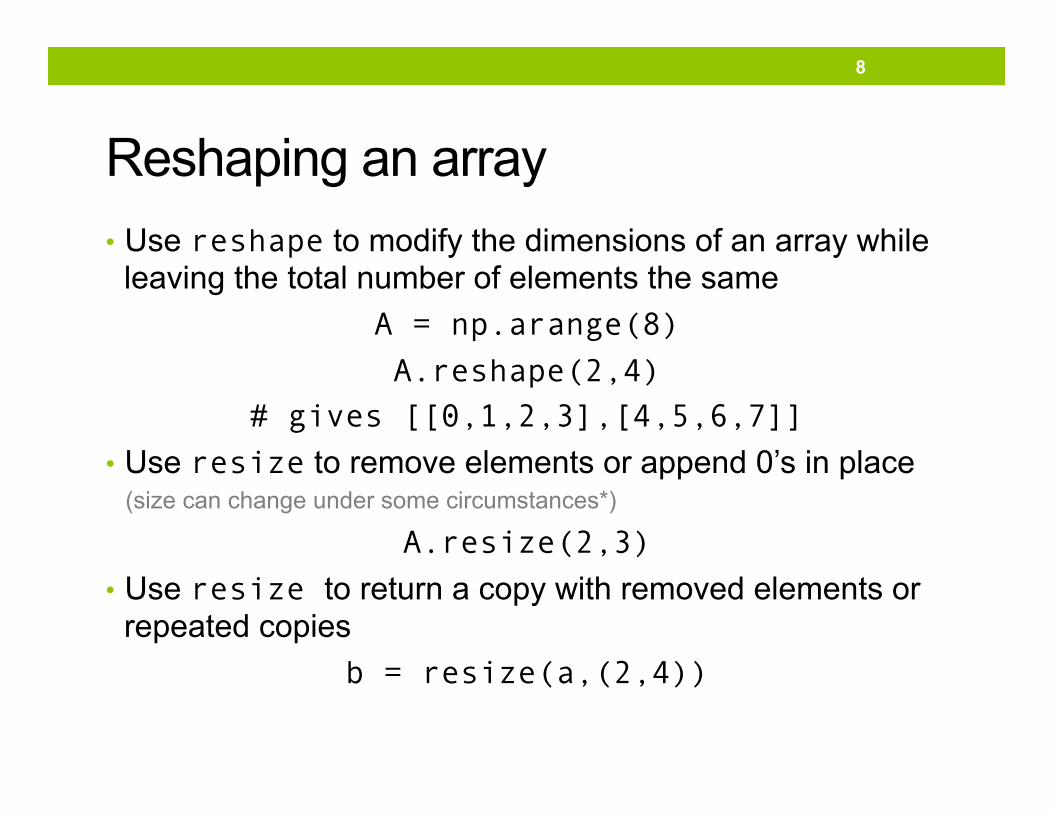
Reshaping an array • Use reshape to modify the dimensions of an array while
leaving the total number of elements the same A = np.arange(8) A.reshape(2,4)
# gives [[0,1,2,3],[4,5,6,7]] • Use resize to remove elements or append 0’s in place (size can change under some circumstances*)
A.resize(2,3) • Use resize to return a copy with removed elements or
repeated copies b = resize(a,(2,4))
• Numpy: basic objects, methods, functions • Numpy: linear algebra • Numpy: random • Matplotlib: 2D plots • Matplotlib: 3D plots • Scipy vs Numpy • Discuss assignment 4
9
Overview
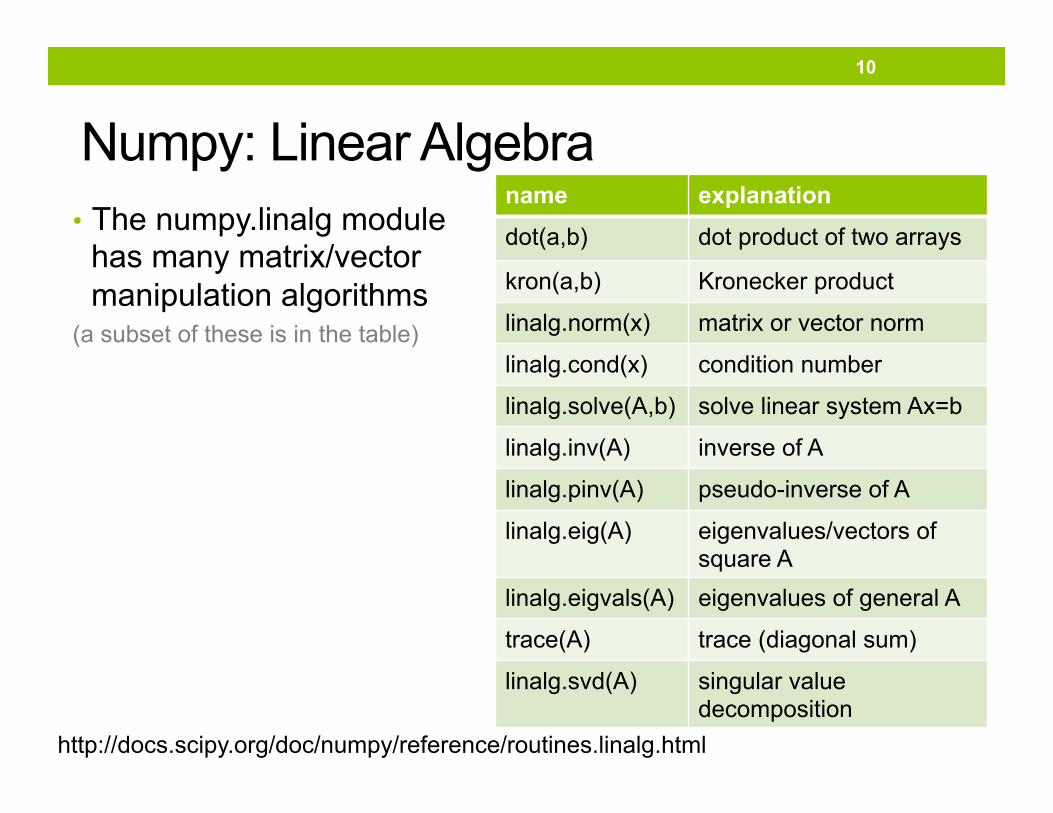
• The numpy.linalg module has many matrix/vector manipulation algorithms
(a subset of these is in the table)
10
Numpy: Linear Algebra name explanation dot(a,b) dot product of two arrays
kron(a,b) Kronecker product
linalg.norm(x) matrix or vector norm
linalg.cond(x) condition number
linalg.solve(A,b) solve linear system Ax=b
linalg.inv(A) inverse of A
linalg.pinv(A) pseudo-inverse of A
linalg.eig(A) eigenvalues/vectors of square A
linalg.eigvals(A) eigenvalues of general A
trace(A) trace (diagonal sum)
linalg.svd(A) singular value decomposition
http://docs.scipy.org/doc/numpy/reference/routines.linalg.html
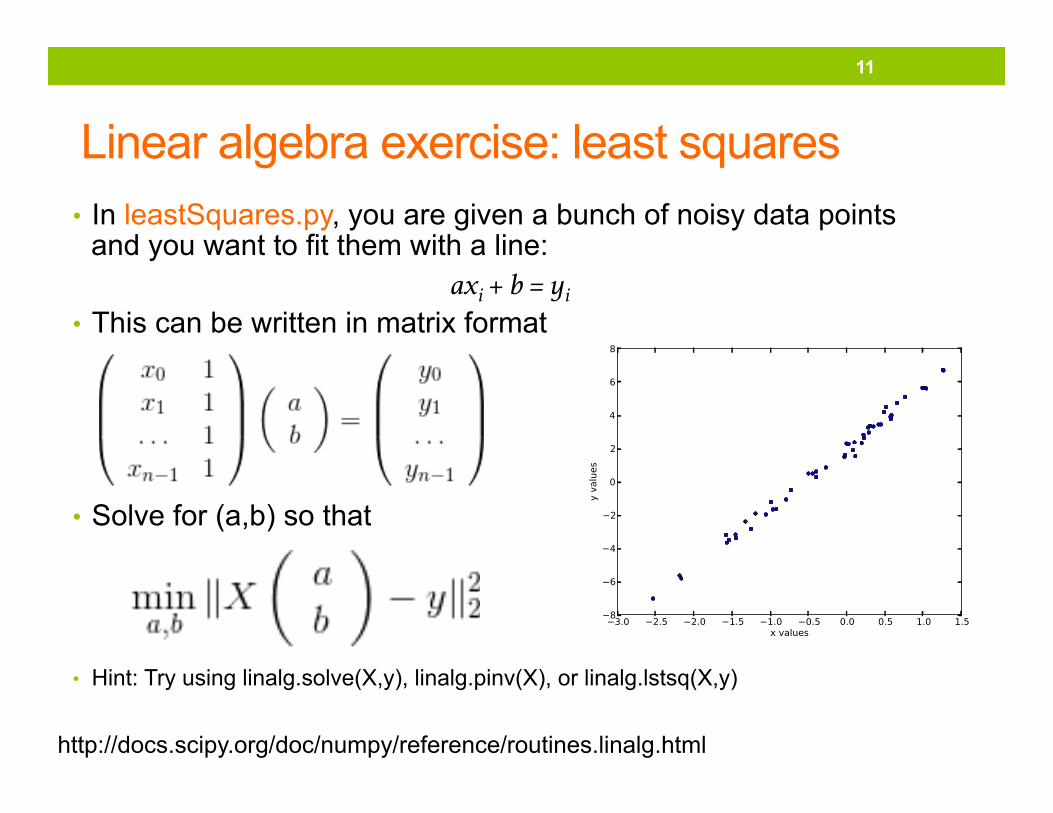
• In leastSquares.py, you are given a bunch of noisy data points and you want to fit them with a line:
axi + b = yi • This can be written in matrix format
• Solve for (a,b) so that
• Hint: Try using linalg.solve(X,y), linalg.pinv(X), or linalg.lstsq(X,y)
11
Linear algebra exercise: least squares
http://docs.scipy.org/doc/numpy/reference/routines.linalg.html
• Numpy: basic objects, methods, functions • Numpy: linear algebra • Numpy: random • Matplotlib: 2D plots • Matplotlib: 3D plots • Scipy vs Numpy • Discuss assignment 4
12
Overview
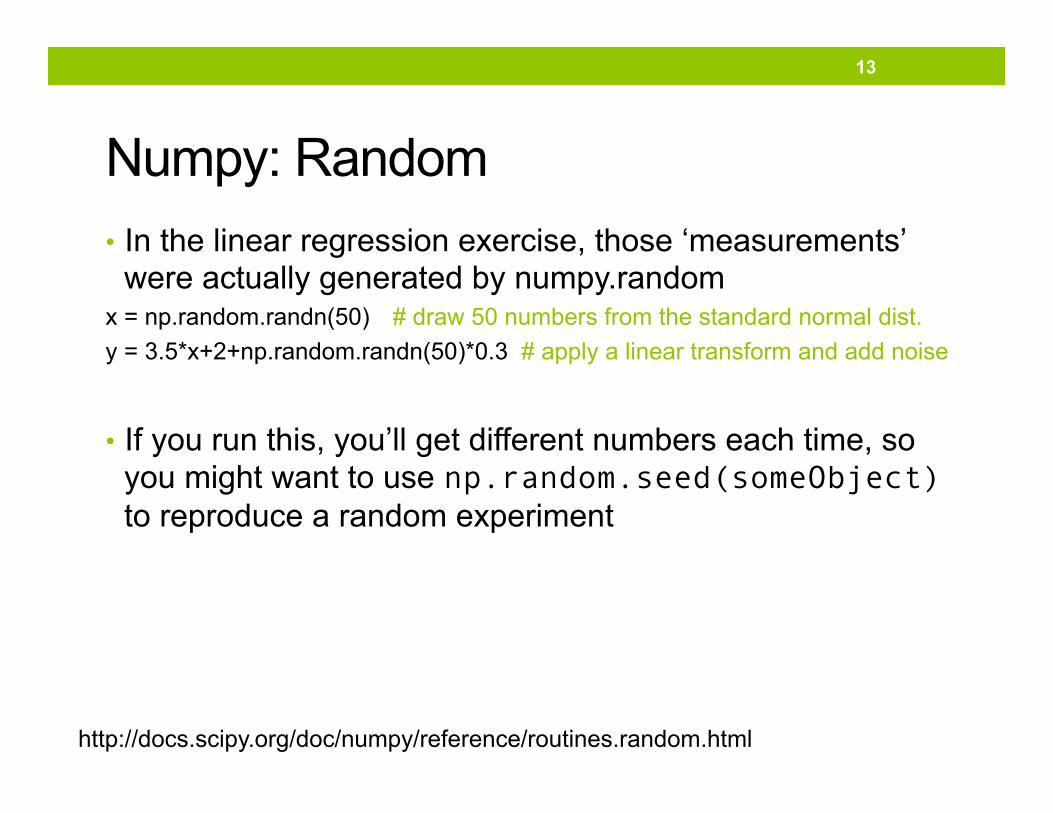
• In the linear regression exercise, those ‘measurements’ were actually generated by numpy.random
x = np.random.randn(50) # draw 50 numbers from the standard normal dist. y = 3.5*x+2+np.random.randn(50)*0.3 # apply a linear transform and add noise
• If you run this, you’ll get different numbers each time, so you might want to use np.random.seed(someObject) to reproduce a random experiment
13
Numpy: Random
http://docs.scipy.org/doc/numpy/reference/routines.random.html
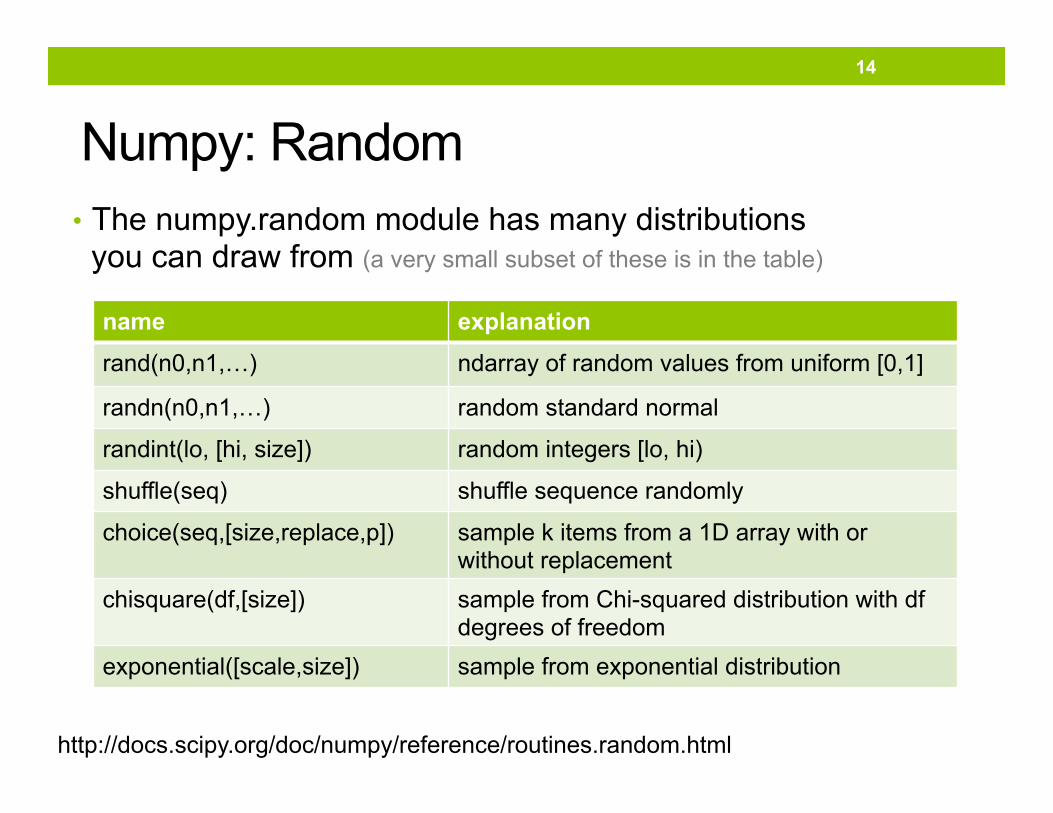
• The numpy.random module has many distributions you can draw from (a very small subset of these is in the table)
14
Numpy: Random
name explanation rand(n0,n1,…) ndarray of random values from uniform [0,1]
randn(n0,n1,…) random standard normal
randint(lo, [hi, size]) random integers [lo, hi)
shuffle(seq) shuffle sequence randomly
choice(seq,[size,replace,p]) sample k items from a 1D array with or without replacement
chisquare(df,[size]) sample from Chi-squared distribution with df degrees of freedom
exponential([scale,size]) sample from exponential distribution
http://docs.scipy.org/doc/numpy/reference/routines.random.html
• Numpy: basic objects, methods, functions • Numpy: linear algebra • Numpy: random • Matplotlib: 2D plots • Matplotlib: 3D plots • Scipy vs Numpy • Discuss assignment 4
15
Overview
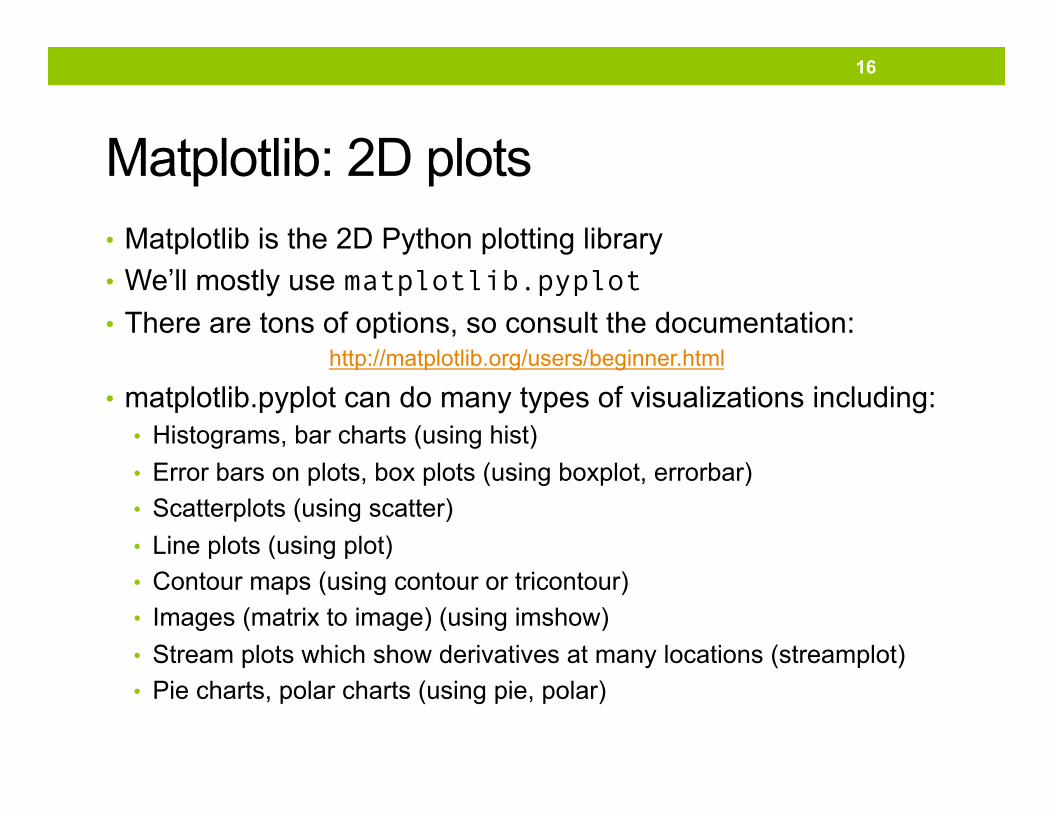
• Matplotlib is the 2D Python plotting library • We’ll mostly use matplotlib.pyplot • There are tons of options, so consult the documentation:
http://matplotlib.org/users/beginner.html
• matplotlib.pyplot can do many types of visualizations including: • Histograms, bar charts (using hist) • Error bars on plots, box plots (using boxplot, errorbar) • Scatterplots (using scatter) • Line plots (using plot) • Contour maps (using contour or tricontour) • Images (matrix to image) (using imshow) • Stream plots which show derivatives at many locations (streamplot) • Pie charts, polar charts (using pie, polar)
16
Matplotlib: 2D plots
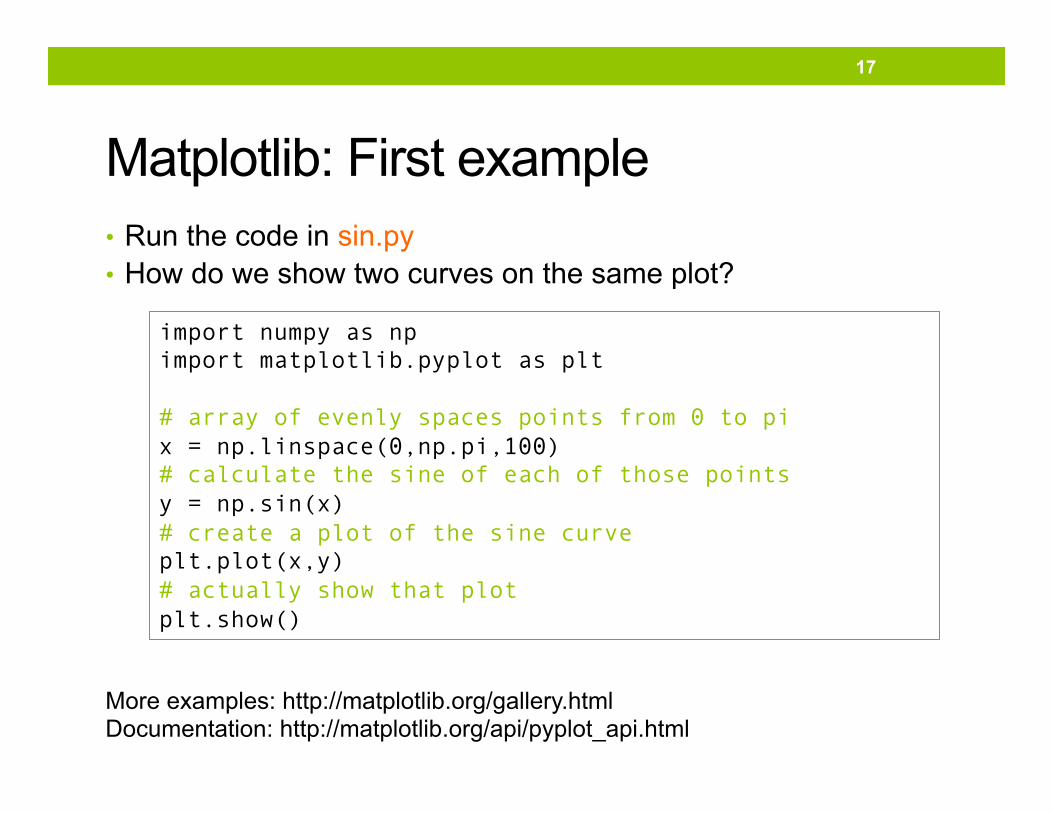
• Run the code in sin.py • How do we show two curves on the same plot?
17
Matplotlib: First example
import numpy as np import matplotlib.pyplot as plt # array of evenly spaces points from 0 to pi x = np.linspace(0,np.pi,100) # calculate the sine of each of those points y = np.sin(x) # create a plot of the sine curve plt.plot(x,y) # actually show that plot plt.show()
More examples: http://matplotlib.org/gallery.html Documentation: http://matplotlib.org/api/pyplot_api.html
• Uncomment lines 28-32 and run the code to produce a scatter plot
• At the end of the code create a plot that overlays the
scatter plot with a line plot showing your fit: ax+b = y
• As an extra challenge, try to color the markers of the data points to reflect their distance from the line
18
Back to the linear regression example

• Numpy: basic objects, methods, functions • Numpy: linear algebra • Numpy: random • Matplotlib: 2D plots • Matplotlib: 3D plots • Scipy vs Numpy • Discuss assignment 4
19
Overview
• To do 3D plotting, we’ll use mpl_toolkits.mplot3d Axes3D class
• Documentation: http://matplotlib.org/mpl_toolkits/mplot3d/tutorial.html#mplot3d-tutorial
• Can do: • Line plots (use plot) • Scatter plots (use scatter) • Wireframe plots (use plot_wireframe) • Surface plots (use plot_surface) • Contours (use contour) • Bar charts (use bar)
20
Matplotlib: 3D plots
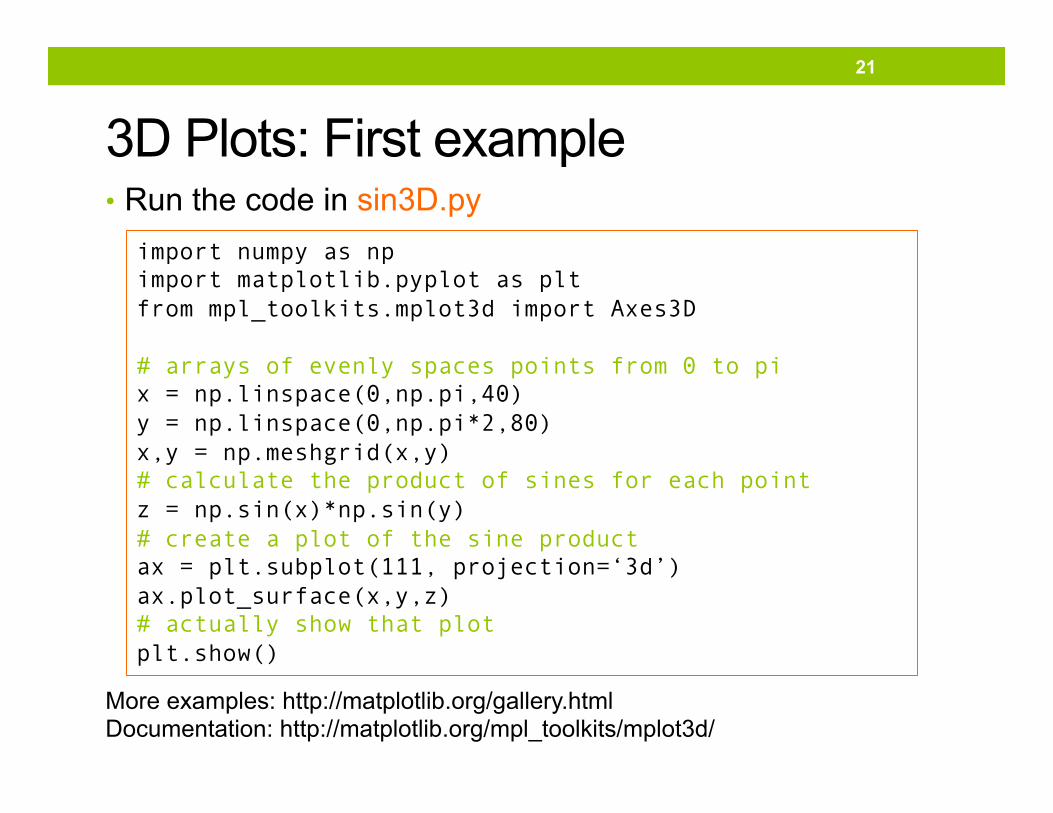
• Run the code in sin3D.py
21
3D Plots: First example
import numpy as np import matplotlib.pyplot as plt from mpl_toolkits.mplot3d import Axes3D # arrays of evenly spaces points from 0 to pi x = np.linspace(0,np.pi,40) y = np.linspace(0,np.pi*2,80) x,y = np.meshgrid(x,y) # calculate the product of sines for each point z = np.sin(x)*np.sin(y) # create a plot of the sine product ax = plt.subplot(111, projection=‘3d’) ax.plot_surface(x,y,z) # actually show that plot plt.show()
More examples: http://matplotlib.org/gallery.html Documentation: http://matplotlib.org/mpl_toolkits/mplot3d/
• Numpy: basic objects, methods, functions • Numpy: linear algebra • Numpy: random • Matplotlib: 2D plots • Matplotlib: 3D plots • Scipy vs Numpy • Discuss assignment 4
22
Overview
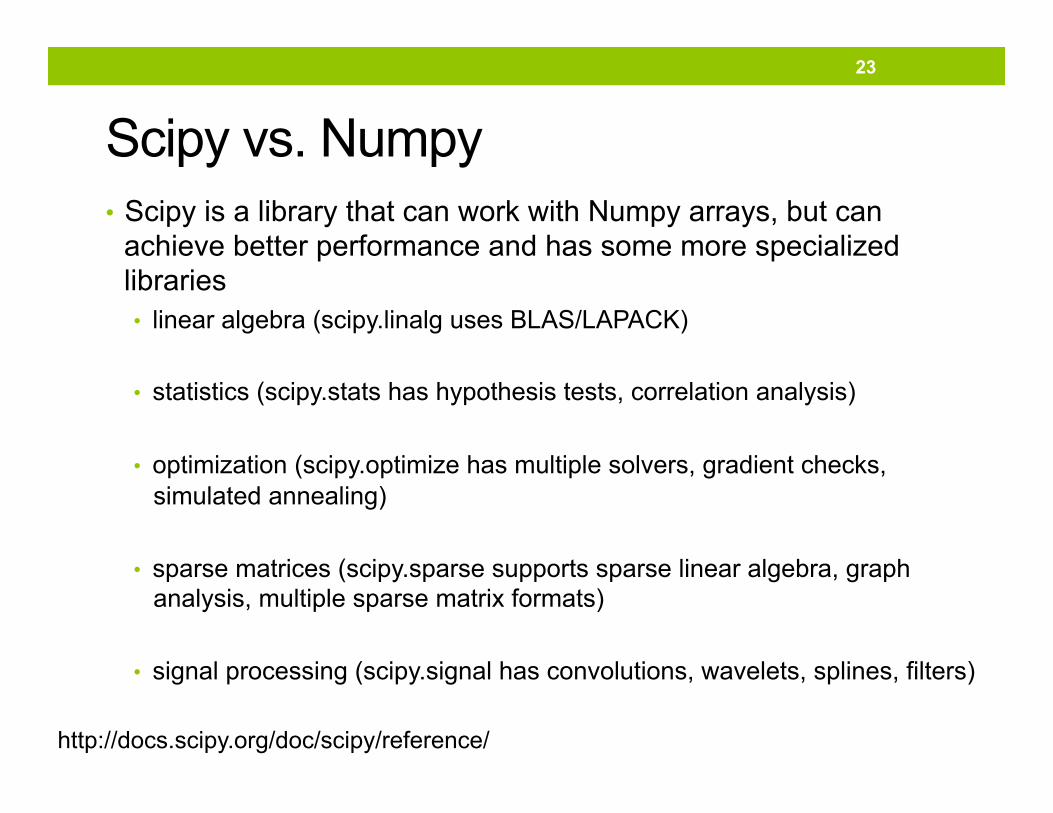
• Scipy is a library that can work with Numpy arrays, but can achieve better performance and has some more specialized libraries • linear algebra (scipy.linalg uses BLAS/LAPACK)
• statistics (scipy.stats has hypothesis tests, correlation analysis)
• optimization (scipy.optimize has multiple solvers, gradient checks, simulated annealing)
• sparse matrices (scipy.sparse supports sparse linear algebra, graph analysis, multiple sparse matrix formats)
• signal processing (scipy.signal has convolutions, wavelets, splines, filters)
23
Scipy vs. Numpy
http://docs.scipy.org/doc/scipy/reference/
• Numpy: basic objects, methods, functions • Numpy: linear algebra • Numpy: random • Matplotlib: 2D plots • Matplotlib: 3D plots • Scipy vs Numpy • Discuss assignment 4
24
Overview
Assignment 4 discussion • Your questions on assignment 4? • Tips for assignment 5:
• Online documentation is your friend. Don’t hesitate to use it! • Stuck? test smaller, simpler statements in interactive mode • Build test cases to verify correctness of your code (not every unit
test has to fit into the unittest module framework • Talk to each other. Use the CourseWork Forums. • Come to office hrs. Mon. 9:30-10:30, Wed. 3:15-4:15
25