1 keeping it local: shared solutions for sustainability biodiversity summit 7 th july 2011
TRANSCRIPT
1
Keeping It Local:Shared Solutions for Sustainability
Biodiversity Summit
7th July 2011

2
Welcome
Richard MooreThe University of Northampton

3
Dr Jeff Ollerton
4
Why biodiversity is Why biodiversity is important! important!
A summary of global and A summary of global and national issues national issues
Dr Jeff Ollerton
Landscape and Biodiversity Research Group
5
6

7

8
What is biodiversity?
“The variety of life in all its forms and at all levels, including genes,
species and ecosystems”

9
Modern technology allows us to study how demands on resources are destroying the natural world:
Deforestation in Borneo:
Credit: hugo Ahlenius, UNEP/GRID-Arendal

10
Deforestation in Borneo Twyford Down SSSI
c. 90% of UK lowland grassland destroyed or “improved” in last 100 years:
Credit: Jim Champion

11

12
Source: Department for Communities and Local Government - www.communities.gov.uk

13
Source: Department for Communities and Local Government - www.communities.gov.uk

14
Why does this really matter? Is it purely of aesthetic or academic concern?
15
“The first analysis of the UK’s natural environment in terms of the benefits it
provides to society and our continuing prosperity”
16
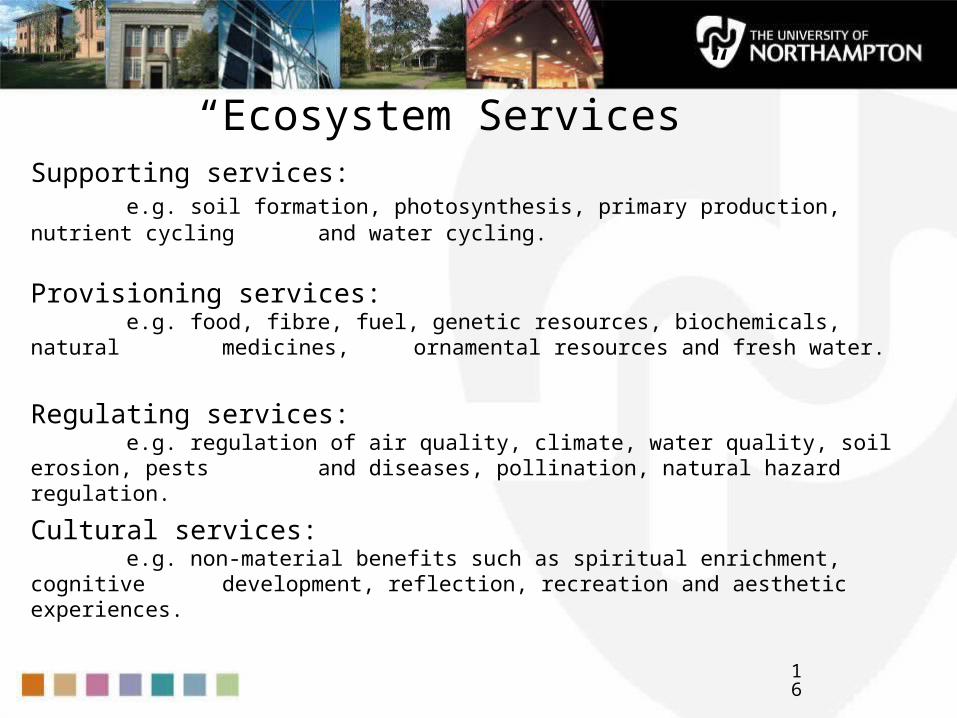
“Ecosystem Services”Supporting services:
e.g. soil formation, photosynthesis, primary production, nutrient cycling and water cycling.
Provisioning services: e.g. food, fibre, fuel, genetic resources, biochemicals, natural medicines, ornamental resources and fresh water.
Regulating services: e.g. regulation of air quality, climate, water quality, soil erosion, pests and
diseases, pollination, natural hazard regulation.
Cultural services: e.g. non-material benefits such as spiritual enrichment, cognitive
development, reflection, recreation and aesthetic experiences.
17
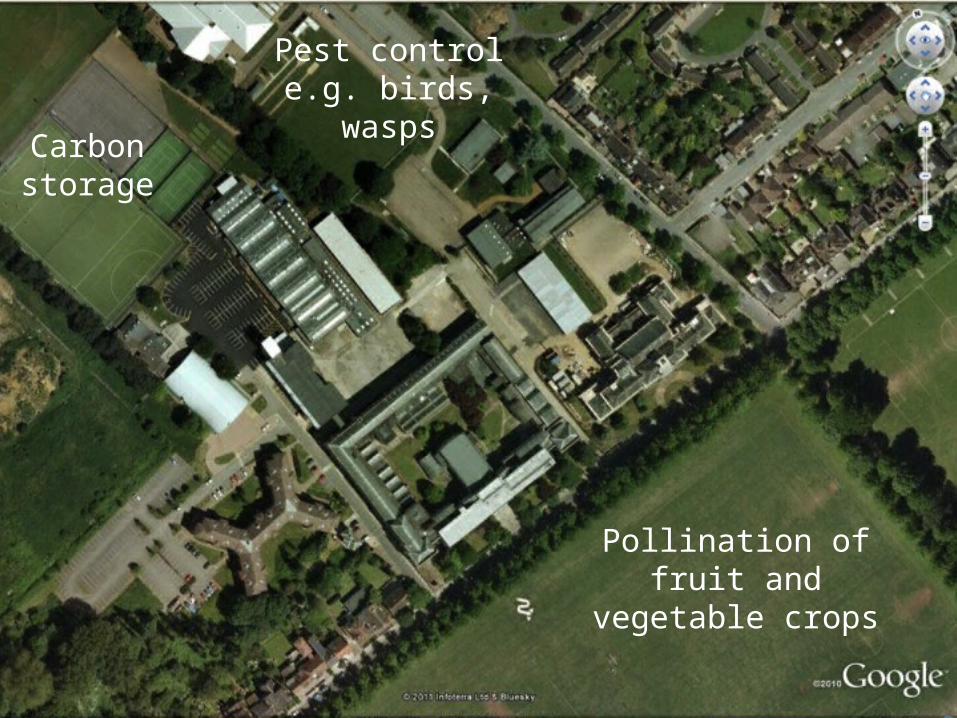
Carbon storage
Pest control e.g. birds, wasps
Pollination of fruit and vegetable
crops

18
Biodiversity of wetlands enhances water quality - £1.5 billion p.a.
Worth at least £30 billion per year – some examples:
Source: UK National Ecosystem Assessment 2011
Health benefits of living with a view of a green space - up to £300 per person per year.
Amenity benefits of living close to rivers, coasts and other wetlands -£1.3 billion p.a.
Wild pollinators are worth £430 million p.a. to British agriculture. [an underestimate…]

19
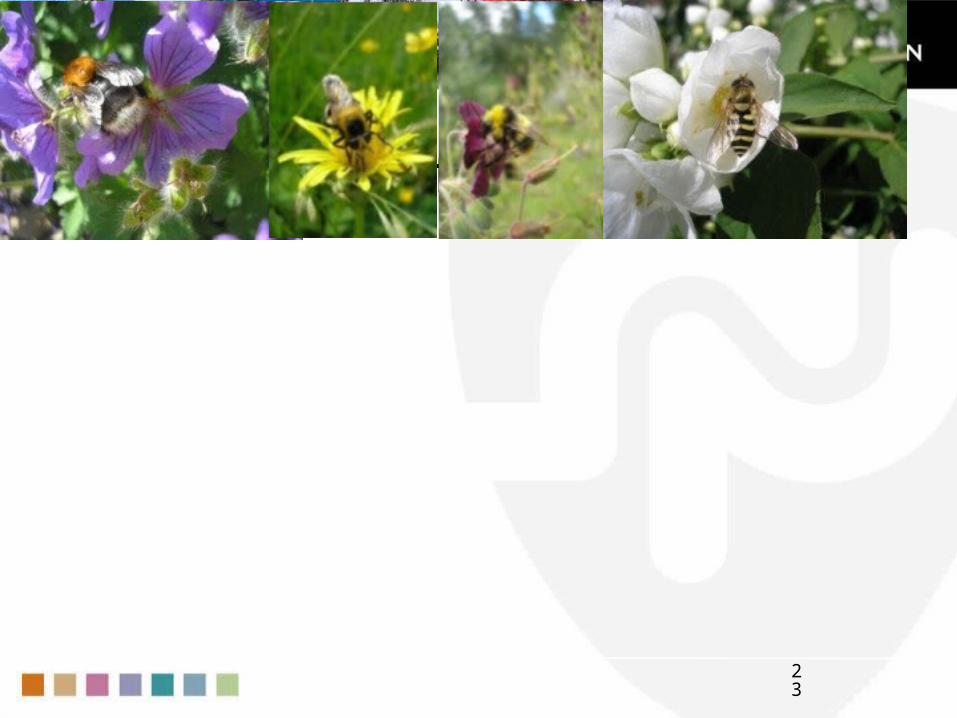
Approximately 250 species of bees
Images courtesy of Hilary Erenler, University of Northampton, ©2010.

20
British bee extinctions:Lasioglossum leave - pre 1800 Hoplitis leucomelana - pre 1800 Hylaeus punctulatissima - 1840 Chalicodoma ericetorum - 1844 Megachile lapponica - 1847Halictus subauratus - 1850s Bombus pomorum - 1864 Andrena nanula - 1877Rhophites quinquespinosus - 1878Coelioxys afra - 1892 Melecta luctuosa - 1912Andrena nana - 1930Halictus maculates - 1930 Andrena polita - 1934Andrena floricola - 1939 Bombus cullumanus - 1941Andrena tridentate - 1944Andrena vaga - 1946 Dufourea halictula - 1953Bombus distinguendus - 1981Nomada errans - 1982Bombus subterraneus - 1990 Osmia xanthomelana - 1998

21
• other bee species have reduced numbers in 50% of areas surveyed since the 1980s.
• about 70% of our commonest moths have declined since 1970s.
• 25% of hoverfly species have reduced in numbers since the 1980s.

22
There are multiple reasons for this:
• loss of habitat such as unimproved grassland.
• increased use of pesticides and other chemicals.
• removal of hedgerows and native woodland.
• urban expansion.
• climate change (?) All factors which broadly affect biodiversity
23
Thank you for listening
24
Dr Janet Jackson
25
Keeping it local!
Reassessing Biodiversity: sharing knowledge and expertise
from ‘our’ doorstep
Dr Janet Jackson
Senior Lecturer in Ecology and Environmental Management

26
Park Campus~15 hectaresgrassland
27
Where do the badgers live?
Park Campus
Wider landscape
Spatial and historical context
Connectivity – paths, corridors and patches
Islands – suitable habitat, meta-populations
Resources - foraging, outliers, territories

28
29
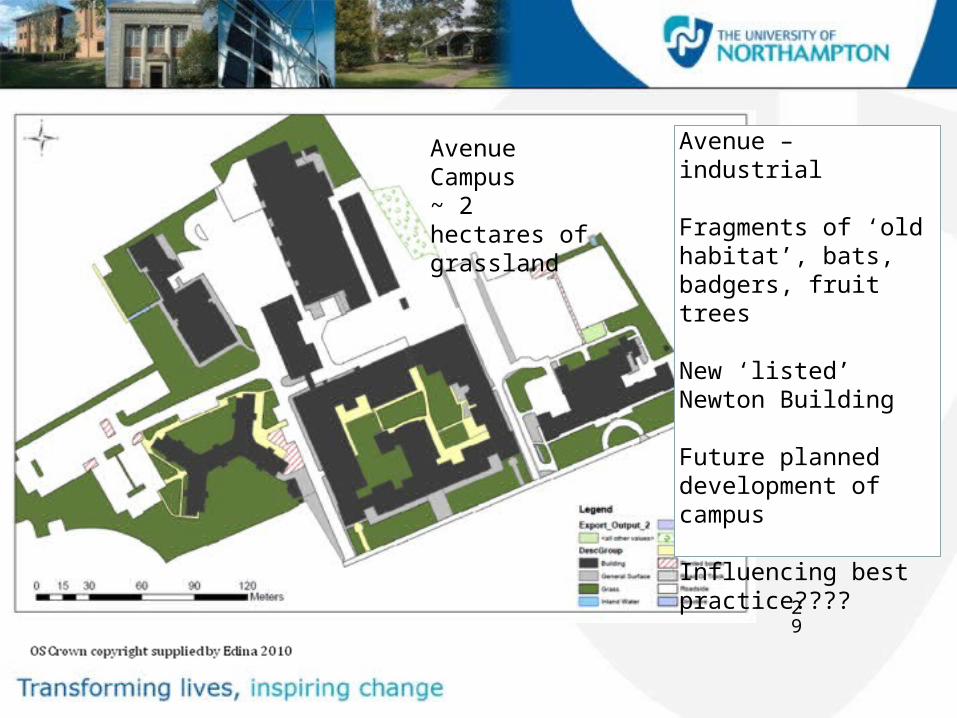
Avenue – industrial
Fragments of ‘old habitat’, bats, badgers, fruit trees
New ‘listed’ Newton Building
Future planned development of campus
Influencing best practice????
Avenue Campus~ 2 hectares of grassland
30
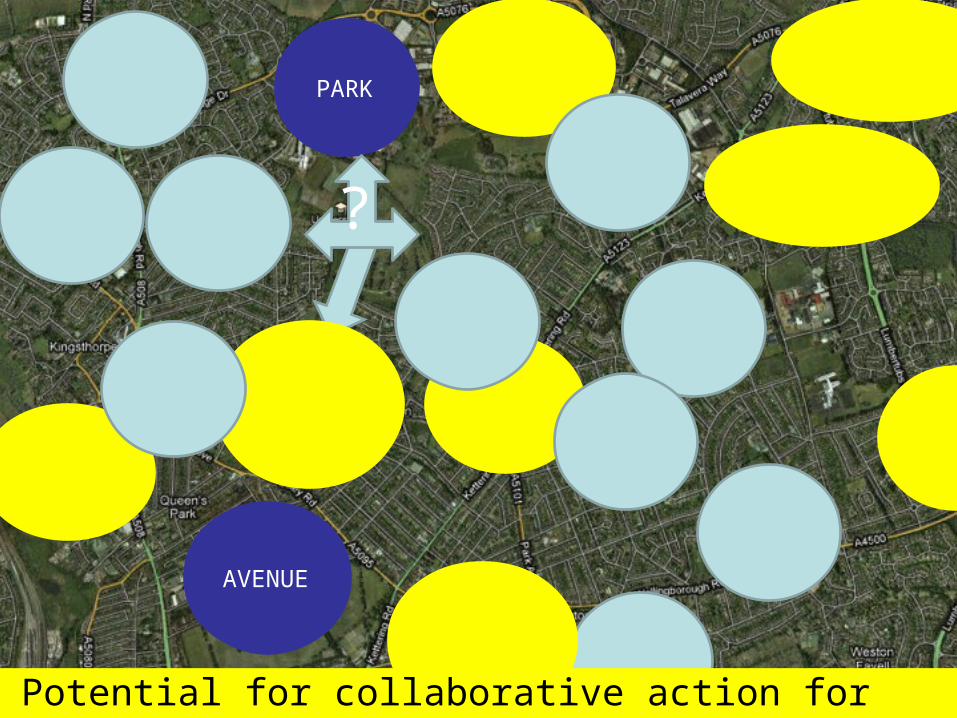
Grafton Street
Industrial Park
Round Spinney
Industrial estate
Moulton Industrial
Park
Morrison
PARK
Kingsthorpe Golf Club
AVENUE
?
Weston FavellShops
Northants Cricket Ground
NorthamptonCollege
Potential for collaborative action for biodiversity

31
Biodiversity and Ecosystem services
• On-site habitats and species - what role can they play?
• Pollination, production (food, fibre, fuel), nutrient recycling, pest control, pollution control, carbon capture, improvement of air quality......................etc.!
• Storm-water control, wetlands, SUDS?
• Wider linkages – watershed, river catchments, drainage
• Adaptation/resilience to climate change

32
Biodiversity and Ecosystem services
• Do we need a simple method of assessment and tools to measure value?
• How does ‘our’ location ‘fit’ with others?
• Do we need to talk to neighbours and the wider community?
• Are we contributing to or reducing flood risk and overall habitat loss?
• How can we do things differently?
• Can biodiversity come back?
33
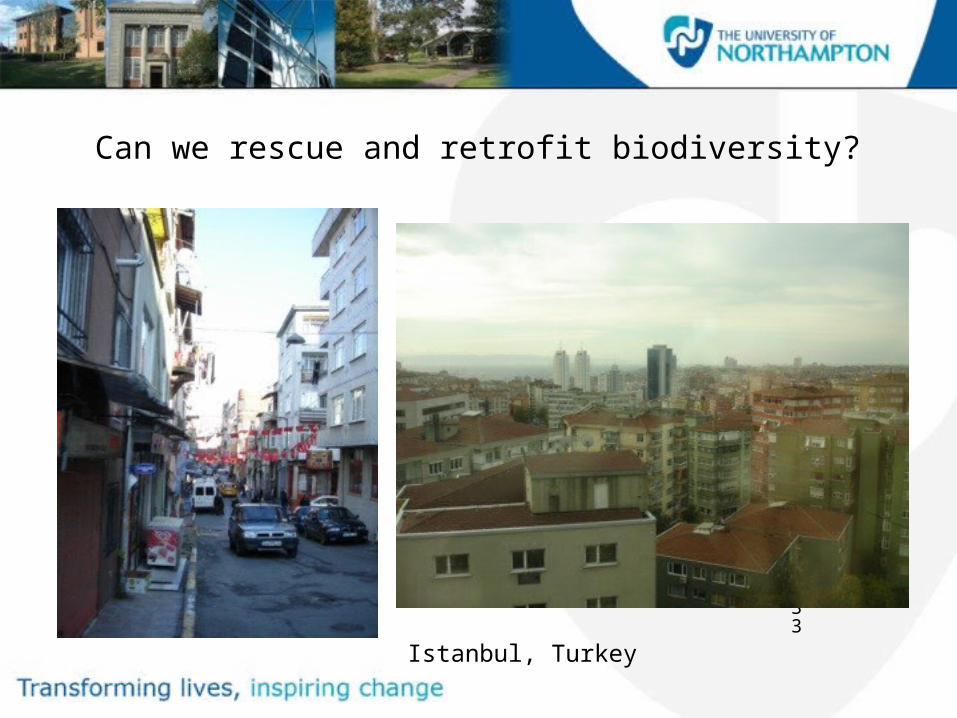
Can we rescue and retrofit biodiversity?
Istanbul, Turkey

34
Learning from others
Murrey Edwards College (formerly New Hall)University of Cambridge
Increase in porous surfaces

35
Sustainable Urban Environments
The Netherlands: Imaginative use of urban space with green roofs
There are many examples and techniques out there!

36
Government decentralisation of storm water management
http://www.stadtentwicklung.berlin.de/umwelt/landschaftsplanung/lapro/index_en.shtml
Increasing area of porous surfaces and rainwater harvesting which provides city cooling and other social benefits

37
Biodiversity, WFD and CSR
Berlin Senate for Urban Development (2010)
Sustainable urban drainage: [SUDS at Upton, Northampton]
38
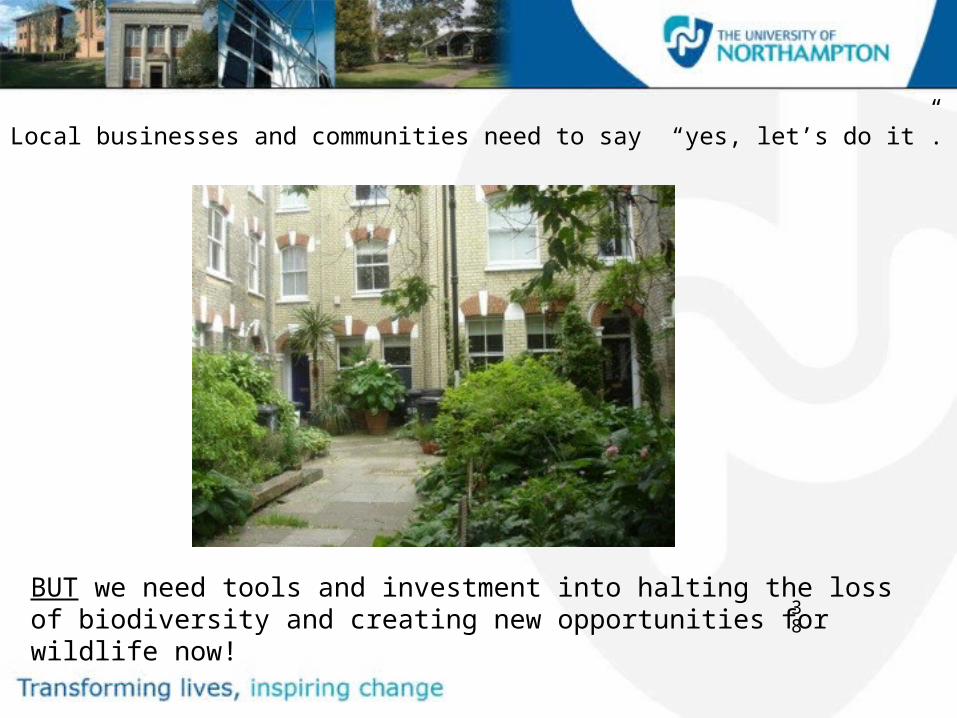
Local businesses and communities need to say “yes, let’s do it”.
BUT we need tools and investment into halting the loss of biodiversity and creating new opportunities for wildlife now!
39
Gareth Thomas

40
The Biodiversity Index: aspirations for a new tool for
biodiversity assessment
Gareth Thomas

41
Current drivers for the conservation of biodiversity
International/European drivers:
• Convention on Biological Diversity (2010)
• Our life insurance, our natural capital: an EU biodiversity strategy to 2020
• Birds Directive (2009)
• Habitats Directive (1992)
• Water Framework Directive (2000)
42
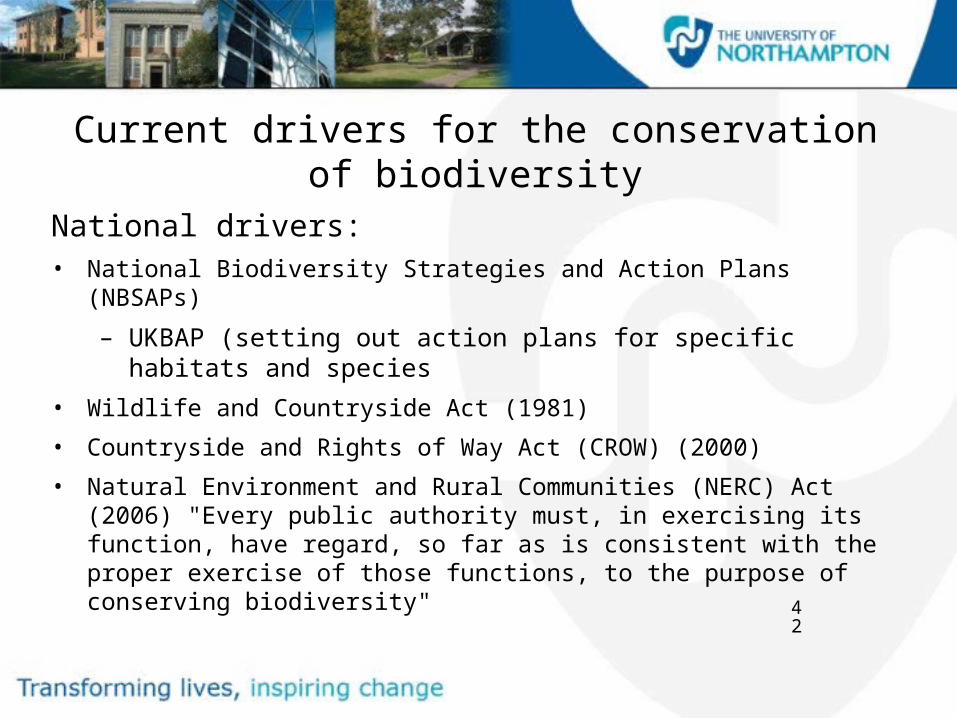
Current drivers for the conservation of biodiversity
National drivers:• National Biodiversity Strategies and Action Plans (NBSAPs)
– UKBAP (setting out action plans for specific habitats and species
• Wildlife and Countryside Act (1981)
• Countryside and Rights of Way Act (CROW) (2000)
• Natural Environment and Rural Communities (NERC) Act (2006) "Every public authority must, in exercising its function, have regard, so far as is consistent with the proper exercise of those functions, to the purpose of conserving biodiversity"

43
Current drivers for the conservation of biodiversity
Non-regulatory drivers• Corporate Social
Responsibility
• Consumer ethics/choice
• Ecosystem services
• Environmental Management Systems
– ISO14001
– EcoCampus
– IEMA Acorn Scheme
• Biodiversity offsetting

44
Tools for assessing biodiversity
• Phase 1 and 2 habitat surveys
• National Vegetation Classification (NVC)
• Wildlife Trust Biodiversity Benchmark
• National Biodiversity Network (NBN)
45
The Biodiversity Index
Biodiversity:
“the variety of life including genes, species, and ecosystems”
Index:
• “Something that serves to guide, point out or otherwise facilitate reference”
• “A number derived from a formula, used to characterise a set of data”

46
An example of a freshwater biotic index
• Ecological Quality Index (EQI)
• Based on the number of macro-invertebrate taxa
Biological Class
EQI for ASPT
EQI for Taxa
A (Very Good)
1.00 or above
0.85 or above
B (Good) 0.90-0.99 0.70-0.84
C (Fairly Good)
0.77-0.89 0.55-0.69
D (Fair) 0.65-0.76 0.45-0.54
E (Poor) 0.50-0.64 0.30-0.44
F (Bad)less than 0.50
less than 0.30

47
Developingthe Index

48
The initial survey of UoN campus
• Habitat recorded using a 1:1250 scale map of the campus
• Observational survey of the site identifying distinct areas of habitat
• Assessment of easily identifiable indicators of biodiversity

49
Avenue Campus GIS map

50
Interpreting the results
• Using aspects of the Ratcliffe Criteria (1977), assuming that one continuous block of habitat is able to support more species than the same total extent split over several areas
• Using Phase 1 habitat classifications as an initial basis for ascribing habitat characteristics
• Developing a set of values for each habitat type based on their approximate biodiversity value
Source: Handbook for Phase 1 habitat survey

51
Scoring
Habitat Grade Score Area1 (m2) Area2 (m2) Sum
Grassland Mono 5 1425 600 10125
Grassland <5 spp 50 385 19250
Grassland >5 spp 500
Grassland with Con trees Mono 6.5
Grassland with Con trees <5 spp 65
Grassland with Con trees >5 spp 650
Grassland with BL trees Mono 8.5 492 532 8704
Grassland with BL trees <5 spp 85
Grassland with BL trees >5 spp 850 Biodiversity Index = 38079
Habitat grade score x sum of area = Biodiversity Index for the habitat
The sum of all habitat scores = Biodiversity Index for the site

52
Adding value – considerations for biodiversity outside of the survey scope
• Incorporation of known fauna/flora into the scoring system
• A sliding scale of value depending on provision for species (e.g. bat boxes) and success of such provision (e.g. survey establishing roosts in boxes)
• Rapid assessment of pond habitat value and a relevant scoring system
• Recognising and valuing connectivity through corridors
• Increased scoring for identified BAP species and habitats

53
Considerations for presenting the results
• Web based• Spread sheet
based tool • Inclusion of GIS
data outputs• Visual
representation
54
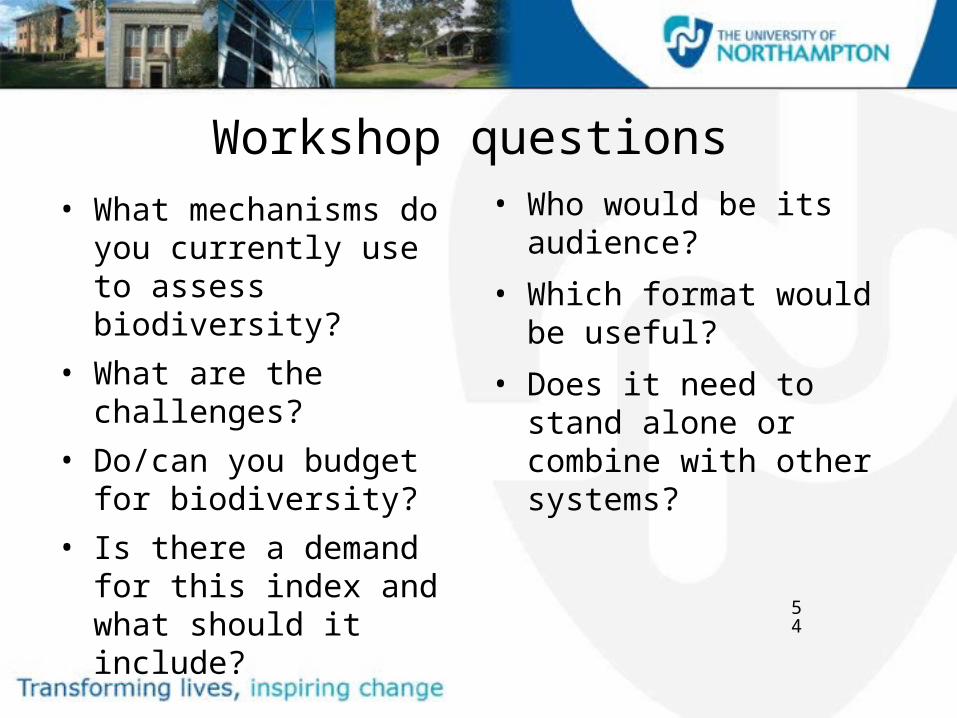
Workshop questions• What mechanisms do
you currently use to assess biodiversity?
• What are the challenges?
• Do/can you budget for biodiversity?
• Is there a demand for this index and what should it include?
• Who would be its audience?
• Which format would be useful?
• Does it need to stand alone or combine with other systems?

55
Thank you for listening!

56
Focus Groups
• RED - ROOM 008 - DR JEFF OLLERTON
• BLUE - ROOM 102 - DR JANET JACKSON
• GREEN- MAIN PLENARY GARETH THOMAS
57
Samantha Raggatt & Richard Moore
Local shared solutions forSustainability project –
Overview

58
Keeping It Local: Shared Solutions for Sustainability
Samantha Raggatt & Richard Moore

59
Rationale
• Regional Programme of Action for 2009-2011: ‘Tackling Climate Change in the East Midlands’.
• Northamptonshire Sustainable Communities Strategy
• Northamptonshire Local Area Agreement (LAA)
• HEFCE’s Sustainable Development Strategy
• UUK/GuildHE leaders’ statement of intent on sustainable development
• The University of Northampton’s Strategic Plan 2010-15

60
Aims
1. To reduce carbon emissions in Northamptonshire by
engaging strategic partners to work holistically to
positively impact on the environmental, social and
economic sustainability of the County.
2. To increase area-based sustainable development by developing a model of inter-organisational best practice to be disseminated across sectors.

61
Objectives1. Identify sustainability aims, objectives and targets
common to all partners.
2. Identify shared solutions that positively impact on the environmental, social and economic sustainability of Northamptonshire.
3. Create an action plan for implementing these shared solutions between the partners.
4. Ensure the model of inter-organisational working is replicable as an example of best practice.

62
Deliverables
• 5 Carbon Summits
• 8 Think Tanks
• Resource Efficiency Training Programme
• Biodiversity Index
• Big Green Challenge
• Keeping It Local: The Northamptonshire Action Plan for Shared Solutions for Sustainability
• Toolkit

63
Resource Efficiency Training
• This is training aimed at public sector organisations such as County council, District councils, NHS, Housing Associations, Police etc. The training will take the form of a 1 day training session followed by a half day practical session.
• Dates:
• 13th June Kettering
• 11th July NCC, Northampton
• 18/19th July CBC, Corby
• 25th July NCC, Northampton
• 28/29th July NCC, Northampton
• 28th September Kettering (1/2 day session)

64
Carbon Summits & Think Tanks
• These key events for gaining input from a broad range of groups/individuals on each of the different focus from areas of the project. These are aimed at attracting 60+ participants and are followed up with smaller think tanks (10+) where experts will discuss and agree on key lessons learnt.
• 7th July Biodiversity Summit; Newton Building, University of Northampton
• Sept 2011Biodiversity Think Tank; tbc
• 6th Sept Transport Summit; Rockingham Raceway, Corby
• 20th Sept Transport Think Tank; tbc
• 12th Oct Waste Summit, Icon Building; tbc
• 27th Oct Waste Think Tank, Icon Building; tbc
• Feb 2012 Energy & Water Summit; tbc
• Feb 2012 Energy Think Tank; tbc
• Feb 2012 Water Think Tank; tbc

65
Key Milestones
• Recruit Project Manager
• Establish Core Team
• Steering Group Meeting
• Carbon Summits
• Resource Efficiency Training Development
• Biodiversity Index Development
• Big Green Challenge (Low Carbon Business Challenge Competition)
• Resource Efficiency Training Delivery
• Website Development
• Think Tanks
• Sign Collaboration Agreement
• Biodiversity Index Testing
• Delivery of the Action Plan for Northamptonshire
• Develop Toolkit; Launch Toolkit, inc Community of Practice.
• Regional Training Events; Conference Presentations; HEFCE LGM Annual Conference Presentation
• By Start November 2010.
• October 2010.
• Quarterly from September 2010.
• November 2010- April 2012.
• October 2010 & November 2010.
• September 2010- August 2011.
• November 2010.
• November 2010 onwards.
• December 2010- July 2011.
• February 2011 onwards.
• September 2010.
• April 2011- August 2012.
• August 2011.
• September-November 2011; December 2011.
• December 2011-August 2012; September 2011-July 2012; January 2012.

66
Thank you

67
Feedback
Focus group results and summary
68
THANK YOU
LUNCHServed in room 101