1 june 2008. 2 safe harbor statement this presentation contains forward-looking statements...
TRANSCRIPT
1
June 2008
2
Safe Harbor Statement
This presentation contains forward-looking statements concerning the
Company’s business, products and financial results. The Company’s actual
results may differ materially from those anticipated in the forward-looking
statements depending on a number of risk factors including, but not limited
to, the following: general economic and business conditions, development,
shipment, market acceptance, additional competition from existing and new
competitors, changes in technology, and various other factors beyond the
Company’s control. All forward-looking statements are expressly qualified in
their entirety by this Cautionary Statement and the risk factors detailed in
the Company's reports filed with the Securities and Exchange Commission.
China Green Agricultural undertakes no duty to revise or update any
forward-looking statements to reflect events or circumstances after the date
of this material.
3
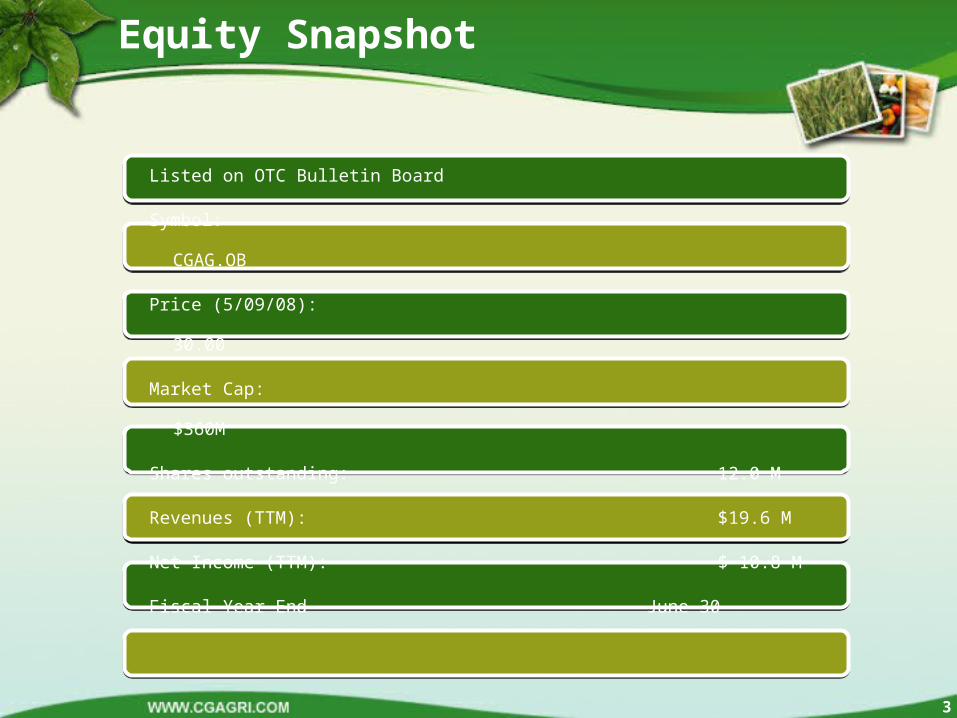
Equity Snapshot
Listed on OTC Bulletin Board
Symbol: CGAG.OB
Price (5/09/08): 30.00
Market Cap: $360M
Shares outstanding: 12.0 M
Revenues (TTM): $19.6 M
Net Income (TTM): $ 10.8 M
Fiscal Year End June 30

4
Investment Highlights
High rate of growth with solid financial footing and industry leading margins
Extensive distribution and sales network with a high degree of brand recognition
Rising demand for green fertilizer products
Strong R&D and production base with a robust pipeline of new products
Experienced management team

5
Company Overview
Leading player in the research, development,
production, marketing and distribution of humic
acid liquid compound fertilizers throughout 27
provinces across China
Focused on the need for green, sustainable,
environmentally friendly compound fertilizers
Well positioned to dominate the organic
compound fertilizer market in China due to
technological advances in R&D and production
Recipient of several awards for innovative new
fertilizer products
Headquartered in Xi’an, Shaanxi province with
120 employees

6
A Vast and Expanding Market
The China market consumes 46.4 million tons of fertilizer annually worth an estimated $36 billion^
China is world’s largest fertilizer* manufacturer
(33% of global production)
China is world’s largest fertilizer consumer*
(35% of global consumption)
The Chinese government is encouraging the production of organic
produce for export and domestic consumption:
Organic products contain no pesticides, alleviating food safety
concerns
Organic products sell for higher prices, improving the economic
conditions of farmers
Green fertilizers are crucial to raising organic producing,
resulting in an increase of consumption
Global Fertilizer Consumption*
China, 35%
Rest of World, 65%
*China Agricultural Means of Production Circulation Association ^International Fertilizer Industry Association

7
Fertilizer Market Trends
Demand for fertilizers continue to grow
Shrinking arable land: Currently 40% of per capita world average and declining due to urbanization and growing population*
Environmental pollution is a growing
concern
Overuse of chemical fertilizers (exceeding
safe levels by nearly 80%) has left land
barren and contaminated ground water with
chemical residues
Organic compound fertilizers are growing
in popularity
Only 25% of fertilizers used in China are
organic compared to 50% internationally^,
China’s goal. Hybrid organic compound
fertilizers, are good for soil quality, are eco-
friendly and produce sustainable results.
*Ministry of Land and Resources^Technology Promotion Centre
Compound Fertilizer Use in Developing World
0
20
40
60
80
100
120
1970/71
1972/73
1974/75
1976/77
1978/79
1980/81
1982/83
1984/85
1986/87
1988/89
1990/91
1992/93
1994/95
1996/97
1998/99
2000/01
2002/03
2004/05
8
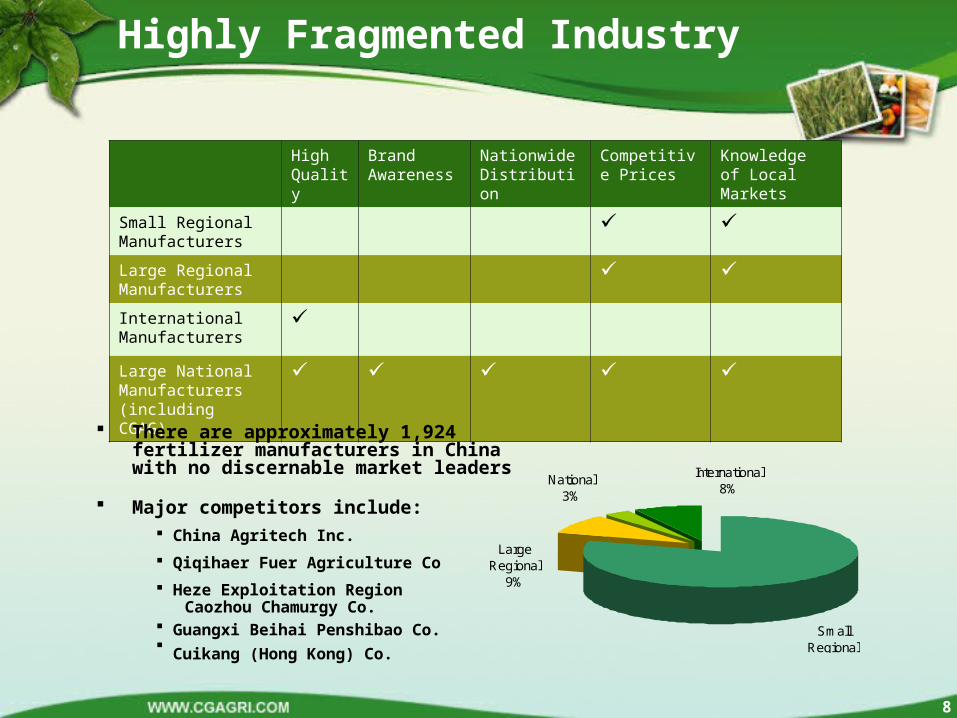
Highly Fragmented Industry
High Quality
Brand Awareness
Nationwide Distribution
Competitive Prices
Knowledge of Local Markets
Small Regional Manufacturers
Large Regional Manufacturers
International Manufacturers
Large National Manufacturers (including CGAG)
There are approximately 1,924 fertilizer manufacturers in China with no discernable market leaders
Major competitors include: China Agritech Inc.
Qiqihaer Fuer Agriculture Co
Heze Exploitation Region Caozhou Chamurgy Co. Guangxi Beihai Penshibao Co. Cuikang (Hong Kong) Co.
Small Regional
80%
Large Regional
9%
National 3%
International8%

9
Humic Acid is the base ingredient for all of China Green Agriculture’s products Humic acid is an essential natural, organic ingredient for balanced, fertile soil.
One of the major constituents of organic matter A byproduct of decomposed animal or plant material; found in, peat, lignite or weathered coal
China Green Agriculture’s main source for humic acid is weathered coal
Abundant and cheap - $50/Metric ton Numerous domestic suppliers available; main
supplier is Lupoling Coal Mine Industry and Trade Company
What is Humic Acid?

10
The Need for Humic Acid
WithoutWith
Improves soil structure:
Increases aeration Increases nutrient absorption Increases water retention Buffers against fluctuations in pH levels Reduces soil crusting problems Reduces soil erosion from wind, and water Reduces radical toxic pollutants Promotes the development of root systems Promotes seed germination Promotes overall plant development Promotes health Promotes resistance to stress Improves physical appearance
No known synthetic material can match humic acid's effectiveness and versatility.
Why is Humic Acid Important?

11
Product Categories
Three Main Product Categories
Broad Spectrum: Can be applied to all kinds of crops
Functional: Have certain special effects on crops Examples are growth regulation fertilizer and
fertilizer for promoting blooming and fruiting
Tailored: Effect targeted crops Examples include specific fertilizers for
strawberries and specific fertilizer for gourd vegetables
111 different fertilizer products.

12
Nationwide Presence
Four Regional Offices
Lack of regional dependence: 450 distributors across 27 provinces – top 10 distributors accounted for only 10% of revenue; top distributor accounted for only 1.32% of total revenue
100 onsite sales representatives across China to engage in marketing, after sales service and informational seminars in local dialects
Custom built SMS service to service customers
Online services
Nationwide hotlines
Beijing
Tianjin
Lanzhou
Chongqing
CHINA
INDIA
CHINA
INDIA
Offices

13
State of Art Research & Development Facility
137,000 m2 R&D facility for product testing
Short product development cycles result in short product TTM (Time to Market)
Six intelligent, soil-free greenhouses with drip irrigation allow controlled simulation of diverse environments
Precise product testing ensures quality and effectiveness
Generated $1.8 in FY2007 million in income through selling testing byproducts

14
Demand driven product development
100 field sales agents spread across 27 provinces gathering nationwide data
Short new product development cycle due to efficient R&D processes, generally three to nine months
Identify
new product
needs from
customer
feedback
Collect market
research data
on market size,
price
sensitivity,
demand, etc.
Integrate
raw data
into a
feasibility
study
Develop a
budget for
expected
revenues
and costs
Develop samples
which are analyzed
with spectral
analysis and field
experiments
Trial sales Mass
Production
Product Development Process
15
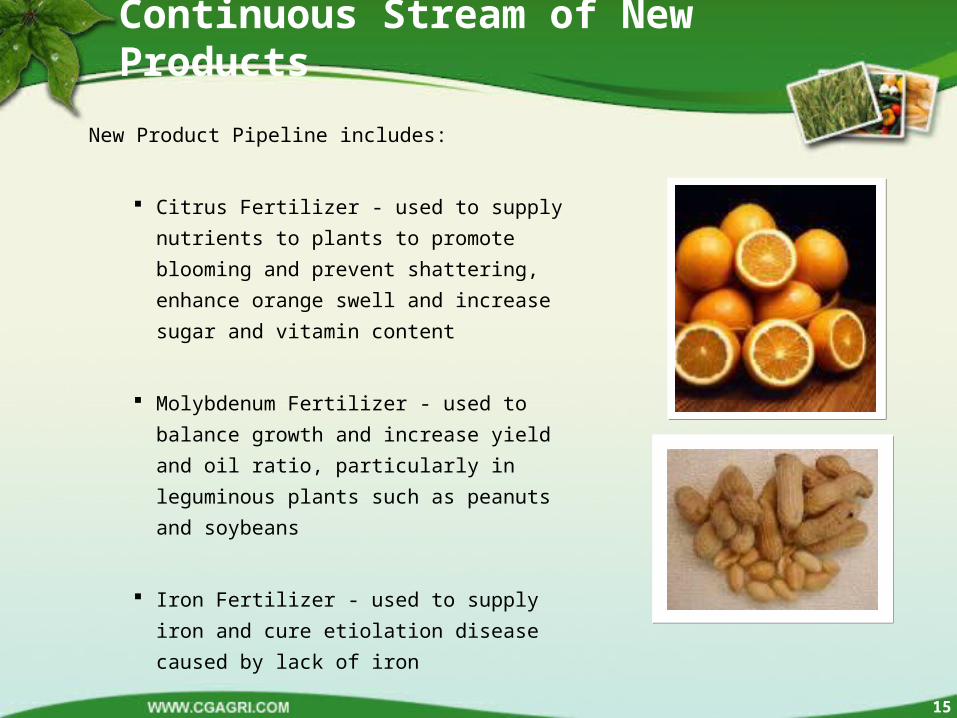
Continuous Stream of New Products
New Product Pipeline includes:
Citrus Fertilizer - used to supply nutrients to
plants to promote blooming and prevent
shattering, enhance orange swell and
increase sugar and vitamin content
Molybdenum Fertilizer - used to balance
growth and increase yield and oil ratio,
particularly in leguminous plants such as
peanuts and soybeans
Iron Fertilizer - used to supply iron and cure
etiolation disease caused by lack of iron

16
Modern Production Facility
47,000 m2, 10,000 metric ton capacity, purpose built, fully automated production facility
Reached 80% of design capacity
21 vats in total - nine eight metric-ton capacity, 12 two-metric-ton capacity, eight two-metric-ton capacity, and two one-metric ton capacity vats
18 employees are dedicated to production .
Medical grade production equipment
Precise quality control through spectral analysis and automated computer controlled weighing and testing

17
Experienced Management Team
Tao Li, President and CEO Established Shaanxi TechTeam Jinong Humic Acid Product Co., Ltd in 2000 Masters degree from Northwest Polytechnic University Previous experience at World Bank, Northwest Polytechnic University
Professor Xianglan Li, General Engineer Graduate of Northwest A&F University expert in Chinese soil organic content Published over 30 theses and books
Yu Hao, Financial Manager Financial manager since 2002; previously financial manager for Shaanxi Fengxiang
Automobile Repair Plant, and Shaanxi Baoji Xinsanwei Import & Export Trading Co.
Wang Feng, Sales Director Sales director since August 2002; previously sales manager of Beijing Century Albus Bio-
tech Co., Ltd and Shaanxi Tianjia Agricultural Technique Co., Ltd.

18
Growth Strategy
Increase production capacity
Use proprietary automation technology to increase production Increase production from 10,000 to 50,000 metric tons with a new production line which is
scheduled to be completed by the beginning of 2009 Recently broke ground on new factory
Increase and refine R&D efforts Improve R&D facility to create tailored products with superior quality and a short time to
market cycle Build and equip facility with modern equipment next to existing greenhouses
Increase marketing and branding activities
Continue to build brand recognition using multi-tiered branding strategy
Bolster distribution Recently added 6 new regional offices Continue to build China Green Agriculture’s own distribution network
Develop local sales services Invest in training and feedback infrastructure including internet, SMS, and telephone based systems

19
Income Statement Summary
Summary Income Statement Nine Months Ended Year Ended March, 31 June 30
Summary Income Statement Nine Months Ended Year Ended March, 31 June 30
($ in million) 2008 2007 2007 2006($ in million) 2008 2007 2007 2006
Revenues $15.4 $9.1 $15.2 $7.9Revenues $15.4 $9.1 $15.2 $7.9
Gross Profit $9.0 $5.4 $ 8.6 $4.4Gross Profit $9.0 $5.4 $ 8.6 $4.4
Gross Margin 59% 59% 57% 56%Gross Margin 59% 59% 57% 56%Operating Income $7.0 $4.5 $7.6 $2.9Operating Income $7.0 $4.5 $7.6 $2.9
Operating Margin 45% 50% 50% 37%Operating Margin 45% 50% 50% 37%Net Income $6.4 $4.0 $ 6.9 $2.7Net Income $6.4 $4.0 $ 6.9 $2.7
20
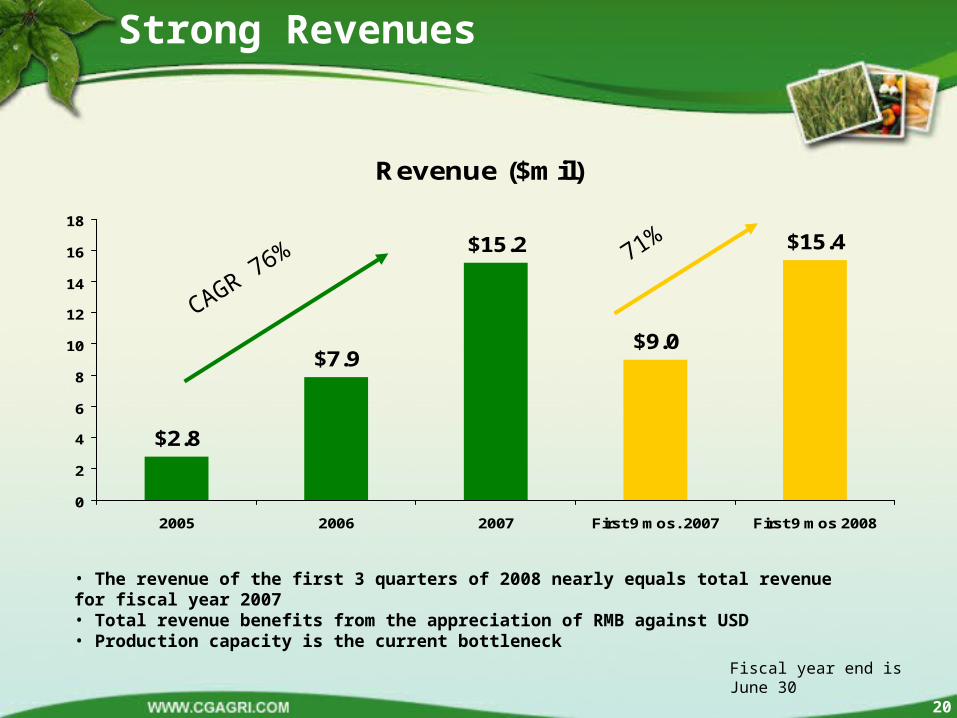
Strong Revenues
Revenue ($mil)
$15.4
$9.0$7.9
$2.8
$15.2
0
2
4
6
8
10
12
14
16
18
2005 2006 2007 First 9 mos. 2007 First 9 mos 2008
Fiscal year end is June 30
• The revenue of the first 3 quarters of 2008 nearly equals total revenue for fiscal year 2007• Total revenue benefits from the appreciation of RMB against USD• Production capacity is the current bottleneck
CAGR 76% 71%

21
Steady Increase in Sales
Sales Volume (tons)
1,618
5,136
8,358
5,467
6,701
0
1000
2000
3000
4000
5000
6000
7000
8000
9000
2005 2006 2007 First 9 mos. 2007 First 9 mos 2008
CAGR 73% 23%
• Production capacity is the current bottleneck• The sales volume of 3 Qs in fiscal year 2008 increased 23%, lower than the increase of revenue of 71% - this was driving by a disproportionately large increase in sales of high end products

22
Increasing Gross Profit and Margin
Gross Profit and Margin ($mil)
4.4
8.6
5.4
9.0
55%
57%
59% 59%
0.0
1.0
2.0
3.0
4.0
5.0
6.0
7.0
8.0
9.0
10.0
2006 2007 First 9 mos 2007 First 9 mos 2008
53%
54%
55%
56%
57%
58%
59%
60%

23
Fertilizer – Average Sales Price
RMB
12,39612,467
12,527
13,110
12,000
12,200
12,400
12,600
12,800
13,000
13,200
2006 2007 9M 2007 9M 2008
• Average sale price has experienced consistent growth, both in RMB and USD• Exchange rate fluctuations have further benefited average sales prices in USD terms
Price Per Ton
USD
1,536
1,595 1,586
1,769
1,400
1,450
1,500
1,550
1,600
1,650
1,700
1,750
1,800
2006 2007 9M 2007 9M 2008
0.6%
4.7%11.6%
3.9%

Expenses As Percentage of Total Revenues
24
• Expenses as percentage of total revenue have maintained stability across time periods
• Total expenses for reverse merger and private placement was US$725,500 for the first 3 Qs of 2008; After excluding such expenses, the normalized G&A was stable compared to previous periods

25
Healthy Net Income Growth
Net Income ($mil)
$6.4
$4.0
$12.6
$6.9
$2.7
35.0%
41.2%44.0%
45.0%46.0%
0.0
2.0
4.0
6.0
8.0
10.0
12.0
14.0
2006 2007 2009E** First 9 mos 2007 First 9 mos 2008
0.0%
5.0%
10.0%
15.0%
20.0%
25.0%
30.0%
35.0%
40.0%
45.0%
50.0%
**2009 net income figure is based on make good provision pursuant to the private placement agreement in December 2007. Make good EPS in 2009 is $0.609; 3,156,808 make good shares have been placed in an escrow account for the duration of the make good period

26
Strong Balance Sheet
($ in millions) 3/31/07 6/30/2007 ($ in millions) 3/31/07 6/30/2007
Cash and Equivalents $14.0 $ 0.08Cash and Equivalents $14.0 $ 0.08
Total Current Assets $26.1 $ 4.1 Total Current Assets $26.1 $ 4.1 Total Assets $ 45.0 $ 17.1 Total Assets $ 45.0 $ 17.1 Total Liabilities $ 30.2 $ 8.3 Total Liabilities $ 30.2 $ 8.3 Total Shareholders’ Equity $ 14.8 $ 8.8Total Shareholders’ Equity $ 14.8 $ 8.8
Total Liabilities and Shareholders’ Equity $ 45.0 $ 17.1Total Liabilities and Shareholders’ Equity $ 45.0 $ 17.1
27
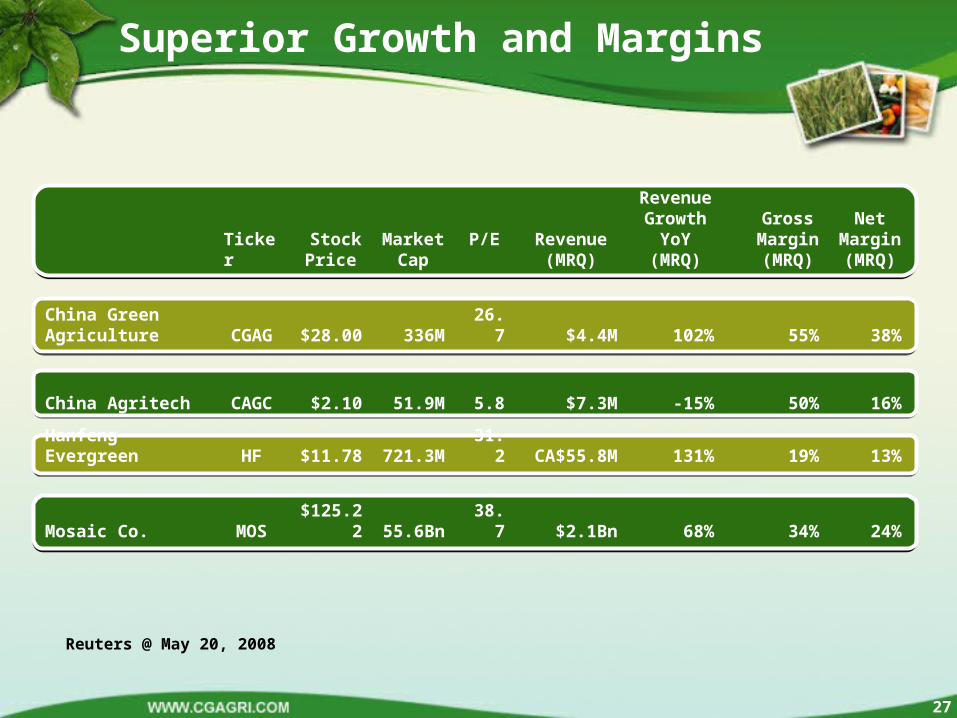
Superior Growth and Margins
Reuters @ May 20, 2008
Ticker Stock Price
Market Cap
P/E Revenue (MRQ)
Revenue Growth
YoY (MRQ)
Gross Margin (MRQ)
Net Margin (MRQ)
China Green Agriculture CGAG $28.00 336M 26.7 $4.4M 102% 55% 38%
China Agritech CAGC $2.10 51.9M 5.8 $7.3M -15% 50% 16%
Hanfeng Evergreen HF $11.78 721.3M 31.2 CA$55.8M 131% 19% 13%
Mosaic Co. MOS $125.22 55.6Bn 38.7 $2.1Bn 68% 34% 24%

28
Investment Summary
High growth: 55% increase in net income in first half FY 2008 58% increase in sales revenue in first half FY 2008 Currently near full production capacity
Strong distribution and high degree of brand recognition Distribution across 27 provinces in China Extensive network of 450 wholesalers 10 regional offices
Significant opportunity for growth in fertilizer industry Increasing market share ~ 80% YoY Fragmented but consolidating, 36 billion dollar industry.
Strong R&D and production base Hi-tech production methods Quick and efficient product development cycle
Strong Management Decades of combined experience in sales, fertilizer, ecology and agriculture

29
Contact Information
CCG Elite Investor Relations
Mr. Crocker Coulson
1325 Avenue of the Americas, Suite 2800
New York, NY 10019
T: (646) 213-1915
Email: [email protected]
Auditor:
Kabani & Company, Inc
Certified Public Accountants
6033 West Century Blvd.
Suite 810, Los Angeles
CA 90045
China Green Agriculture, Inc
Mr. Tao Li
Chief Executive Officer
Tel: +86-29-8826-6386
Email: [email protected]
Legal Counsel:
Darren L. Ofsink, LLC
600 Madison Avenue, 14th Floor
New York, NY 10022
T: 212-371-8008