1 irrigation efficiency webinar september 23, 2014 ron rose energy efficiency consultant nebraska...
TRANSCRIPT

1
Irrigation Efficiency WebinarSeptember 23, 2014
Ron RoseEnergy Efficiency ConsultantNebraska Public Power District

What We Will Cover Today
• NPPD Irrigation Load Management
• NPPD EnergyWise Pump Efficiency Program
• Leveraging the USDA RD REAP program
• NPPD Irrigation – PV Solar pilot project

Irrigation Connected Load at Busbar (MW)
42,000 Irrigation Accounts System-Wide in 2013
775 793 811 821 830 838 862 899 939 952 987 1,022
1,067 1,132
1,212 1,284
1,380 1,462
1,562 1,637 1,686
1,713 1,838
1,936
0
200
400
600
800
1,000
1,200
1,400
1,600
1,800
2,000
2,200
1990 1992 1994 1996 1998 2000 2002 2004 2006 2008 2010 2012
MW
Irrigation Connected Load at Busbar (MW)

72.6%
74.1%74.6%
73.2%
70.5%
74.7%75.3%
76.4%
79.0%
80.1%80.5%81.4%
76.4%
81.2%
82.6%82.6%
85.0%84.7%
86.0%86.7%
87.0%
89.1%
82.0%
77.7%
60%
64%
68%
72%
76%
80%
84%
88%
92%
1990 1992 1994 1996 1998 2000 2002 2004 2006 2008 2010 2012
Sh
are
of
Co
nn
ecte
d L
oad
Share of Irrigation kW in Load Management

System-Wide On-Peak Peaks
217
252
13
69
123
231213
281
344
300329
401
366 372 383
489
560
515
576
441
502
597
647
573
0
50
100
150
200
250
300
350
400
450
500
550
600
650
700
1990 1992 1994 1996 1998 2000 2002 2004 2006 2008 2010 2012
MW
@ B
us
ba
r
Effective Irrigation Load Controlled Off at the time of NPPD's Busbar Billable Peak Hour

6
360
321
120161
288
429
390 380 380
334
427405
437
480
442
492 475
429446 447
472522
774
679
050
100150200250300350400450500550600650700750800850
1990 1992 1994 1996 1998 2000 2002 2004 2006 2008 2010 2012
MW
@ B
usb
arIrrigation Contribution to Busbar Billable Peak

Pump Efficiency Program

Why Energy Efficiency is important• Helps consumers control cost of energy
• Reduces peak demands and/or energy usage Delays need for additional generation Reduces purchased energy costs
• State Statute (Section 66-1060) requires integrated resource planning (IRP) Evaluate full range of alternatives, including energy
efficiency and conservation Helps position utility with regulators and other
stakeholders when new generation resources are needed in the future

Number of low pressure
conversions 29%
Number of pump opportunities,
39%
Number of Efficient
Systems, 32%
Irrigation Efficiency Opportunities
Combined Summary

Common opportunities◦ High to low pressure conversions, center pivot◦ Gated Pipe to center pivot or Sub-Surface Drip conversion◦ Wrong pump installed for current irrigation system
Choke valve installed? Application?◦ Pump is old and wore out, needs rebuilt◦ Variable Frequency Drive
Field elevation or pumping water level changes Swing arm and/or endgun Different irrigation system types on same pump Multiple systems on one pump
◦ Soil Moisture sensors
EnergyWise Irrigation Efficiency

0.0
5.0
10.0
15.0
20.0
25.0
30.0
35.0
1 4 7 10 13 16 19 22 25 28 31 34 37 40 43 46 49 52 55 58 61 64 67 70 73
Ye
ars
Pump Tests sorted by ascending payback period
2006 2007
Simple Paybacks from Energy Savings

EnergyWise Costs • All programs are cost justified from a generation
avoidance perspective. The savings result from reduced incremental fuel and purchased energy costs.
• NPPD’s average near-term savings (avoided costs) are greater than the program costs:
Est. Savings Estimated
(Avoided Costs) Program Costs Irrigation ~$0.037-0.015/kWh ~ $0.02/kWh

What Program Provides
◦ Up to $350 for Pre-Improvement Efficiency Test◦ Incentive of $0.20 per kWh saved on annual basis◦ Verified efficiency improvements◦ Energy savings and lower electrical costs for
years to come!
EnergyWise Irrigation Efficiency

Incentive calculation example
Current energy demand = 56 kW (75 H.P.) New energy demand - 36 KW (48 H.P.) demand reduction 20 KW
annual operating hours = 500
incentive = 20 kW x 500 hrs. x $0.20/kWh = $2,000

System Modifications and Post-pump efficiency test are completed within one year
Electrical Utility will provide incentive amount by check or billing credit
Provides Grants & Loan Guarantees for:
Renewable Energy Projects
and
Energy Efficiency Projects
What is the Section 9007 Program?

grants guaranteed loans2005 37 recipients of 148 nationwide $418,348
2006 151 recipients of 375 nationwide $2,332,310
2007 102 recipients of 345 nationwide $1,002,797
2008 154 recipients of 639 nationwide $1,586,622 $163,368
2009 89 recipients of 599 nationwide $1,504,038 $2,704,419
2010 156 recipients of 650 nationwide $2,834,914 $3,031,260
2011 24 recipients of 430 nationwide $215,305 $20,900
2012 31 recipients of 694 nationwide $365,591 $54,700
2013 102 recipients of 1055 nationwide $1,725,677 $83,350
$12,477,451 $6,058,017
Renewable Energy Systems andEnergy Efficiency Improvements
Program
Nebraska applications since 2005

NPPD 25kW PV Solar Pilot Project
Solar Heat & Electric
Frisch Electric

Goals:
Install net-metered PV Solar with 60 HP or larger irrigation motor and a center pivot.
Learn how PV Solar interacts with a 480/277V 3PH irrigation service
Provide technical assistance to customers through experience gained from the pilot project
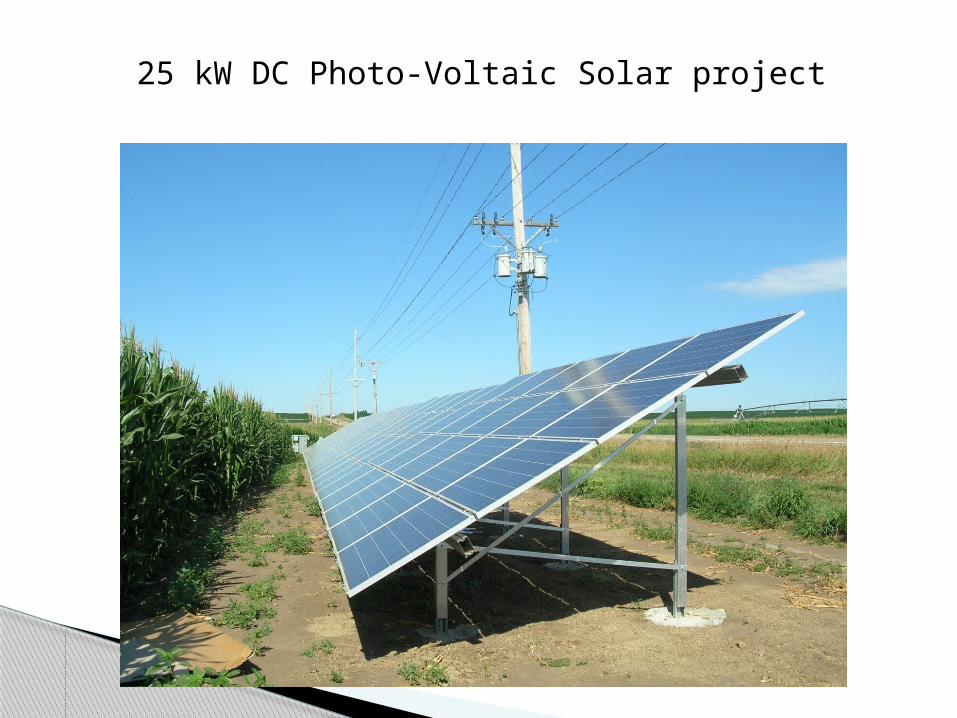
25 kW DC Photo-Voltaic Solar project

Two 12.5 kW inverters

Forecasted vs Actual Monthly Energy Generation (kWh) ~40,000 kWh/year
Aug-13 Sep-13 Oct-13 Nov-13 Dec-13 Jan-14 Feb-14 Mar-14 Apr-14 May-14 Jun-14 Jul-140.0
500.0
1000.0
1500.0
2000.0
2500.0
3000.0
3500.0
4000.0
4500.0
actual kWh projected kWh

Lessons Learned: load control switch interference
Cannon Technologies : power line carrier system
Preseason load control switch testing failed due to PV solar inverter noise interference
Solution: capacitor across the switch

Summer: Replacing Energy at $0.0715/kWh (When irrigating)
Selling NEG (Net Excess Generation) at $0.0960/kWh (Not irrigating)
Winter: Selling NEG at $0.0551/kWh (Not Irrigating)
Economics

Simple Payback
25 kW PV Solar Simple Payback financial calculations
Effective cost Simple Payback Years
Total Project Cost $70,030 $70,030 18.2Federal Tax credits (30%) $21,009 $49,021 13.6
USDA REAP grant (25%) $17,508 $31,514 10.0
Notes:
Federal Tax Credit assumes tax liability
USDA REAP grant uncertain, depends on scoring and available funding
Does not include: Insurance, personal property tax, depreciation or O&M
Assumes irrigation rate increases 3% per year and solar panel degradation 0.8% per year
Does not include cost of borrowing money

PV Solar Market Penetration vs. PV Solar price

Questions:Go to www.nppd.com for additional information
or contact:
Ron Rose, Energy Efficiency Consultant
(402) 362–7326 [email protected]