1. introduction - university of toledo · web viewjosh quinlan colin serne joe wcislak abstract the...
TRANSCRIPT

University of Toledo Carbon Footprint: Scope 3 Emissions
May 6, 2010
Group Members:Kathleen Gallagher
Neale MahonJosh QuinlanColin SerneJoe Wcislak

Abstract
The goal of this study was to determine the carbon footprint of the University of Toledo’s Main Campus for Scope 3 emissions. Scope 3 emissions are optional emissions that are subjective to Universities. The University of Toledo decided to include emissions from commuting, sports and study abroad transportation, wastewater, solid waste, and paper. These emissions are either upstream or downstream emissions. The upstream emissions occur before the product or service is on campus. These upstream emissions include; commuting, sports travel, study abroad travel, and paper. The downstream emissions occur after use on campus. These emissions occur at a plant or landfill after the university uses the product. These downstream emissions include; wastewater and solid waste use. Scope 3 also includes offsets that the University of Toledo would purchase. However, there were minimal offsets purchased for the main campus.
These emissions were all converted into equivalent carbon dioxide. The amount of carbon dioxide, methane, and nitrous oxide were found for each emission and then converted to metric tons of equivalent carbon dioxide. The amount of equivalent carbon dioxide was used to find the carbon footprint of scope 3 emissions for the University of Toledo.
After the footprint was figured, the results were compared to another comparable institution’s results. Since scope 3 emissions are very subjective to each university, the competing school’s numbers were a little different from the University of Toledo’s scope 3 emissions. Using the results we found from this study, suggestions were able to be made to improve our main campus’s environmental impact and lower the carbon footprint of the University of Toledo.
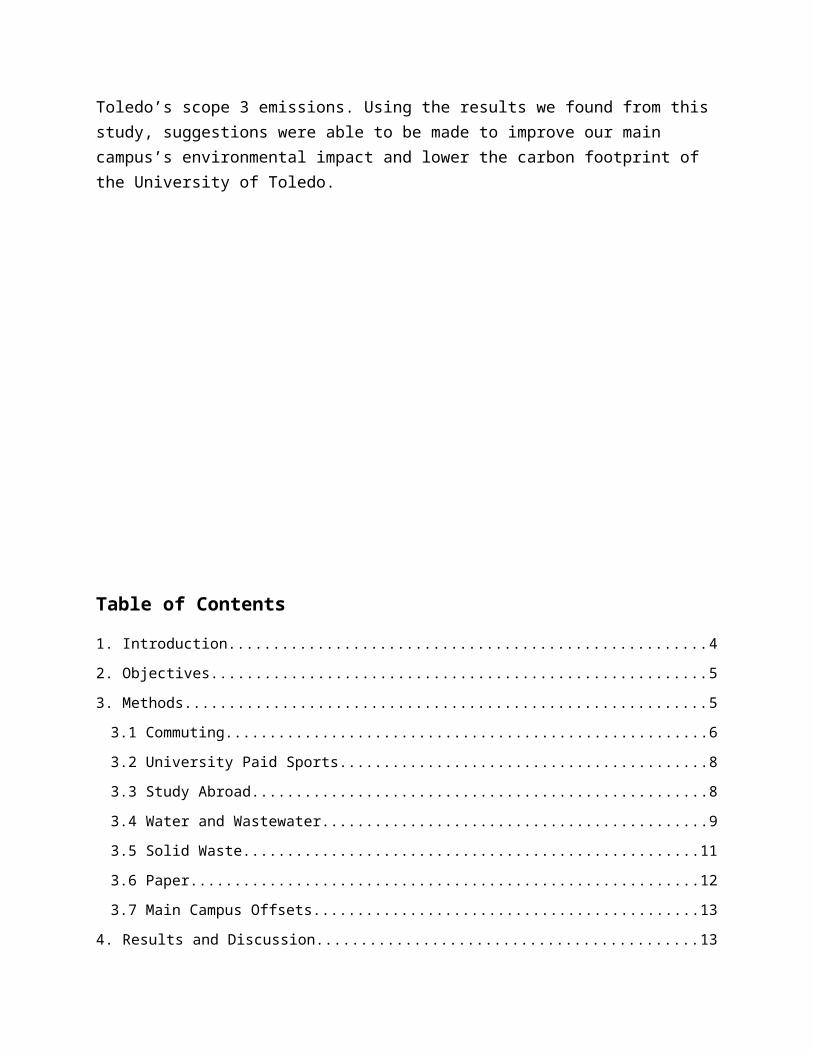
Table of Contents
1. Introduction.............................................................................................................................................4
2. Objectives................................................................................................................................................5
3. Methods...................................................................................................................................................5
3.1 Commuting........................................................................................................................................6
3.2 University Paid Sports.......................................................................................................................8
3.3 Study Abroad.....................................................................................................................................8
3.4 Water and Wastewater.......................................................................................................................9
3.5 Solid Waste......................................................................................................................................11
3.6 Paper................................................................................................................................................12
3.7 Main Campus Offsets......................................................................................................................13
4. Results and Discussion..........................................................................................................................13
4.1 Commuting......................................................................................................................................13
4.2 University Paid Sports.....................................................................................................................15
4.3 Study Abroad...................................................................................................................................16
4.4 Water and Wastewater.....................................................................................................................16
4.5 Solid Waste......................................................................................................................................17
4.6 Paper................................................................................................................................................18
4.7 Main Campus Offsets......................................................................................................................19
5. Scope 3 Total Carbon Emissions...........................................................................................................19
6. University of Toledo versus Ohio University Scope 3 Comparison......................................................20
7. Conclusions...........................................................................................................................................20
8. Suggestions............................................................................................................................................20
9. References.............................................................................................................................................20
10. Acknowledgements.............................................................................................................................21
11. Appendices..........................................................................................................................................21
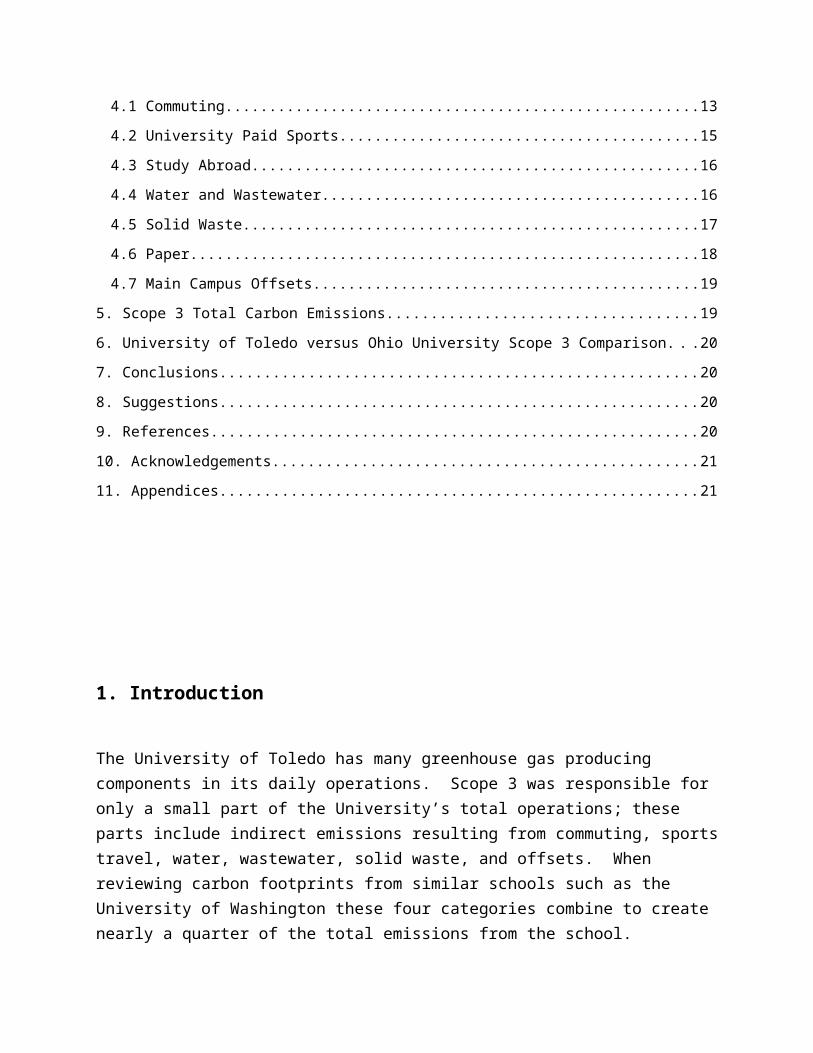
1. Introduction
The University of Toledo has many greenhouse gas producing components in its daily operations. Scope 3 was responsible for only a small part of the University’s total operations; these parts include indirect emissions resulting from commuting, sports travel, water, wastewater, solid waste, and offsets. When reviewing carbon footprints from similar schools such as the University of Washington these four categories combine to create nearly a quarter of the total emissions from the school.
Commuting is a large contributor to green house gas production. The University has a large portion of its students who drive to campus every day to attend class and a very little amount who take public transportation. Along with students driving to class faculty and staff also commute varying distances to come to the university to work. With all of these vehicles traveling to and from school everyday thousands of tons of greenhouse gases are produced.
The University has many varsity sports that it sponsors. When these sports teams travel to other schools to participate in matches and tournaments the school has to pay for their travel. This travel reaches all over the country from the west coast to the eastern coast. This travel, whether it is by a bus, train or airplane creates large amounts of greenhouse gases. The school also sponsors the travel of students and faculty to study abroad. Studying abroad incorporates traveling long distances, commonly requiring traveling by flight.
Toledo uses large amounts of clean drinking water for its bathrooms, sinks and other operations; this water is than commonly turned into waste water. Water and wastewater treatment requires large amounts of energy. Along with this water use the university also produces large amounts of solid waste from its dining halls and general garbage cans found throughout the campus. Disposal and treatment of solid waste, much like the treatment of water requires large amounts of energy and in turn creates large amounts of greenhouse gases.
Paper is a viable source in the learning process. Without paper one would not be able to write or read as freewill as it is. Paper use at a university for printing of tests, assignments, handouts and syllabi are just a few examples of the vast amounts of paper used. Paper production is an energy hungry process and this energy use results in greenhouse gas emissions if energy is produced from fossil fuels.
Finally, the University does have some processes in place to create greenhouse gas offsets. These offsets are used to counter the amount of greenhouse gas the University creates.

2. Objectives
The goal of this study was to determine the carbon footprint of the University of Toledo’s Main Campus for Scope 3 emissions. In order to compare Toledo’s campus to other campus’s carbon footprints, the units of: commuting, sports travel, water, wastewater, paper, and offsets had to be equal. The common unit used to compare the effect is carbon dioxide equivalent. This process has been established by Clean Air – Cool Planet in order to help Universities document, understand, project, and reduce their campus greenhouse gas footprint. Once carbon footprint was estimated, we also made projections for the future and some recommendations in order to reduce the carbon footprint associated with Scope 3 emissions.
3. Methods
The collection of the data seemed very daunting at first however with help from Harvey Vershum, Director of Energy Management, many contacts were established and the process could progress. In order to contact the necessary people the work load was divided amongst the group: Neale Mahon and Colin Serne were responsible for commuting, the largest data collection; Joe Wcislak was responsible for University paid sports and the study abroad program; Kathleen Gallagher was responsible for water, wastewater, and solid waste; and Josh Quinlan was responsible for paper and University offsets. A summary of data collected and departments contacted in order to provide the data is shown in Table 1.
Table 1: Contact Information
Type of data Provided by Person that provided the data
Number of parking permits ID Card & Parking Services Manager
David Wahr, ID Card & Parking Services Manager for University of Toledo
Frequency of TARTA stops on campus & miles traveled
TARTA Marketing Steve Atkinson, Marketing Director for Toledo Area Regional Transit Authority
Sports Teams miles traveled to away events
Athletic Department Shelly Lawniczak, Sports Department Secretary
Study Abroad miles traveled Study Abroad Department Fran Molnar, Study Abroad

Department Secretary
Potable Water Usage Facilities Planning/Bay View WWTP
Danieal Klett, Director of Facilities Planning
Solid Waste Transported to Landfill
Building Services and Recycling
Dan Royer, Building Services and Recycling & Arlene Fell, Director of Environmental Resources
Pounds of paper per year Building Services Dan Royer, Building Services and Recycling
Offsets N/A Not able to acquire data
In order to convert the data into equivalent values, the use of a Carbon Calculator (Clean 2008) was used. The equations modeled in the below subsections are how the Carbon Calculator converts the inputted data numbers into the equivalent carbon dioxide values necessary for the Green House Gas Inventory.
3.1 Commuting
Commuting is a large player in the role of greenhouse gas production. The University of Toledo has a large percentage of its student population that lives off of campus and commutes to class on a daily basis. Along with this student commuting is the commuting done by the faculty and staff of the university.
To determine this commuting it was determined that the number of commuters would need to be known. The University distributes parking passes to all of these commuters to keep track of who is allowed to park where and where not. The number of passes was obtained from David Wahr, the Director of Student Affairs, Auxiliary services, (Table 2). Based on these passes it was determined just how many students, faculty, and staff commute to the school on a given day. Due to privacy issues the mailing locations of all parking pass holders were not permitted to be given. Assuming a rough sample of miles driven for each parking genre and averaging these we estimated how many miles of travel each group generates, (Table 2), (Table 3).
Table 2: Number of Passes
Fall 2009 Passes issued Spring 2010 Passes Totals

issuedStaff 1245 1273 2518
Commuter 9096 8099 17195Residents 893 917 1810
Freshmen Residents 1044 507 1551Freshmen Commuters 2010 1156 3166
Totals 13911 11574 26240
Table 3: Average Miles per Day
Average Miles round trip
Fall 2009 Registered Drivers
Total Miles per day
Faculty/Staff 35 2,518 88,130Commuter 17 20,361 346,137Residents On Campus On Campus On Campus
Table 4: Miles per Year
Total Miles per day
Trips to campus per week
Weeks visiting campus per year
Total miles per year
Faculty/Staff 88,130 5 40 17,626,000Commuter 346,137 4.5 36 560,741,94Residents On Campus On Campus On Campus On Campus
Using the excel sheet we could plug in our values and determine how much greenhouse gas was being generated due to the schools commuting population and the use of public transportation.
Also, included in the commuting value was the data from public transportation. The University of Toledo has public bussing provided by the Toledo Area Regional Transit Authority (TARTA) that transports students to and from campus. TARTA was contacted and the data provided is displayed in Table 4.
Table 5: Public Transportation
2007 2008 2009Stops made on
campus42,100 35,185 23,555
Average Riders 4.5 4.5 4.5Route Miles 23 23 23

3.2 University Paid Sports
In order to discover how many miles were traveled by the sports teams and study abroad program, the two departments were contacted first. The sports department informed where the team’s schedules where located online. An excel spreadsheet could then be made of the locations of each sports yearly schedule and destinations. This included the number of trips to each location for the years of interest. The sports department could not give a definite answer for the cut off between driving and flying; there are heads for each sport that make that determination, and no definitive cutoff is used. Therefore, a 500 mile cutoff was used for the spreadsheet, over 500 miles we used flight, and under we applied to bussing. The mileage was found from Toledo to the destination city, multiplied that number by the number of trips made to that city per year for all sports reporting, and then multiplied that by two for the return trip. The miles were then added together to each city for the years of interest, for both the air travel and the driving individually, and these are the numbers we will use for the input on the carbon calculator, modeled by the following air and bus travel equations. The conversions modeled by the calculator are displayed in Equation 1.
Input(miles)*0.00394MMBtu
Short Tons×19.33 Tg C
QBtu109 kg
TgQBtu
109 MMBtu× 99 %×
44 gCO2
12 gC∗2.8=kgCO2+ Input (miles)*
0.000261 Kg CH 4gal
0.135 MMBTUgal
× 0.00394 MMBTUPASS . MILE
=KG CH 4 +
Input (miles)×0.00394 MMBTU
mile× gal
0.135 MMBTU× 0.0003 KG N 2O
gal=KG N 2 O]/ 1000
(Equation 1)
3.3 Study Abroad
The travel abroad department of the University was contacted several times with no return calls, nor anyplace to find the data needed. With a little help, the travel abroad department did reply to an e-mail, and found some data that was needed. They provided the countries to which students travelled to for study abroad, however the specific cities were not included, therefore the capital cities of the countries were used. With these cities the miles traveled could be found to figure the

mileage traveled per year. These are the figures used for the input on the carbon calculator. The conversions modeled by the calculator are displayed in Equation 2.
[Input(miles)*
39.67 MPGpass mile
∗19.95
Tg CQ BTU
∗109 kg
Tg∗Q BTU
109 MM BTU∗0.138 MM BTU
Gal .∗72.367 Kg CO2
MM BTU
+
Input(miles)*39.67MPGPASS
∗0.000567 Kg CH 4Gal
∗0.000014292 Kg CH 4Miles
∗input ( milesMPG )=KgCH 4
+ Input(miles)*0.000006478Kg N 2O
Mile∗39.67 MPG
Pass .∗0.000275 Kg N 2O
Gal .∗input miles
MPG=Kg N 2O] / 1000 (Equation 2)
3.4 Water and Wastewater
In order to collect the wastewater information needed for this study of the University of Toledo’s campus carbon footprint, Danieal Klett, Director of Facilities Planning, sent a data file of the main campus’s usage of potable water.
The data collected for potable wastewater usage is given in cubic feet for each fiscal year. These values need to be converted into gallons in order to use the campus carbon calculator. After finding the total amount of potable wastewater used on the University of Toledo’s main campus, the ratio of aerobic, anaerobic, and anaerobic digesters that the Toledo Wastewater Treatment Plant uses to treat the wastewater was found by emailing the wastewater treatment plant. This breakup was then used to calculate what percent of the potable water that was used by the main campus was treated aerobically, aerobically, and by anaerobic digesters. These were then entered into the campus carbon calculator, which used the equations discussed below to give us the campus carbon footprint.
To calculate the campus carbon footprint the carbon dioxide (CO2) equivalence needs to be computed from the emissions of the central treatment plant. The central treatment plant for this study was the Toledo Wastewater Treatment Plant. This is the treatment plant where all the potable water is transported from the university. The total amount of CH4 and N2O needs to be calculated and totaled.
The amount of CH4 and N2O was calculated for aerobic, anaerobic, and anaerobic digesters. The constants found in Table 4 are multiplied by the gallons of wastewater found for the data presented to me by Danieal Klett.
Table 6: Wastewater Constants

Calculate
Process Constant Source
CH4 aerobic 0 kgCH4/gal (0.0007 kg BOD/ gal ww)(% accidental anaerobic degradation)(1 - % BOD removed by primary treatment)(0.18 kg CH4/kg BOD)<www.epa.gov/climate change/emissions/usinventoryreport.html>Draft Inventory of U.S. Greenhouse Gas Emissions and Sinks: 1990-2000 (February 2008); section 8.2 pg. 8-13 – 8-14
Anaerobic 0.000336 kgCH4/gal
0.007 kg BOD/ gal ww)(1 - % BOD removed by primary treatment)(0.48 kg CH4/kg BOD)<www.epa.gov/climate change/emissions/usinventoryreport.html>Draft Inventory of U.S. Greenhouse Gas Emissions and Sinks: 1990-2000 (February 2008); section 8.2 pg. 8-13 – 8-14
Anaerobic Digestors
1.121847 x 10⁻⁶ kgCH4/gal
(0.000283168 m3 gas/gal ww)(0.4303 kg CH4/m3 gas)(99% combusted)<www.epa.gov/climate change/emissions/usinventoryreport.html>Draft Inventory of U.S. Greenhouse Gas Emissions and Sinks: 1990-2000 (February 2008); section 8.2 pg. 8-13 – 8-14
N2O Aerobic 0.00000163 kgN2O/gal
<www.epa.gov/climate change/emissions/usinventoryreport.html>Draft Inventory of U.S. Greenhouse Gas Emissions and Sinks: 1990-2000 (February 2008); section 8.2 pg. 8-13 – 8-14
Anaerobic 0.00000163 kgN2O/gal
<www.epa.gov/climate change/emissions/usinventoryreport.html>Draft Inventory of U.S. Greenhouse Gas Emissions and Sinks: 1990-2000 (February 2008); section 8.2 pg. 8-13 – 8-14
Anaerobic Digestors
0.00000163 kgN2O/gal
<www.epa.gov/climate change/emissions/usinventoryreport.html>Draft Inventory of U.S. Greenhouse Gas Emissions and Sinks: 1990-2000 (February 2008); section 8.2 pg. 8-13 – 8-14
After both CH4 and N2O are calculated for each of the three processes, add the values together for each emission, respectively and then use the equation:

eCO 2=[(Sum of CH 4) (23
100 yrs .)+(Sumof N2O )(296100 yrs)]
1000 to find the carbon
dioxide equivalence (eCO2). This equation uses the sum of the two emissions produced from
Toledo’s wastewater treatment plant calculated and then multiplying those totals by the
characterization factor for both CH4 (23) and N2O (296), respectively. These two products are
then added together and the sum is divided by one thousand to get the global warming potential
expressed in metric tons of eCO2. This eCO2 value can then be used to determine and predict
The University of Toledo’s campus carbon footprint.
3.5 Solid Waste
In order to calculate the CO2 equivalence (eCO2) for solid waste, the amount of waste incinerated and landfilled needs to be determined. We assume the University of Toledo does not incinerate any waste. If incinerated waste was taken into account then it would be calculated by summing the amount of mass burning times its corresponding constant found in Table 7 and the amount of Refuse Derived Fuel (RFD) times is corresponding constant found in Table 7.
Table 7: Solid Waste Constants
Calculate
Process Constant Source
CO2 Mass Burning
-110 kgCO2/short ton (−0.03
MTCE CO2
short ton )( 44 )
(12 ) (1000 )RDF -36.67 kgCO2/short
tonCH4 Recovery 47.14285714
kgCH4/ short ton [ (0 .27MTCECO2
short ton) (44 )
(12 ) (1000 ) ]21

Recovery and Flaring
12.22222222 kgCH4/short ton [ (0 .07
MTCECO 2
short ton) (44 )
(12 ) (1000 ) ]21<http://www.epa.gov/epaoswer/non-hw/muncpl/ghg/greengas.pdf>EPA, 2002
Recovery and Electric Generation
6.984126984 kgCH4/short ton [ (0 . 04
MTCE CO2
short ton )( 44 )
(12 ) (1000 ) ]21
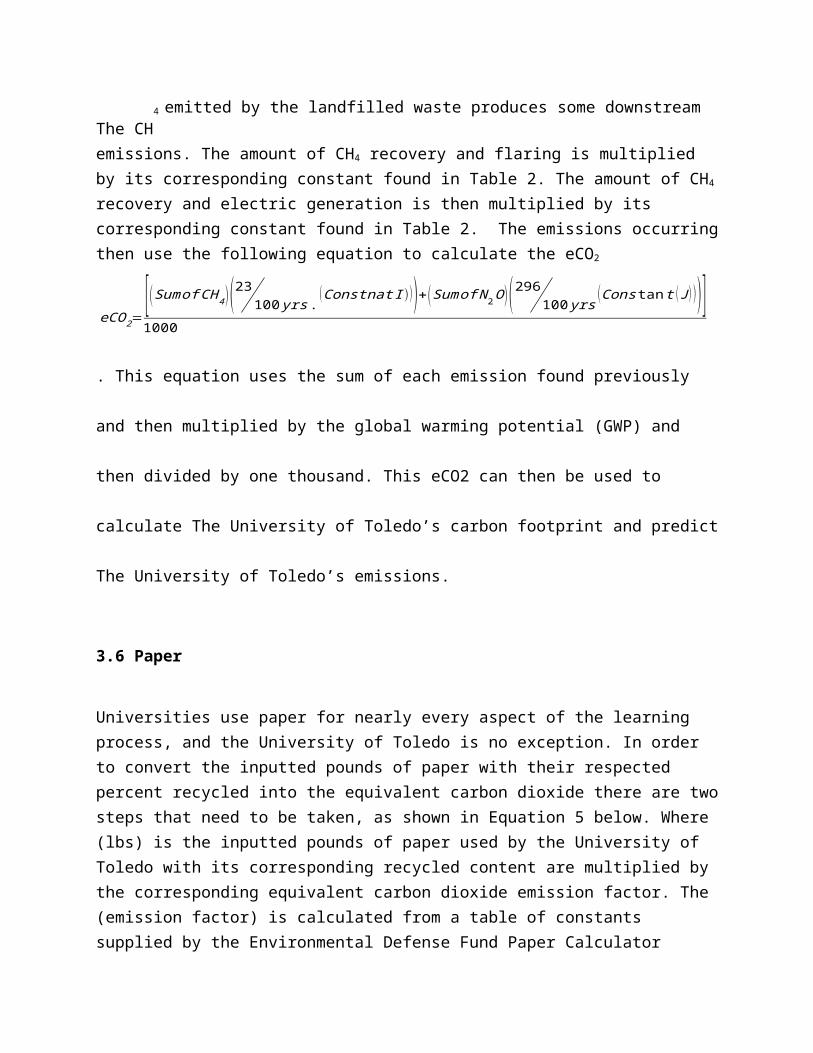
The CH4 emitted by the landfilled waste produces some downstream emissions. The amount of
CH4 recovery and flaring is multiplied by its corresponding constant found in Table 2. The amount of CH4 recovery and electric generation is then multiplied by its corresponding constant found in Table 2. The emissions occurring then use the following equation to calculate the eCO2
eCO 2=[(Sum of CH 4) (23
100 yrs . (Constnat I )))+(Sumof N2O ) (296100 yrs
(Cons tan t (J ) ))]1000
.
This equation uses the sum of each emission found previously and then multiplied by the global
warming potential (GWP) and then divided by one thousand. This eCO2 can then be used to
calculate The University of Toledo’s carbon footprint and predict The University of Toledo’s
emissions.
3.6 Paper
Universities use paper for nearly every aspect of the learning process, and the University of Toledo is no exception. In order to convert the inputted pounds of paper with their respected percent recycled into the equivalent carbon dioxide there are two steps that need to be taken, as shown in Equation 5 below. Where (lbs) is the inputted pounds of paper used by the University

of Toledo with its corresponding recycled content are multiplied by the corresponding equivalent carbon dioxide emission factor. The (emission factor) is calculated from a table of constants supplied by the Environmental Defense Fund Paper Calculator (EDFPC) (Paper 2007). The table lists every type of paper, from uncoated freesheet to paperboard coated recycled. The pounds of paper are converted to metric tons and multiplied by the correct emission factor and Equation 5 can be formed.
eCO 2=[ (lbs )∗(emmissionfactor )∗(1 ton )]2000lbs
(Equation 5)
Where,
lbs = input of pounds of paper used by University
emission factor = constant provided by EDFPC
The pounds of paper was found by contacting the accounts payable department and the only
types of paper that the University uses are corrugated unbleached and uncoated freesheat, which
are cardboard and copypaper respectively.
3.7 Main Campus Offsets
University offsets also play a big role in the greenhouse gas inventory, but in a different way,
they give back to the environment. The University of Toledo currently is implementing many
offsets; however, these offsets are not on main campus and therefore will not be included in the
greenhouse gas inventory. The conversion of the offsets is very straightforward due to the input

already being in equivalent carbon dioxide. There are only two offsets that need to be converted
including composting and green electric certificates. These two offsets, labeled as (MTeCO2),
only need to be multiplied by a constant, labeled as (emissionfactor) in the below equation.
These emission factors are provided by the EPA (Solid 2007).
eCO 2=( MTeCO 2)∗(emissionfactor ) (Equation 6)
Where,
MTeCO2 = Composting or Green Electric Certificates provided by University
Emission factor = constant provided by EPA (Solid 2007)
The constant within the file is provided by the Solid Waste Management And Greenhouse Gases:
A Life-Cycle Assessment of Emissions and Sinks published by the Environmental Protection
Agency (EPA) (Solid 2010).
4. Results and Discussion
The results of Scope 3 include the raw data that was collected from the four different aspects as well as the equivalent carbon dioxide calculated by using the Carbon Calculator (Clean 2008).
4.1 Commuting
To determine the greenhouse gases produced by the commuting of students, faculty and staff to and from the campus in their personal cars, carpooling or on a TARTA bus, a lot of broad information needed to be collected. This information collection began with contacting the department in charge of distributing parking passes. This department was Student Affairs, and David Wahr was the Director who helped with supplying some of the needed information. Student Affairs keeps track of how many parking passes are issued, who they are issued to, and what relation they have with the school, (Table 2). Due to privacy issues names and home addresses were not permitted to be supplied, if this information was supplied the average

distance from the home to the university could have been calculated for a much more accurate distance. Instead of using this exact average of miles traveled, a rough estimate was assigned to the different categories of parking passes, (Table 3).
The current populations of active full time students, active part time students, faculty and staff can be found in Table 8.
Table 8
EnrolledActive Full Time Students 25280Active Part Time 7214Faculty 1679Staff 4900
In calculating of total students driving, freshmen residents were not included in student population because they are not permitted to park on campus, (Table 9). The percentage of Students, Staff and Faculty carpooling can be found in Table 10. These numbers were used from research done by other campuses similar to Toledo who have already completed their Carbon Footprints.
Table 9: Total number of students and students driving
Total Students Driving, non Freshmen residents 12,018Total Students 25,280
Table 10: Percentages of students and Staff/Faculty carpooling
% Students Carpooling 5%%Staff/Faculty Carpooling 3%
The number of trips to the campus per week, how many weeks per year, and how many miles per trip all needed to be known to calculate the total miles driven to campus per year, they can all be found in Table 11. An estimate of the average miles driven to the campus by students was calculated as 17 miles round trip. The estimate for faculty and staff miles driven was 35.
Table 11
Total Miles per day
Trips to campus per week
Weeks visiting campus per year
Total miles per year
Faculty/Staff 88,130 5 40 17,626,000Commuter 346,137 4.5 36 560,741,94Residents On Campus On Campus On Campus On Campus

Along with private travel to and from the school there is public bussing that stops at the university to drop off and pick up people. This travel was also considered in the data. To find out about this travel the bussing company TARTA was contacted and asked about how many and how often busses stop at the school, and with a rough estimate of how many passengers were entering and exiting the busses at these stops. Trips per week were calculated by dividing the stops recorded by TARTA by the number of weeks in a year. Miles per year was calculated by multiplying the trips per week by the number of school weeks by the miles per round trip. (Table 12)
Table 12: Bussing miles
Stops made on Campus
% Riding Bus
Trips per week
Weeks per year
Miles per trip
Miles per year
2006 46,280 3% 890 36 23 736,9202007 42,100 3% 810 36 23 670,6802008 35,185 3% 677 36 23 560,5562009 23,555 3% 453 36 23 375,084
4.2 University Paid Sports
The paid sports travel numbers were separated by a 500 mile barrier. Over 500 miles was considered air travel by the team, and less than 500 miles was considered to be ground transportation. These numbers were applied to the appropriate column in the excel spreadsheet to find the carbon content portion of the university footprint. These numbers can be found in Table 14.
Table 13: Students Sports Travel
Air Travel Miles Bus Travel Miles2007 78,360 58,5202008 70,640 55,0282009 57,356 55,100
4.3 Study Abroad
To determine the greenhouse gases produced by travel that is either directly or indirectly funded by the University of Toledo information was collected from Fran Molnar in the study abroad department. These numbers were separated into two categories, air travel and ground travel. All
miles produced by the travel abroad program were indirectly funded by the University, and were applied to the air travel category. These miles were paid for by the student themselves. (Table 13)
Table 14: Study Abroad Air miles
Air miles2007 1,435,1122008 1,298,4082009 353,078
The information for the year 2009 was incomplete, only accounting for half of the year at time of publication.
4.4 Water and Wastewater
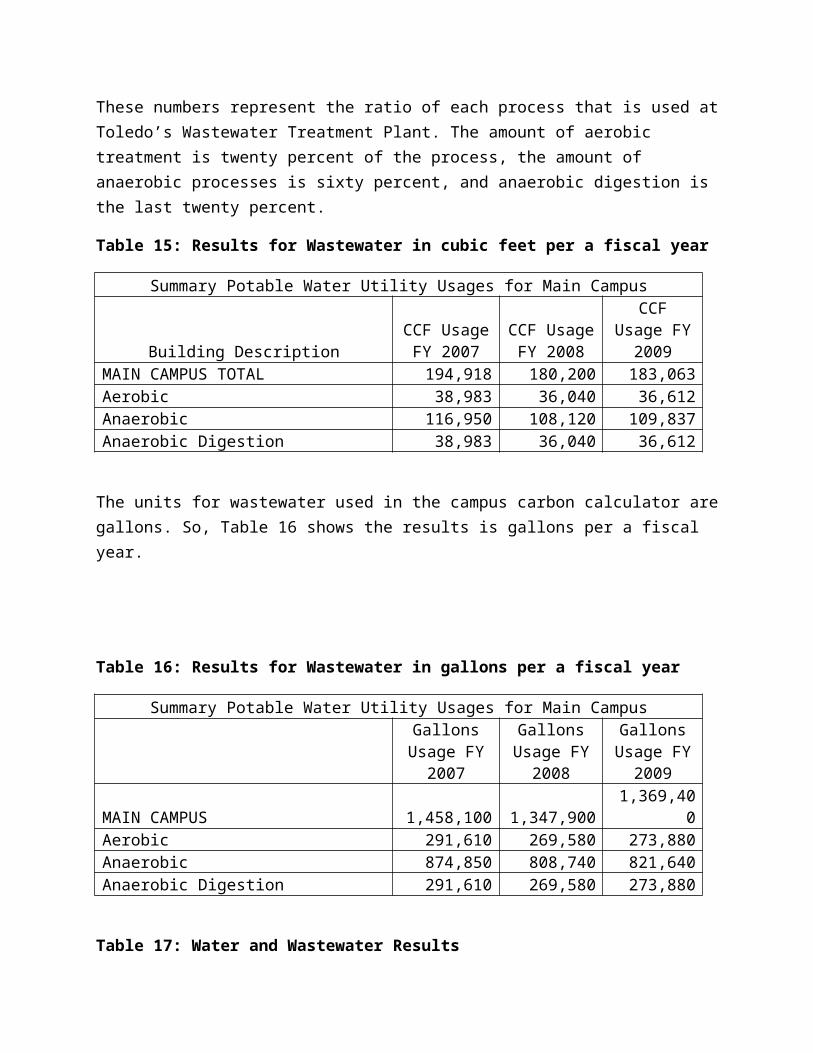
The amount of wastewater used in a fiscal year by the main campus is shown in Table 15. Each process represents a portion of the total wastewater used by The University of Toledo main campus. These numbers represent the ratio of each process that is used at Toledo’s Wastewater Treatment Plant. The amount of aerobic treatment is twenty percent of the process, the amount of anaerobic processes is sixty percent, and anaerobic digestion is the last twenty percent.
Table 15: Results for Wastewater in cubic feet per a fiscal year
Summary Potable Water Utility Usages for Main Campus
Building DescriptionCCF Usage
FY 2007CCF Usage
FY 2008CCF Usage
FY 2009MAIN CAMPUS TOTAL 194,918 180,200 183,063Aerobic 38,983 36,040 36,612Anaerobic 116,950 108,120 109,837Anaerobic Digestion 38,983 36,040 36,612
The units for wastewater used in the campus carbon calculator are gallons. So, Table 16 shows the results is gallons per a fiscal year.
Table 16: Results for Wastewater in gallons per a fiscal year

Summary Potable Water Utility Usages for Main CampusGallons
Usage FY 2007
Gallons Usage FY
2008
Gallons Usage FY
2009MAIN CAMPUS 1,458,100 1,347,900 1,369,400Aerobic 291,610 269,580 273,880Anaerobic 874,850 808,740 821,640Anaerobic Digestion 291,610 269,580 273,880
Table 17: Water and Wastewater Results
Equivalent Carbon Dioxide (eCO2)2007 7.52008 6.92009 7.0
4.5 Solid Waste
The amount of solid waste produced by The University of Toledo’s main campus was found only as an average in the volume produced for a year, found on the website <http://www.environmentalistseveryday.org/publications-solid-waste-industry-research/faq/municipal-solid-waste.php> that one cubic yd (yd3) of solid waste is between one hundred and 200 hundred pounds before compacted. So, to convert the volume of solid waste produced by main campus to weight, 150 pounds per an yd3 of waste as an estimate for the total solid waste weight. From, Toledo’s Waste Management Landfill, the amount of waste going through one of the three processes was found by using the ratio of each process and finding the total amount of the university’s waste that goes through one of these processes. The amount of CH4 recovery is about sixty percent of the gas emitted by the landfill. The amount of CH4 Recovery and Flaring is about thirty percent of the gas recovered and about ten percent of that is recovered for electric generation.
Table 18: Annual Volume of Major Solid Wastes
Volume of Solid WastesYd3/year Weight (lbs)/year Weight (short tons)/
yearTotal 1123.1 168,465 84.2
Table 19: Solid Waste Results

Equivalent Carbon Dioxide (eCO2)2007 1,217.22008 1,217.22009 1,217.2
4.6 Paper
The data needed for the paper’s effects on the Universities Green House Gases was daunting. There were thirteen different types of papers and also the percent recycled for each of the types that the Campus Carbon Calculator (Clean 2008) uses in order to calculate the green house gases. In order to contact the correct person for the data needed, I first contacted the secretary of the Civil Engineering Department and she forwarded the information to the accounts payable department. Within the accounts payable department there are many contacts and with the help from Aaron Baker, I was put in contact with the Director of Purchasing, Jennifer Pastorek. Jennifer was finally able to put me in contact with Dan Royer, Manager of Building Services and Recycling. Dan was able to acquire the data needed and forwarded the paper weights to me. The data received is displayed in Table 12.
Table 12
Paper Uncoated Freesheet Corrugated UnbleachedPercent Recycled 50 502007 Weight (lbs) 509760 1829782008 Weight (lbs) 573772 2991422009 Weight (lbs) 654852 438778
The data in Table 12 was the raw data collected from the Universities usuage of uncoated freesheet, copy paper, and corrugated unbleached, cardboard. The values were collected for the 2007, 2008, and 2009 fiscal years. The values in Table 12 were inputted into the Carbon Calculator (Clean 2008) and then the equivalent carbon dioxide values could be calculated. The equivalent carbon dioxide values are shown in Table 13.
Table 13

Equivalent Carbon Dioxide (eCO2)2007 723.12008 909.22009 1137.2
4.7 Main Campus Offsets
The University offsets were handled a little differently. Harvey Vershum, Director of Energy Management, was able to inform me of the Energy Manager that is in charge of the offsets at the University. After many attempts to contact the Energy Manager, the data was deemed not as important as the other data. The main reason this information was deemed not as important was the University has many offsets that have been implemented within the last year; however, these offsets are not located on main campus.
5. Scope 3 Total Carbon Emissions
The total equivalent carbon dioxide was calculated using the Carbon Calculator. The totals were taking and made into a graph to be easily displayed in Graph 1.
Graph 1: Scope 3 Total Equivalent Carbon Dioxide
As the graph displays, over the three fiscal years the Scope 3 emissions remained relatively the same. Also, as expected with the University of Toledo being a large commuter based campus, the commuting totals are the greatest equivalent carbon dioxide emissions.

6. University of Toledo versus Ohio University Scope 3 Comparison
In order to ensure accuracy of the data collected, the final data numbers were compared to a comparable school, for this study Ohio University was chosen. The 2009 fiscal year was the only year compared and the results are shown in Graph 2.
Graph 2: Comparison to Ohio University
0
5,000
10,000
15,000
20,000
25,000
MTeCO2
Ohio University University of Toledo
Paper
Wastewater
Solid Waste
Air Travel
Sports Travel(Bus)Commuting
Graph 2 shows the comparison between the two Universities. OU and UT are very comparable with the total equivalent carbon dioxide values. However, this data is very subjective. The data included in our Scope 3 included paper, wasterwater, and sports travel by bus, whereas Ohio University did not include this data in their Scope 3. Comparing the two totals, UT has a very high commuting emission as opposed to OU. This higher commuting value is to be expected with Toledo being a very large commuter base. The air travel from Ohio is also very high, which is unknown to the root of this high emission.
7. Conclusions
There are many theories of how to reduce greenhouse gases in the future. There are some ideas that are not very convincing and others that are being implanted already today. However, in order to determine the difference that can be made in the future of reducing greenhouse gas

emissions, the current effect must be measured. The greenhouse gas inventory is a starting block for companies, universities, or even towns or cities to measure their carbon footprint and make a plan to reduce their impact on future generations.
8. Suggestions
In order to reduce carbon emissions, there are many suggestions that could be utilized in order to reduce the emissions. There are many emissions specifically for Scope 3 emissions that can be reduced as well. Some suggestions that could reduce emissions are to: create incentives for carpooling and good gas mileage when commuting; time classes closer together, therefore commuters do not need to go back and forth throughout the day; have more advertisement for recycling throughout campus or incentives for recycling; have more opportunities for public transportation like a rail system; group sports teams to travel to the same site, for example have boy’s and girl’s double headers so they can travel together; the University can look into harvesting rainwater and using it for toilets; and paper can be reduced by posting more things online and not have students print them out or just using laptops to take notes or follow presentations instead of writing everything down or printing power point slides.
9. References
Clean Air, Cool Planet. Campus Carbon Calculator. Rep. Clean Air Cool Planet Inc, 2008. Print.
"Paper Calculator." Environmental Defense Fund. 2007. Web. 7 Apr. 2010. <http://www.edf.org/papercalculator/>.
"Solid Waste Management and Greenhouse Gases." Solid Waste Management and Greenhouse Gases: A Life-Cycle Assessment of Emissions and Sinks. 22 Mar. 2010. Web. 7 Apr. 2010.
10. Acknowledgements
We acknowledge all of the people contacted, listed in the Scope 3 journal, for the intense work associated with collecting the data.
11. Appendices

Scope 3 Journal: Date - Contact Person - Information obtained
1-26-10 -- Phone call to Shelly Lawniczak, Sports Dept Secretary and received where to find sports schedules for traveling teams (Joe)
2-3-10 -- Email sent to Parking asking for a return of who to contact in the department and/or any information (Colin)
2-5-10 -- Email sent to Steve wise, Transportation asking for TARTA buss information. (Neale)
2-8-10 -- Email sent to Michael Green, Mech Eng/Energy Manager, about only Main Offsets (Josh)
2-8-10 -- Email sent to Arlene Fell, Director of Environmental Resources, asked for any information on solid waste data from her or someone she knew (Kathleen)
2-8-10 -- Email sent to Diana Raider, Analyst, asked for water and wastewater flowrate data (Kathleen)
2-10-10 -- Diana Raider, Financial Analyst, sent email back promising data for potable water usage and impervious surface area on main (Kathleen)
2-15-10 -- Danieal Klett, Director of Facilities Planning, gave data for potable water utility usage for main campus, uploaded into data files page (Kathleen)
2-17-10 -- Email sent to Katherine Powell, Civil Secretary, to determine contact in Accounts Payable for paper usage (Josh)
2-17-10 -- Email sent to Arlene Fell, Director of Environmental Resources, asking for information on solid waste (Kathleen)
2-17-10 -- Another email sent to Michael Green asking for Offsets (Josh)
2-17-10 -- Sent an email to [email protected] to ask if they could help, spent 4.5 hours on finding and colating the sports teams destinations (Joe)
2-18-10 -- Went to the parking offices and asked who I should talk to about getting information about how many passes are issued, received a name but he is not in today (Colin)
2-19-10 -- Emailed David Wahr, Director of student affairs asking for parking pass information (Colin)
2-22-10 -- Spoke to Tarta office on phone and emailed them for imformation. about how many Tarta buses come into Toledo every day (Neale)
3-2-10 -- Spoke to David Wahr, was given rough estimates of how many parking passes are issued, asked that I come back later this week, hopes to have ran reports with information I need (Colin)
3-02-10 -- Had a meeting with Dan Royer and Arlene Fell, have data on all recycling and waste generated by the university, however this information might be for all campuses, so still need to find just main campus (Kathleen)
3-25-10 -- Called Jennifer Pastorek, Director of Purchasing, on lead from Aaron Baker, she was out of the office today, left a voicemail (Josh)
3-29-10 -- Received information from David Wahr on parking passes issued this semester.
3-29-10 -- Received call from Jennifer Pastorek, Director of Purchasing, and sent an email of the paper data needed (Josh)
4-1-10 -- Received call from Dan Royer, Building Services and Recycling, for clarification of data available and data needed (Josh)
4-2-10 -- Received paper data from Dan Royer (Josh)