1 introduction - universitetet i oslo · compared to the current finnish tax system it has multiple...
TRANSCRIPT

Dual Income Taxation, Deductions and Income-Shifting
Olli Ropponen1
Abstract: This paper employs a simple framework to illustrate the sharp income-
shifting incentives observed in Finnish dual income tax system. Deductions are shown
to steepen these incentives and are therefore likely to increase tax compliance costs
and may cause unnecessary fluctuations between the state tax base and the tax bases
of municipalities. The deductions are also shown to exacerbate those cases where
poorer entrepreneurs have to pay higher taxes than better off entrepreneurs. The
observed negative features arising from inclusion of deductions into dual income tax
system could be reduced by a suitable tax reform. (JEL H2, H25, H3, H32)
Keywords: Dual income tax, Income-shifting, Tax Deductions
1 Introduction
Globalization has pushed forward numerous changes around the world. A com-
bination of an increase in both the international capital mobility and the role of
multinational companies (MNCs) in the global economy has placed countries
into more competitive environment than earlier. The use of active tax planning
strategies of MNCs has pushed also countries into harmful tax competition in
order to protect their tax bases (Fuest, Huber and Mintz 2005; Devereux and
1VATT Institute for Economic Research, P.O. Box 1279 (Arkadiankatu 7), FI-00101
Helsinki, Finland. Tel: +358 40 304 5514. Fax: +358 9 4780 2929. E-mail address:
1

Loretz 2013). To become better equipped against other countries’ tax changes
several countries have started to search for fundamental tax reforms that make
them capable to tax different income components separately.
The desire to choose more targeted tax treatments has supported a ten-
dency for countries to replace their global income tax (GIT) systems, where all
the income are taxed together, by the dual income tax (DIT) systems, where
capital income is taxed separately from other sources of income (Sørensen
1994; Nielsen and Sørensen 1997). The discussion about the relative merits
and the drawbacks of the DIT systems compared to GIT systems has been
already going on for a while. Numerous equity and efficiency arguments fa-
voring the DIT has been put forward. However, also some negative features
are observed. Especially the income-shifting between labor income and capital
income among self-employed has made their taxation difficult in the DIT sys-
tems (see Sørensen 1994; Boadway 2004; Sørensen 2005a,b; Pirttila and Selin
2011).
This paper provides new aspects for the ongoing discussion about the dual
income taxation. It first shows in a simple framework that a DIT system com-
bined with a single (EITC-like) deduction provides an entrepreneur with sharp
and complicated income-shifting incentives, which are likely to increase the tax
compliance costs and to make the tax bases of the state and the municipalities
to fluctuate. Second, it shows that within this framework poorer entrepreneurs
may end up paying higher taxes than better off entrepreneurs.
In a DIT system an entrepreneur chooses between two types of income and
his tax-bill is determined according to both the capital income tax rate and the
tax rate for other income. His wage is considered as a remuneration for the labor
2

input and taxed according to earned income tax schedule, whereas the dividend
is considered as a remuneration for capital input and taxed according to capital
income tax rate. These two types of income provide some clear incentives for
an entrepreneur. Very high earned income tax rates are likely to take the choice
between wage and dividends towards dividends and the other way around for
low earned income tax rates. Because of the multiple remuneration types, both
income tax schedules matter for an entrepreneur reporting behavior and his
tax-bill in a DIT system. Therefore, compared to a pure wage-earner or an
investor, an entrepreneur has also an additional opportunity to affect his tax-
bill by choosing the relative levels of different remuneration types.
Despite some of its drawbacks and motivated by its relative merits, several
countries have replaced their GIT systems by the DIT systems. While Nordic
countries (except Iceland) were among the first ones to implement this reform,
it has been considered as an interesting option and worthwhile to being im-
plemented also in several other countries. (Schratzenstaller 2004; Spenger and
Wiegard 2004; Eggert and Genser 2005; Keuschnigg and Dietz 2007; Kleinbard
2010)
After the first implementations also some improvements to the basic DIT
system have been introduced. A good example of such improvement is a Nor-
wegian reform in 2006, which resulted in multiple new neutrality properties
(neutrality with respect to investment, financing and realization decisions)
into their tax system (see Sørensen 2005a). Some further improvements for
the tax system were suggested in Sørensen (2005b). The cornerstones of this
proposal are the rate-of-return allowance (RRA) and the full carry forward
for the unutilized RRA. This model taxes imputed normal return to shares
3

(determined via RRA) as capital income and above-normal returns as labor
income. Compared to the current Finnish tax system it has multiple advan-
tages. One major advantage is that the income-shifting incentive is reduced in
this system.
The paper proceeds as follows. The follow-up section reviews the related
literature. Section 3 introduces a framework employed in the paper and derives
its properties by providing both analytical and numerical results for it. Section
4 discusses the similarities between the framework and the Finnish tax system.
Section 5 employs Finnish administrative data to provide empirical evidence
on entrepreneur behavior. Finally, section 6 concludes.
4

2 Literature
A DIT system combines a flat rate (or just slightly progressive) capital income
tax with a progressive income tax schedule for other sources of income. Unlike
in a GIT system, the tax rate for capital income may thus differ from the tax
rate for other sources of income in a DIT system.
For a pure wage-earner the level of capital income tax does not matter
much in a DIT system2 as his income is automatically considered as earned
income and therefore his taxes are determined according to the earned income
tax schedule (τW ). A pure investor is not directly affected by earned income
taxation as his compensation is considered as capital income and is thus taxed
according to the capital income tax rate (τD). Thus the relative levels of the
two types of income taxes do neither matter much for a wage-earner nor an
investor tax-bill. For an entrepreneur the situation is very different.
The discussion on the DIT systems has been very active since the 1990s.
In his pioneering paper Sørensen (1994) provides a profound discussion on the
most relevant issues related to DIT systems. It also discusses about the rel-
ative merits of these systems compared to GIT systems, where both capital
income and earned income are first aggregated and then taxed with a single
progressive tax schedule. Both theoretical (equity and efficiency) arguments
and practical reasons are provided. The equity arguments for the dual income
tax systems include reduction of the horizontal discrimination (according to
life-cycle differences), reduction of tax favoritism towards human capital in-
2The level of capital income tax does not matter for wage-earner directly, but might
matter indirectly due to substitutability of different taxes. With a given total tax revenue,
the level of earned income tax is likely to be higher the lower the level of capital income tax.
5
vestment compared to other investments and reduction in problem of taxing
nominal rather than real income (inflation). The efficiency arguments for the
DIT systems include the notions that the capital is likely to be more flexible
than labor supply and that the DIT system reduces the disincentives to save.
However, taxing of self-employed is considered as the ’Achilles heel’ of the
DIT system, because compared to GIT systems, the DIT systems provide new
room for tax avoidance via income-shifting from high-tax labor income (wage)
to low-tax capital income (dividends).
Nielsen and Sørensen (1997) study the DIT and contrast it with the GIT.
They show formally that the DIT can be given rationality on pure efficiency
grounds. Especially, via reducing the distortionary effects of progressive capital
income taxation on the GIT systems. They also show that the tax favoritism
towards investment in human capital, compared to other investment in the
GIT systems, is offset by a DIT system.
In addition to the theoretical studies also empirical studies on the DIT sys-
tems exist. The choice between company owner’s wage and dividends is studied
especially in Nordic countries. Fjærli and Lund (2001) study empirically this
issue in the Norwegian DIT system. They employ micro data and show that
in line with the incentives provided by the tax system the choice of a type
of payout from corporations to owners is strongly motivated by taxes. They
also find that social security benefits drive the division between wage and divi-
dends. The wage may be paid in order to receive social security benefits even if
it may not be tax-optimal. Alstadsæter and Jacob (2013) study this question
with the Swedish data and find that closely held corporations are in many cases
utilized in income-shifting to reduce tax burden. They also emphasize that the
6
conditions for the tax avoidance seems to require in addition to the incentive
to avoid taxes, also the access to income-shifting channel and the awareness of
the tax rules. Le Maire and Schjerning (2013) employ the Danish data and find
evidence of income-shifting among the self-employed. Pirttila and Selin (2011)
study the effects of Finnish tax reform, where a GIT was replaced by a DIT.
They find that the reform, which decreased the capital income tax rates, re-
sulted in a small positive impact on the overall taxable income. They also show
that self-employed substantially increased their capital income. This suggests
that the positive response was probably partly offset by ”Achilles’ heel of dual
income tax”, income-shifting among self-employed. Harju and Matikka (2014)
employ a dividend tax change to study income-shifting among the privately
held businesses in Finland. They find active income-shifting behavior between
tax bases and a positive relation between the tax incentives and the size of
response.
Motivated by the problems of present tax systems also multiple other than
Nordic countries have put DIT systems in top of their lists of candidates for
the tax reform. Spengel and Wiegard (2004) discuss problems observed in
German corporate tax system. They conclude that their tax system should
be simplified and made more neutral (w.r.t. investment decisions, financial
decisions and choice of legal form) and its tax rates should be reduced. They
conclude that the tax rate reductions are considered to be of most importance
among mobile tax bases, which are prone to international tax competition.
To tackle the observed problems they consider DIT and flat tax as leading
candidates for the German tax reform. Keuschnigg and Dietz (2007) propose
a tax reform (allowance for corporate equity combined with broad flat tax on
7
personal capital income), with neutrality properties with respect to investment,
firm financial decision and organizational form. By suitably chosen tax rates
it also prevents income-shifting from labor to capital income. Their simulation
results suggest that the reform could add to GNP by 4-5 percent in the long-
run in Switzerland. Eggert and Gensen (2005) study the implemented dual
income tax structures. They conclude that it is not a simple task to implement
separate taxation on capital and labor, yet there is (not much or) little pressure
towards reintroducing a comprehensive income tax system. They consider an
easy implementation of corporate income taxation (CIT) and personal income
taxation (PIT) as one major advantage of DIT. They also conclude that the
separate tax base for capital income allows countries to coordinate without
them losing the sovereignty of choosing the labor income tax rates.
The Nordic DIT system is largely motivated by addressing (both admin-
istrative and economic) problems in comprehensive income taxation as there
seem to be little justification for taxing capital income at the same rate as
labor income (Boadway 2004). Capital income taxation could also be coordi-
nated (without a necessity to coordinate labor income simultaneously) if all
nations (or e.g. all EU countries) adopted this system. Schratzenstaller (2004)
surveys income tax designs of 15 EU member states, 10 central and east Euro-
pean accessions, US, Japan and Switzerland and finds a clear tendency away
from comprehensive income tax systems and towards systems like DIT. She,
however, argues that it is debatable whether this evolution is good, that is
whether the pros of these changes are bigger than their cons. As a positive
feature of these systems she concludes that the aim to reduce international
capital flight seems to be well-founded among European countries. Sandmo
8
(2005) takes a different point of view into discussion about the DIT systems
as he reviews the reasons for inequality growth in the OECD area. Regarding
taxation he concludes that the expenditure tax may be better than DIT, both
on efficiency point of view and redistribution point of view. Kleinbard (2010)
considers the Nordic implementations as large scale experiments that provide
evidence supporting the implementability of the DIT system also in US. He
considers that especially due to the pressure to reduce the most important
component of the capital income taxation, the corporate tax rate, the US has
little choice but to embrace a DIT system.
Norwegian DIT reform in 2006, which moved the tax burden away from
normal returns and towards economic rents and risky returns to capital, en-
hanced a birth of a new branch for the DIT literature. Sørensen (2005a) de-
scribes in detail a design of Norwegian tax reform proposed to shareholder
income tax. He shows that the proposed new system is neutral with respect
to investment and financing decisions and decisions to realize capital gains.
Also income-shifting problem of the dual income tax system can be solved
with suitable tax rate choices in the new system. Sørensen continues to study
the issue in another paper (Sørensen 2005b), where he provides an overview
of the DIT and discusses alternative methods for taxing business income un-
der the DIT. He concludes that for non-listed companies the imputed normal
return should be taxed as capital income and above-normal returns should
be taxed by labor-income tax. Compared to Norwegian shareholder income
tax (in Sørensen 2005a), the proposed tax system requires less administrative
capacity (as it only relates to non-listed companies) and offers greater flexibil-
ity in choosing tax rate structure. Lindhe, Sodersten (2012) add to Sørensen
9

(2005a,b) by studying the proposed tax system in an open economy. They show
that in an open economy some distortions still appear also in a new system.
This paper contributes to the DIT literature in two ways. First, it shows
with a simple framework that a DIT system combined with deductions pro-
vides non-trivial and sharp income-shifting incentives, which are likely to in-
crease the costs of tax compliance and cause fluctuations between the state tax
base and the tax bases of municipalities. Second, this paper shows that the
DIT system makes poorer entrepreneurs to pay higher taxes than better off
entrepreneurs in some cases. The deductions are shown to increase this differ-
ence. This paper also contributes to an increasing bunching literature (see Saez
2010) by providing evidence that Finnish entrepreneurs do bunch according to
tax incentives provided by the tax system.
10

3 Entrepreneur Optimization Problem
3.1 Framework
In this paper we concentrate on a simple framework, which is illustrated in
figure 1.3 An entrepreneur is assumed to own a company with a pre-determined
pre-tax income of amount of Y . All of this company income is then distributed
to an entrepreneur as wage and dividends.4 An entrepreneur has one choice
variable: the amount his company pays to him as wage income, w (0 ≤ w ≤ Y ).
The rest of the pre-determined income, Y −w, will be paid as dividends. The
taxable wage income, which is taxed at rate τW , is derived by subtracting a
(single) deduction from the wage income. We assume there are no deductions
from the dividend and no other capital income from other sources. Thus the
paid dividend, Y − w, is also the taxable capital (dividend) income, which is
taxed at rate τD. The objective of an entrepreneur is to maximize his net-of-tax
income.5
The result of an optimization of an entrepreneur in our framework depends
3This framework captures some of the features in the Finnish DIT system and might
therefore be considered as a very stylized version of it, which abstracts from most of its
details. A more detailed structure of the taxation of an entrepreneur in a Finnish DIT
system is illustrated in figure 1 in Ropponen (2012). It also reveals the complicatedness of
the entrepreneur taxation. In this paper, the only margin an entrepreneur can react is the
choice between the wage and dividend (the reporting of the choice of split of the income).
In reality it is possible that the pre-tax income would depend on the whole tax system, but
it is abstracted here. Also the corporate income tax is abstracted in the framework.4Thus there are no retained earnings in our framework.5With fixed Y the maximization of net-of-tax income is equivalent to minimizing the sum
of taxes.
11

tax on wage tax on dividend
taxable wage taxable dividend
w(wage) Y−w(dividend)
Y(income)
D(deduction)
tW tD
Figure 1: Framework for stylized model
crucially on the tax rates (τW and τD) as well as the exact shape of the deduc-
tion in the earned income tax schedule. We consider throughout the paper a
single (EITC-like) deduction with its shape illustrated in figure 2.6 The amount
of the deduction in the stylized model is a function of wage income, D = D(w).
First, with low wage incomes there is a phase-in region, where the deduction
increases with a constant rate from zero to its maximum value Dmax as wage
6Earned Income Tax Credit (EITC), which is in use in U.S. and includes phase-in, plateau
and phase-out regions, serves as a known example of a credit of the similar type than the de-
duction employed in our framework. Similar deduction schemes are also in use in the Finnish
tax system (see e.g. figure 10 about a deduction of income from work [tyotulovahennys] in
Ropponen 2012).
12

Wage
Ded
uctio
nphase−in
plateau
phase−out
I II III IV
a b c d
0D
MA
X
Figure 2: Deductions and marginal tax rates for wage income in stylized model
changes from a7 to b. Second, from wage income b to c, there is a plateau,
where the deduction stays at its maximum value Dmax. Third, in the phase-
out region from wage income c to d the deduction decreases from its maximum
value to zero and stays zero thereafter.
3.2 Analysis
This subsection provides a theoretical analysis of the optimal choice between
wage and dividends in the stylized model described above. The following four
subsections provide reasoning for the optimal wage schedule as a function of
company income level, Y . The sections are divided according to income levels
that correspond to those in figure 2 (I-IV). The analysis is conducted under
7a is chosen to be 0.
13

the following assumption:
Assumption 1 tD > tW
Let us first consider the plausibility of assumption 1. Earned income, including
wage income, is typically taxed more heavily than dividends paid out of a
company. However, taking into account the corporate taxes that have already
been paid from the profits might make dividends more expensive than wage
for an entrepreneur owning a non-listed company of limited liability. As our
stylized model includes only a single tax rate (τD) for dividends, it is considered
to include both the corporate income taxation and the capital income taxation.
In Finland an entrepreneur, who owns a non-listed company with lim-
ited liability, first pays corporate income tax (tcorporate = 26% in year 2011;
tcorporate = 24.5% in year 2012) from the company profits. After the corpo-
rate tax, 70 percent8 of (those) dividends that (do not exceed a certain net
wealth related amount and) are paid out of the company are taxed accord-
ing to capital income tax rate (a flat rate of tcapital = 28% in 2011; a pro-
gressive capital income taxation in 2012 with rate tcapital = 30% up until 50
000e and 32% for the capital income that exceeds 50000e). The corporate
income tax and the capital income tax together sum up to single tax rates of
tD = 40.50% (= tcorporate +(1− tcorporate) ∗ 0.70 ∗ tcapital = 0.26+0.74*0.7*0.28)
in 2011 and tD = 40.36% (0.245+0.755*0.7*0.3) in 2012 (i.e. net-of-tax rates
8As long as dividends were below both a net wealth related amount and a given euro
amount, only 70 percent of dividends were taxable dividends in Finnish tax system. In
general, dividends are split into earned income and capital income according to a net wealth
of a company. In addition, capital income types are further split (and taxed differently)
according to whether they exceed a certain euro level or not.
14

are 59.50 and 59.64).9 These average rates correspond to wage income of 6
500e/month, whereas the average wage income in Finland was in 2010 just
over 3 000e/month. Therefore, the assumption that tD > tW seems plausible
for many entrepreneurs in Finland.
3.2.1 Phase-in Region (I)
Let us first consider a case, where a company income, Y , is between a and b.
Thus also the wage income remains between a and b (a ≤ w ≤ b) and therefore
in the phase-in region of the deduction (see figure 2).
If all the income were paid as dividends, the taxes would be tDY . The
slope of the deduction in the phase-in region is Dmax
b−a. Therefore, a one unit
increase of the wage income would both increase the wage tax by tW (1− Dmax
b−a)
and decrease dividend tax by tD. Because tD > tW , this increase in the wage
income decreases the total tax-bill by tD − tW (1 − Dmax
b−a) units. Because the
phase-in-region is linear, each additional one unit wage increase provides the
same decrease in the taxes as long as a ≤ Y ≤ b. Therefore, in the phase-in
region it is optimal for the entrepreneur to pay all its income as wage income. If
some units would have been paid as dividends, those units would be subject to
tax rate tD instead of tW (with tW < tD) and in addition part of the deduction
would be lost, compared to case where no dividends are paid.
3.2.2 Plateau Region (II)
Next we consider income levels, Y , which lie in between b and c. As shown
above none of the wage levels less than b can be optimal (because then one
9Here we have used 30% as capital income rate for year 2012.
15

would be able to reduce taxes by increasing the wage income up until b). If the
wage income is increased from b by one unit, the deduction remains the same
as long as the new wage level is at most c. A one unit increase would therefore
imply a tW unit increase in taxes on wage income and a tD unit decrease in
taxes on dividend income, resulting in a tD − tW unit reduction (tD > tW ) in
total taxes. Therefore, also in the plateau region it is optimal to pay all the
income as wage (wOPT = Y , for all Y ≤ c).10
3.2.3 Phase-out Region (III)
Let us next consider income levels c ≤ Y ≤ d. From the above we know that
wages less than c cannot be optimal. Let us thus consider what happens to
the total tax-bill when the wage is increased from c by one unit. Because the
slope of the phase-out region is Dmax
d−c, increasing wage income from c by one
unit increases taxable income by 1 + Dmax
d−cand therefore wage income tax by
tW (1 + Dmax
d−c). The decrease in the capital tax is tD. Now let us make the
following assumption:
Assumption 2 tD < tW (1 + Dmax
d−c).
Under this assumption11 a wage income increase would increase the total taxes
making wages above c but at most d, suboptimal. Therefore, under assumptions
1 and 2, wOPT = c for all c ≤ Y ≤ d. 12
10This will also be observed in figure 3 in section 3.3 (and in figures 5 and 7 in section 4),
where up until a company income level of c=35 000e all the income is paid as wage.11Combining assumptions 1 and 2 tells us that our results are valid for such dividend (plus
corporate) tax rates, tD, that are greater than that for wage income, tW , but with some
upper limit (which is determined via the slope of the phase-out region).12In figures 3, 5 and 7 this shows up as a flat part (no increase in the optimal wage
16
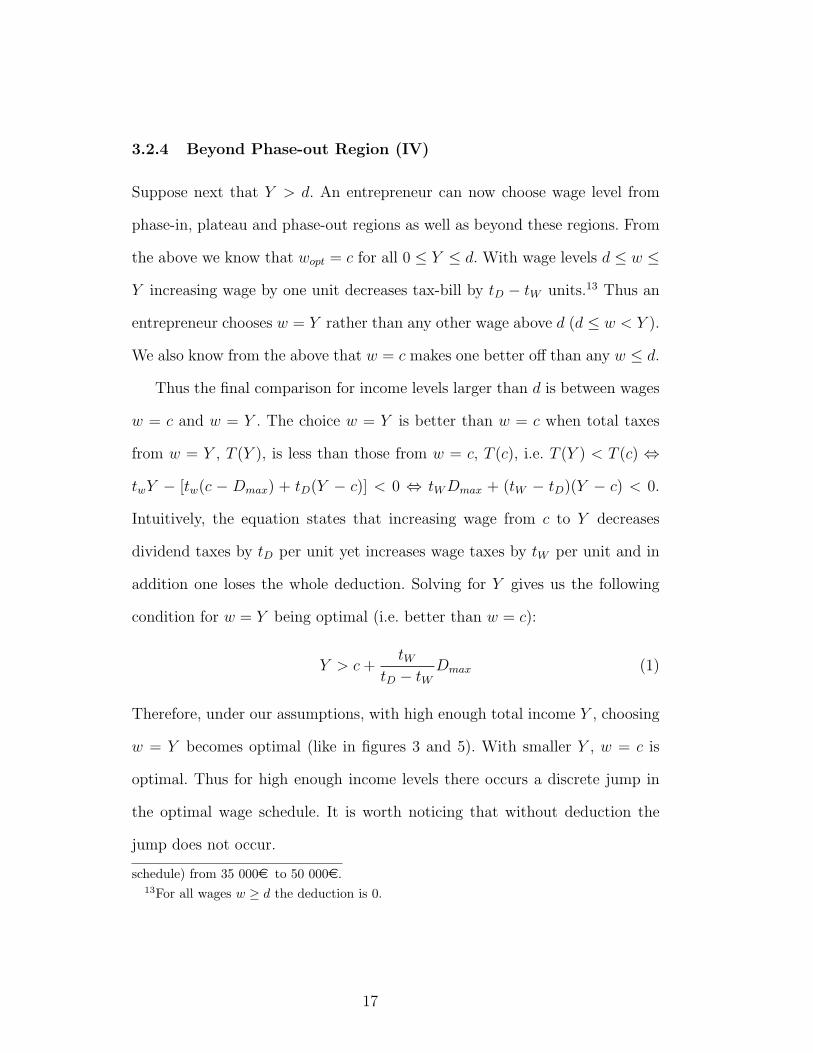
3.2.4 Beyond Phase-out Region (IV)
Suppose next that Y > d. An entrepreneur can now choose wage level from
phase-in, plateau and phase-out regions as well as beyond these regions. From
the above we know that wopt = c for all 0 ≤ Y ≤ d. With wage levels d ≤ w ≤
Y increasing wage by one unit decreases tax-bill by tD − tW units.13 Thus an
entrepreneur chooses w = Y rather than any other wage above d (d ≤ w < Y ).
We also know from the above that w = c makes one better off than any w ≤ d.
Thus the final comparison for income levels larger than d is between wages
w = c and w = Y . The choice w = Y is better than w = c when total taxes
from w = Y , T (Y ), is less than those from w = c, T (c), i.e. T (Y ) < T (c) ⇔
twY − [tw(c − Dmax) + tD(Y − c)] < 0 ⇔ tWDmax + (tW − tD)(Y − c) < 0.
Intuitively, the equation states that increasing wage from c to Y decreases
dividend taxes by tD per unit yet increases wage taxes by tW per unit and in
addition one loses the whole deduction. Solving for Y gives us the following
condition for w = Y being optimal (i.e. better than w = c):
Y > c+tW
tD − tWDmax (1)
Therefore, under our assumptions, with high enough total income Y , choosing
w = Y becomes optimal (like in figures 3 and 5). With smaller Y , w = c is
optimal. Thus for high enough income levels there occurs a discrete jump in
the optimal wage schedule. It is worth noticing that without deduction the
jump does not occur.
schedule) from 35 000e to 50 000e.13For all wages w ≥ d the deduction is 0.
17
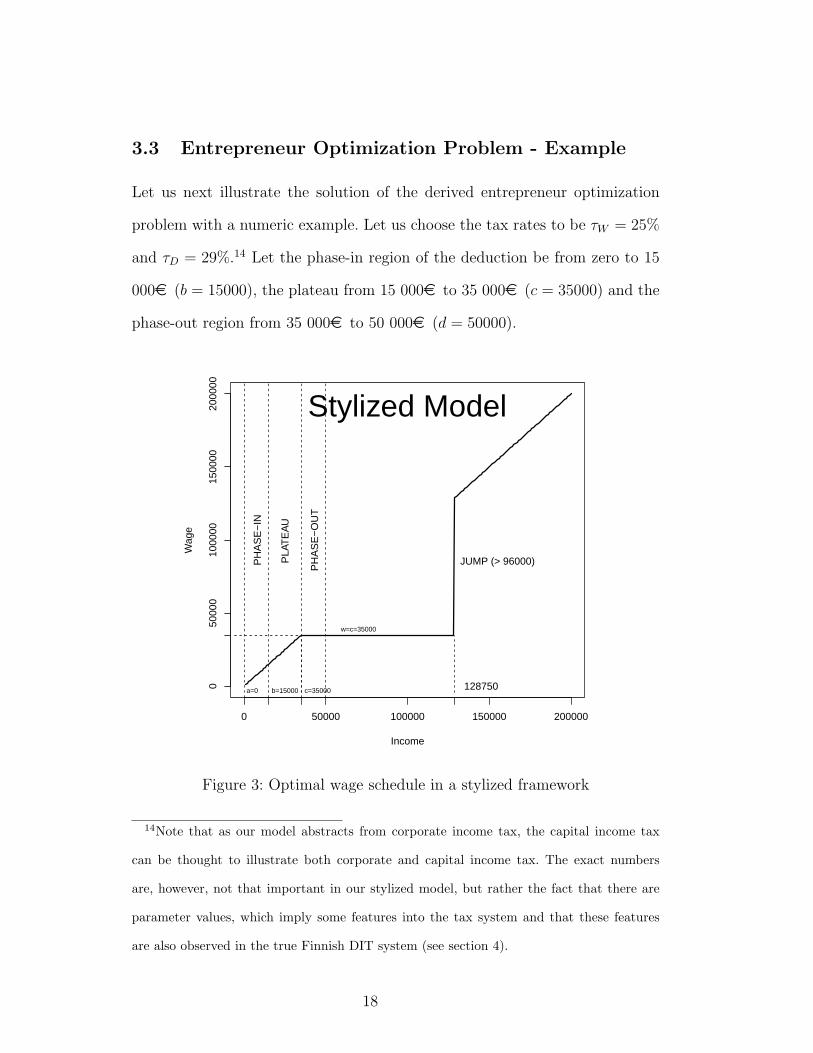
3.3 Entrepreneur Optimization Problem - Example
Let us next illustrate the solution of the derived entrepreneur optimization
problem with a numeric example. Let us choose the tax rates to be τW = 25%
and τD = 29%.14 Let the phase-in region of the deduction be from zero to 15
000e (b = 15000), the plateau from 15 000e to 35 000e (c = 35000) and the
phase-out region from 35 000e to 50 000e (d = 50000).
0 50000 100000 150000 200000
050
000
1000
0015
0000
2000
00
Income
Wag
e
128750
Stylized Model
c=35000b=15000a=0
PH
AS
E−
IN
PLA
TE
AU
PH
AS
E−
OU
T
JUMP (> 96000)
w=c=35000
Figure 3: Optimal wage schedule in a stylized framework
14Note that as our model abstracts from corporate income tax, the capital income tax
can be thought to illustrate both corporate and capital income tax. The exact numbers
are, however, not that important in our stylized model, but rather the fact that there are
parameter values, which imply some features into the tax system and that these features
are also observed in the true Finnish DIT system (see section 4).
18

The optimal wage schedule for an entrepreneur with the chosen parameter
values is given in figure 3. First note that with the above parameter choices
both assumption 1 and 2 hold. Thus, according to sections 3.2.1 and 3.2.2
all the income is paid as wage both in the phase-in region and in the plateau
region (up until income level of c = 35 000e in figure 3). In the phase-out region
(section 3.2.3 above) all the income is paid as dividends and thus the optimal
wage schedule stays flat at this region. Then finally, with high enough income
level (beyond the phase-out region, see section 3.2.4), it becomes optimal to
pay all the income as wage. With the chosen parameters the income level is
Y > c+ tWtD−tW
Dmax = 35000 + 0.250.29−0.25
∗ 15000 = 128750.
The most dramatic income-shifting incentive in this illustration occurs at
the income level of 128 750e. Here, a one unit increase in the income level
changes the optimal wage level from 35 000e to close to 130 000e. This is
a very large jump in the optimal wage schedule and is likely to have some
drawbacks. We will come back to these drawbacks in the next section.
19
4 Optimization in Finnish Tax System
The two following subsections provide illustrations of entrepreneur optimiza-
tion problem in Finnish tax systems in years 2011 and 2012. The similarities
of the optimal wage schedules between our stylized model and the true tax
systems are discussed.
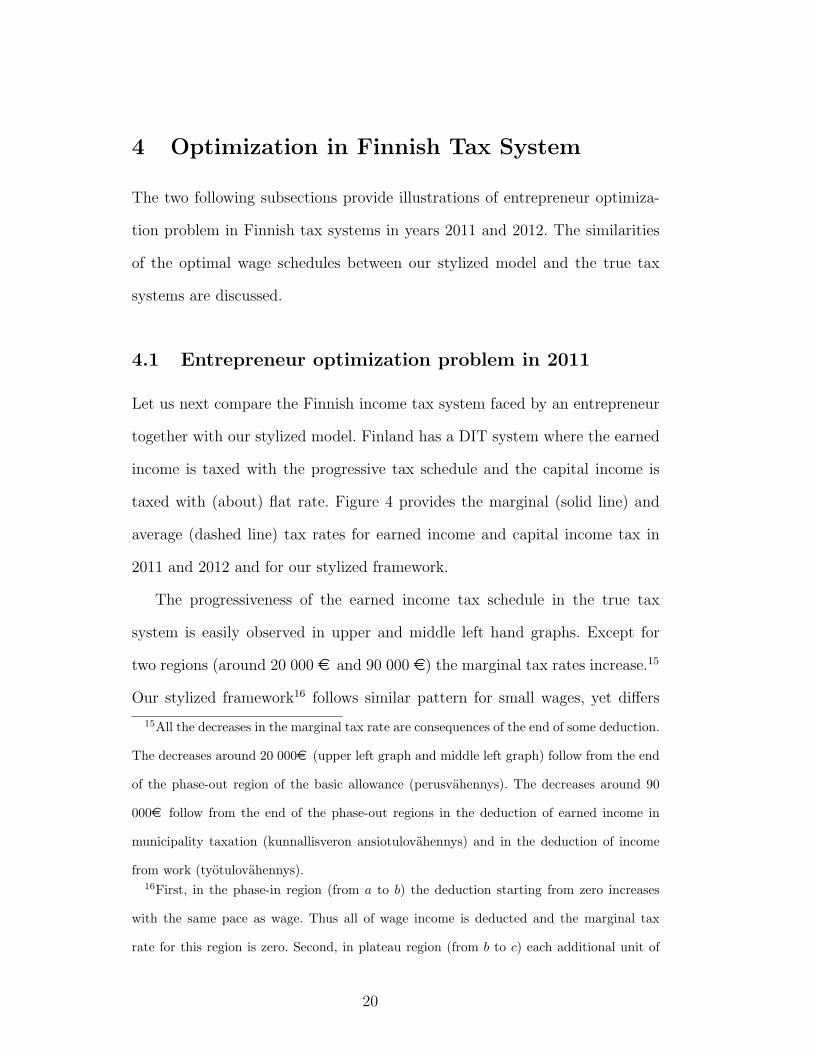
4.1 Entrepreneur optimization problem in 2011
Let us next compare the Finnish income tax system faced by an entrepreneur
together with our stylized model. Finland has a DIT system where the earned
income is taxed with the progressive tax schedule and the capital income is
taxed with (about) flat rate. Figure 4 provides the marginal (solid line) and
average (dashed line) tax rates for earned income and capital income tax in
2011 and 2012 and for our stylized framework.
The progressiveness of the earned income tax schedule in the true tax
system is easily observed in upper and middle left hand graphs. Except for
two regions (around 20 000 e and 90 000 e) the marginal tax rates increase.15
Our stylized framework16 follows similar pattern for small wages, yet differs
15All the decreases in the marginal tax rate are consequences of the end of some deduction.
The decreases around 20 000e (upper left graph and middle left graph) follow from the end
of the phase-out region of the basic allowance (perusvahennys). The decreases around 90
000e follow from the end of the phase-out regions in the deduction of earned income in
municipality taxation (kunnallisveron ansiotulovahennys) and in the deduction of income
from work (tyotulovahennys).16First, in the phase-in region (from a to b) the deduction starting from zero increases
with the same pace as wage. Thus all of wage income is deducted and the marginal tax
rate for this region is zero. Second, in plateau region (from b to c) each additional unit of
20

for bigger wages.17 The capital tax rate was 28 percent in year 2011. In 2012 it
was 30 percent up until 50 000e capital income and 32 percent for the excess
capital income. For our stylized model we choose a tax rate for earned income
to be 25 percent and 29 percent for capital income.18 The phase-in region for
the deduction is chosen to be from zero to 15 000e (b = 15000), plateau from
15 000e to 35 000e (c = 35000) and phase-out region from 35 000e to 50
000e (d = 50000).
Let us next turn to optimal wage schedule in the Finnish tax system. Figure
5 shows the optimal wage schedule of an entrepreneur in Finland in year 2011
(left graph) and in our stylized model (right graph). In more detail the left
graph describes the optimal wage schedule of a single owner of a non-listed
company with a given net wealth share of 50 000e and estimated entrepreneur
income of 50 000e19 in year 2011 in Finland (for details, also for the regimes
wage income is taxed with a given tax rate τW , which is thus also the marginal tax rate in
this region. Third, in the phase-out region (from c to d) an additional unit of wage income
increases taxable wage income by two units, because also the deduction is changed by one
unit. Thus the marginal tax rate is equal to two times the earned income tax rate (2τW ).
From earned income level d on there are no deductions and thus the marginal tax rate is
τW from this income level on.17As will be seen later, despite the simplicity of our framework, it is still capable for
providing similar features in optimal wage schedule than what is observed in the true tax
system.18Note that as our model abstracts from corporate income tax, the capital income tax
can be thought to illustrate both corporate and capital income tax. The exact numbers
are, however, not that important in our stylized model, but rather the fact that there are
parameter values, which imply problematic features into the tax system and that these
features are also observed in the true Finnish DIT system.19The pension payments and social security payments depend on the estimated en-
21
Earned Income (euro) Capital Income (euro)0.
00.
10.
20.
30.
40.
50.
6
Earned Income (euro)
Tax
rate
100 00080 00060 00040 00020 0000
2011
ATR
MTR
0.0
0.1
0.2
0.3
0.4
0.5
0.6
Capital Income (euro)Ta
x ra
te
0 20 000 40 000 60 000 80 000 100 000
2011
0.0
0.1
0.2
0.3
0.4
0.5
0.6
Earned Income (euro)
Tax
rate
100 00080 00060 00040 00020 0000
2012
ATR
MTR
0.0
0.1
0.2
0.3
0.4
0.5
0.6
Capital Income (euro)
Tax
rate
100 00080 00060 00040 00020 0000
2012
ATR
MTR
0.0
0.1
0.2
0.3
0.4
0.5
0.6
Earned Income (euro)
Tax
rate
0 20 000 40 000 60 000 80 000 100 000
Stylized Model
ATR
MTR
0.0
0.1
0.2
0.3
0.4
0.5
0.6
Capital Income (euro)
Tax
rate
0 20 000 40 000 60 000 80 000 100 000
Stylized Model
Figure 4: Marginal and average tax rates for earned income and capital income
in Finland in years 2011 and 2012 and in a stylized framework
22

A - E, see Ropponen 2012). The income is the gross income of a company
that is a sum of pre-tax profits and gross wages.20 The owner is assumed to
distribute all the company gross income between wage and dividend. We show
here only the optimal wage schedule as the corresponding optimal dividends
appear as residuals.
0 50000 100000 150000 200000
050
000
1000
0015
0000
2000
00
Income
Wag
e
upper bound for wage
optimal wage
32000 88000 128000
A B
C D
E
Finnish Tax System 2011
JUMP
0 50000 100000 150000 200000
050
000
1000
0015
0000
2000
00
Income
Wag
e
128750
Stylized Model
c=35000b=15000a=0
PH
AS
E−
IN
PLA
TE
AU
PH
AS
E−
OU
T
JUMP (> 96000)
w=c=35000
Figure 5: Optimal wage in Finnish 2011 tax system and in a stylized framework
The most stunning thing in the optimal wage schedule in figure 5 appears at
the income level of around 128 000e. Here we observe just like in our simple
stylized model, a discrete jump where a one euro increase in the entrepreneur
income implies a change in optimal wage of tens of thousands of euros.21 Even
trepreneur income.20Gross income is the amount an owner would receive if there were no taxes at all.21In the true tax system not all of the compensation is paid as wage after the jump,
because there it is optimal to pay dividends up until 9 percent of the net wealth share of the
company as these dividends are tax-free according to Finnish tax law. The entrepreneurs
also must pay pension payments, which are determined according to the estimated yearly
earnings.
23

if the stylized model is dramatically simpler than the true tax system, it still
provides this same feature. The other common feature between the true tax
system and the stylized model is that with small income levels it is optimal to
pay only wage. This follows in the true system from both the deductions and
the low tax rates for low wages.
The observed sharp and complicated income-shifting incentives (a jump)
that arise due to deductions (added into DIT system)22 are likely to cause tax
compliance costs. An entrepreneur either has to find out about tax rules by
himself or pay to an accounting company to do the optimization. Otherwise
he ends up paying higher taxes than optimal. Next we provide an example of
the magnitude of the possible additional costs.
In addition to compliance costs another potential cost of jump is that it
makes an entrepreneur tax-bill more vulnerable for uncertainty. Suppose that
in the beginning of the year an entrepreneur believes that his business will yield
180 000e that year, that is 15 000e per month. Suppose that (according to
the optimal wage schedule in figure 3) he pays himself wage of 15 000e each
month. Next suppose that his business faces a downturn starting from July
and lasting until the end of the year. During this downturn the company does
not make any profit and thus the business yields only 90 000e for the whole
year. An entrepreneur has paid (until the end of June) all the 90 000e as
wage. Because the deduction is zero for this income level, he pays 22 500e
earned income tax (25%) from his wage income. If he would have known that
his company income will be 90 000e , he would have optimally chosen to pay
(see figure 3) 35 000e as wage income (15 000e tax-free and 20 000e with
22Note that without deduction all the income would be paid as wage with every income
level as τW < τD.
24

25 percent rate; i.e. 5 000e) and the rest, 55 000e as dividends (29 percent of
50 000e is 15 950e). The total tax payments would in this case be 20 950e ,
which is 23.3% of 90 000e. In this example an entrepreneur total tax-bill is
increased by about 7% (from 23.3% to 25%) due to uncertainty.
0 50000 100000 150000 200000
050
000
1000
0015
0000
2000
00
Income
Wag
e
128750
Stylized Model
c=35000b=15000a=0
PH
AS
E−
IN
PLA
TE
AU
PH
AS
E−
OU
T
JUMP (> 96000)
w=c=35000
MINIMUM
0 50000 100000 150000 200000
050
000
1000
0015
0000
2000
00
Income
Wag
e
128750
No Deduction
MINIMUM
Figure 6: Optimal wage schedules with and without deduction.
The third drawback resulting from the jump arises if one cannot wait for
the next year to receive dividends23, but has to pay himself such a minimum
amount of wage, which exceeds the optimal wage. Figure 6 shows the optimal
wage schedules in the presence and in the absence of deduction in the stylized
model. Let us consider a case where the income is 100 000 units and one has
to pay at least 60 000 units of wage. With the deduction he cannot pay the
optimal amount of wage (35 000e), whereas without the deduction (100 000e)
he can. Thus the deduction makes this type of problem more pronounced and
actually promotes a redistribution from worse-off entrepreneurs (who are more
23Of those companies that paid dividends at all from their 2011 income, 80% of the
payments were done on the following year, when the company income is known.
25

likely to face this restriction) to better-off entrepreneurs. We come back to this
issue below, where we consider year 2012 tax system and this problem becomes
even more pronounced.
4.2 Entrepreneur optimization problem in 2012
Let us next consider year 2012 Finnish tax system. Even if multiple small
changes occurred in the Finnish tax system in 201224 the structure of the tax
system and the levels of tax rates did not change much from year 2011 to 2012
(see figure 4). However, two changes are worth to mention. First, the corporate
income tax rate was decreased from 26% to 24.5%. Second, the capital income
tax rate of 28% was replaced by a two-step capital income taxation with tax
rate of 30% up until capital income of 50 000e and 32% for the capital income
exceeding 50 000e. In addition some of the deductions were changed and the
inflation adjustments were made to the state income tax schedule. Due to all
these changes the marginal tax rates differ in 2012 from those in year 2011 tax
system, yet not very much.
Figure 7 shows the optimal wage schedule for an entrepreneur facing a year
2012 Finnish tax system (left graph) and in our modified stylized model (right
graph). The stylized model is otherwise the same as that for the year 2011
tax system, but modified by adding progressiveness into earned income tax
schedule. More specifically the earned income tax rate is chosen to be 30%
from income level 50 000e on.
The graphs share some similar features, yet differ in some parts from those
for year 2011. First, like in 2011 tax system, up until a certain level it is
24For a detailed discussion see Ropponen 2012.
26
0 50000 100000 150000 200000
050
000
1000
0015
0000
2000
00
Income
Wag
e
upper bound for wage
optimal wage
32000 88000 128000
A B
C D
E
Finnish Tax System 2012
0 50000 100000 150000 200000
050
000
1000
0015
0000
2000
00
Income
Wag
e
128750
Stylized Model
c=35000b=15000a=0
PH
AS
E−
IN
PLA
TE
AU
PH
AS
E−
OU
T
w=c=35000
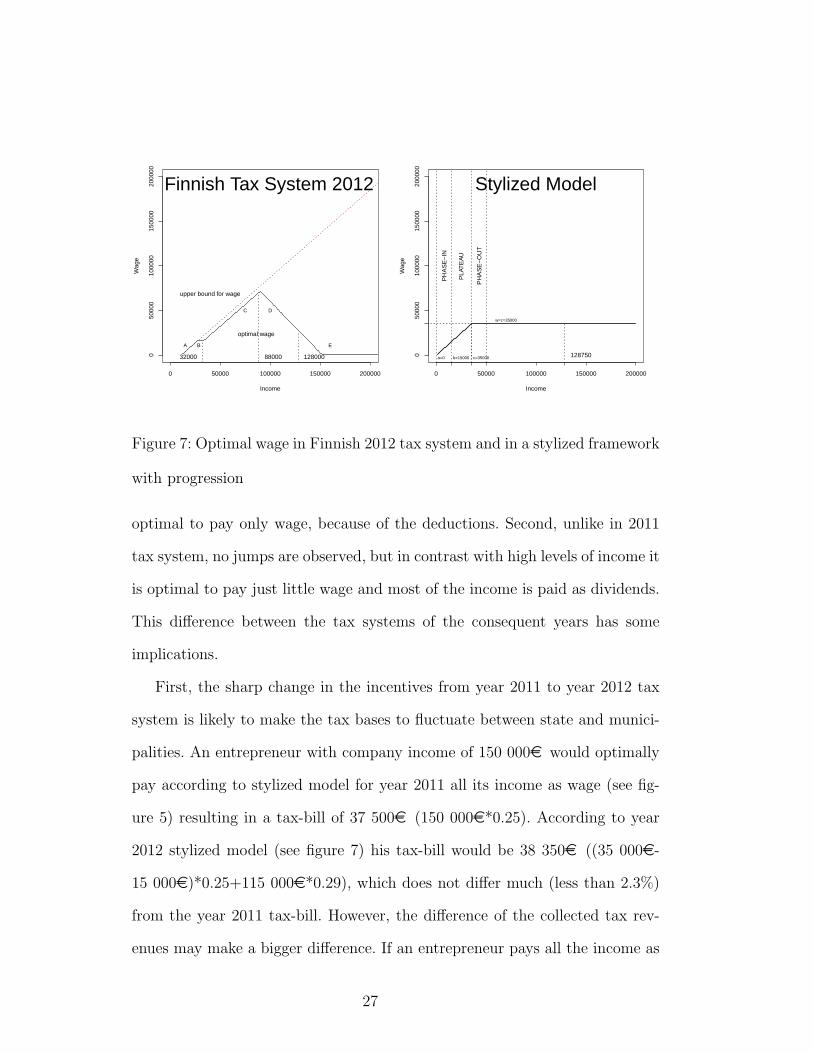
Figure 7: Optimal wage in Finnish 2012 tax system and in a stylized framework
with progression
optimal to pay only wage, because of the deductions. Second, unlike in 2011
tax system, no jumps are observed, but in contrast with high levels of income it
is optimal to pay just little wage and most of the income is paid as dividends.
This difference between the tax systems of the consequent years has some
implications.
First, the sharp change in the incentives from year 2011 to year 2012 tax
system is likely to make the tax bases to fluctuate between state and munici-
palities. An entrepreneur with company income of 150 000e would optimally
pay according to stylized model for year 2011 all its income as wage (see fig-
ure 5) resulting in a tax-bill of 37 500e (150 000e*0.25). According to year
2012 stylized model (see figure 7) his tax-bill would be 38 350e ((35 000e-
15 000e)*0.25+115 000e*0.29), which does not differ much (less than 2.3%)
from the year 2011 tax-bill. However, the difference of the collected tax rev-
enues may make a bigger difference. If an entrepreneur pays all the income as
27

wage, his municipal tax will be in the Finnish 2011 tax system about 87% of
the state tax.25 Next suppose that an entrepreneur pays 35 000e as wage and
the rest of the income as dividends (like in modified stylized model for year
2012). The state income tax is now 14 323e, the municipality tax 16 099e
and the corporate income tax 26 899e.26 An approximation of the Finnish tax
system where roughly 30% of the corporate tax goes for the municipalities and
70% for the state, leads to municipality tax being about 73% of the state tax.27
Thus, the sharp income-shifting incentives combined with yearly changes in a
tax system are likely to affect in non-negligible way to the relative levels of
taxes collected between the state and the municipalities.
Second, as also seen already above, if an entrepreneur would like to op-
timize but must pay himself some minimum amount of wage without having
an opportunity to wait for the next year to receive dividends, he may end up
25Because an entrepreneur must pay pension payments and other payments, the maximum
amount of wage that can be paid is about 136 300e in 2011 tax system. The taxes and
payments sum up to 48.1% of the company income with this choice. The state tax is now
29 699e and the municipality tax is 25 922e. Because all the income is paid as wage, no
corporate income tax is paid.26In this case the taxes and payments sum up to 47.3% of the company income and an
entrepreneur pays himself dividends of 76 559e.27The corporate income tax is divided in Finnish tax system between the state, the munic-
ipalities and the congregations according to a given formulary defining the relative shares.
The division of the earned income tax revenues depends on the earned income levels for
each taxpayer and thus also differs from the division of the corporate income tax revenues.
Thus the choice between wage and dividends affects also tax revenues. Proportional share
for the municipalities is 31.99% in 2011 and 28.34% in 2012 (see e.g. Government proposal;
HE 180/2014). The corresponding numbers for the congregation are 2.55% and 2.30%. The
state thus collects in total 33 152e and the municipalities 24 169e in this case.
28

receiving much higher tax-bill than with optimal wage-dividend choice. Sup-
pose an entrepreneur must pay from a 150 000e company income (at least)
100 000e as wage in the modified stylized model.28 His tax-bill is then 42
000e (50 000*0.25 + 50 000*0.30 + 50 000*0.29), whereas with optimal wage
schedule (35 000e as wage and 115 000e as dividends) it would be 38 350e
((35 000e-15 000e)*0.25+115 000e*0.29). Thus the restriction, which is more
often faced by poorer entrepreneurs than better-off entrepreneurs yields about
10% higher tax-bill in this case.
28Marginal tax rate for additional wage income is now 30% and for dividends it is 29%.
Thus it is optimal to pay 100 000e as wage in this case.
29

5 Empirical Evidence
The observed features of the DIT system might not be of great importance
if the entrepreneurs did not follow the incentives provided by the system.
To illustrate the reflection of the Finnish tax system on the behavior of the
entrepreneurs let us consider an example of a particular dividend related in-
centive.29
Finnish tax system makes dividend income in some cases very cheap com-
pared to wage income. In years 2011 and 2012 the dividend income that is
both below 9 percent of the net wealth of the company (share) and below
a given euro amount (90 000e in 2011, 60 000e in 2012) is tax-free for an
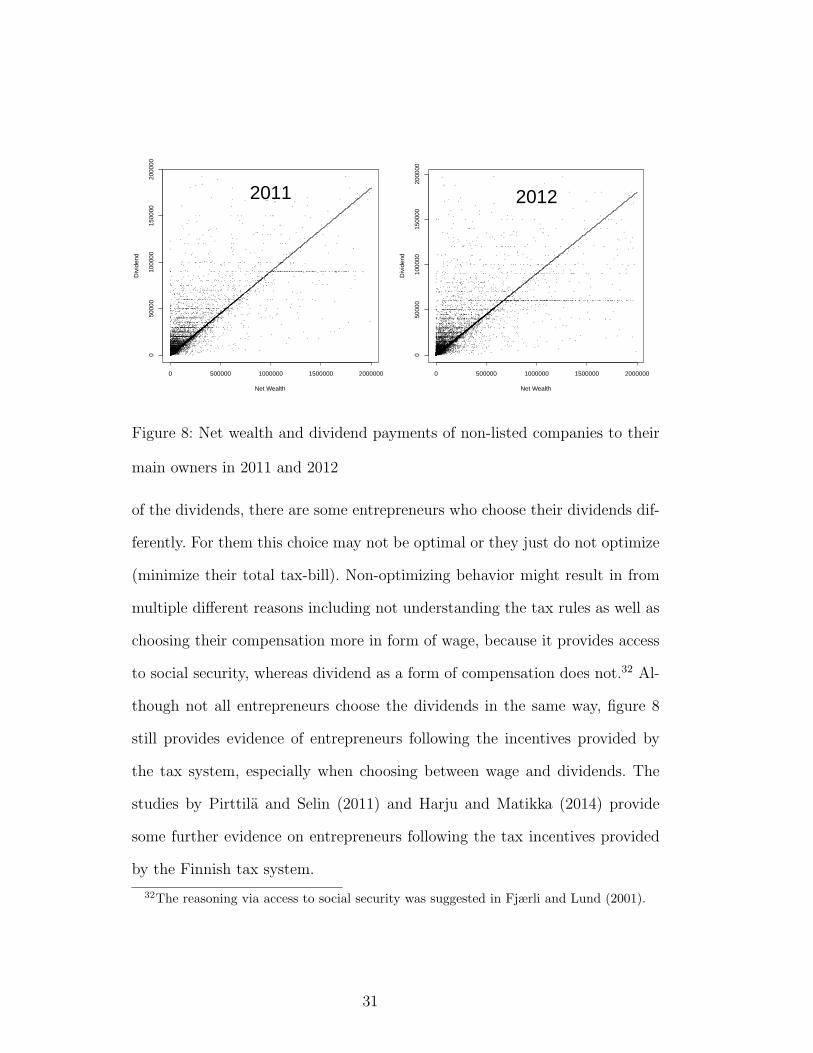
entrepreneur.30 Let us illustrate this incentive by the administrative data.
Figure 8 plots paid dividends as a function of entrepreneur share of the
net wealth of the company in years 2011 and 2012. The concentration of div-
idends to this net wealth limit is clearly seen in the figure: Both graphs show
a concentration of dividends on the amounts which equal to 9 percent of the
net wealth share (solid line) of the company as well as on the euro limit, 90
000e in 2011 and 60 000e in 2012.31 Even if we observe a clear concentration
29Here we do not take a stand on optimizing behavior, but concentrate on illustrating
that entrepreneurs do take advantage of the cheap dividends provided by the tax system.30A corporate tax had to be paid from the profit before dividend payment, but no tax on
paid dividends was levied on top of it. From 2014 on these dividends are no longer tax-free,
but still face a lighter tax treatment than other dividends.31In more detail the figure shows the paid dividends for those main owners of a non-listed
company who have paid dividends at all (those entrepreneurs who pay all the income as wage
are not observed in the data). Maattanen and Ropponen (2014) show that with 3 percent
accuracy about one half of the entrepreneurs choose their dividends to equal 9 percent of
the net wealth in 2011.
30
0 500000 1000000 1500000 2000000
050
000
1000
0015
0000
2000
00
Net Wealth
Div
iden
d
2011
0 500000 1000000 1500000 2000000
050
000
1000
0015
0000
2000
00
Net Wealth
Div
iden
d
2012
Figure 8: Net wealth and dividend payments of non-listed companies to their
main owners in 2011 and 2012
of the dividends, there are some entrepreneurs who choose their dividends dif-
ferently. For them this choice may not be optimal or they just do not optimize
(minimize their total tax-bill). Non-optimizing behavior might result in from
multiple different reasons including not understanding the tax rules as well as
choosing their compensation more in form of wage, because it provides access
to social security, whereas dividend as a form of compensation does not.32 Al-
though not all entrepreneurs choose the dividends in the same way, figure 8
still provides evidence of entrepreneurs following the incentives provided by
the tax system, especially when choosing between wage and dividends. The
studies by Pirttila and Selin (2011) and Harju and Matikka (2014) provide
some further evidence on entrepreneurs following the tax incentives provided
by the Finnish tax system.
32The reasoning via access to social security was suggested in Fjærli and Lund (2001).
31
6 Conclusions
The discussion about the benefits and drawbacks of the DIT systems, compared
to the GIT systems has been going on already for a long time. I provide new
aspects for this ongoing discussion.
I show that deductions combined with a DIT system provides sharper and
more complicated income-shifting incentives than when combined with a GIT
system. This is likely to increase tax compliance costs. European Commission
(2013) finds information as a key cost item in determining the tax compli-
ance costs, suggesting that these costs are likely to fall especially on small
businesses. It also finds that these costs are lower for simpler tax codes. Blau-
fus, Eichfelder and Hundsdorfer (2014) estimate the aggregate tax compliance
costs of German income taxpayers and find their magnitudes to be of several
percentages of the income tax revenue. For self-employed their estimates are
even higher. Thus a movement towards simpler tax code might increase welfare
by reducing the compliance costs especially for small business.
In addition to compliance costs, the observed sharp income-shifting incen-
tives between wage and dividend income, driven by deductions, may also have
other negative effects. These may change dramatically the relative amount
of taxes collected by state and municipalities. The abolishment of these in-
centives would reduce the fluctuations between tax bases. Another negative
consequence of the sharp incentives is that even if deductions are typically
designed to promote redistribution from better-off individuals to less well-off
individuals, these may work the other way around for entrepreneurs in a DIT
system. Compared to those entrepreneurs who have to pay wage for themselves
each month, those who can choose wage-dividend combination only in the end
32
of the year may benefit from this choice more in the presence of deductions
than when they are absent.
Our study implies that the deductions not only erode the tax base and
imply higher tax rates, but also make the incentives for income-shifting sharper
than without any deductions in a DIT system. One way to reduce the observed
negative consequences would be by making changes to deductions. One solution
might be to remove the deductions. However, this would not as such solve the
income-shifting problem completely. It might also turn out to be politically
difficult. Another solution might be to remove the phase-out regions of the
deductions, as these are the biggest reason for the observed income-shifting
incentives in the first place. This would, however, probably be too costly. Third
possible change for the deductions might be by making their phase-out region
very gentle. This would also, however, increase costs, yet not as much as the
removal of it.
Tax-bill which was independent of the actions taken by an entrepreneur,
would remove the incentive for income-shifting and would thus mitigate the
observed weaknesses of the current Finnish DIT tax system. An attractive
reform tackling the observed income-shifting incentives in the Finnish DIT
system would be to follow steps towards a Norwegian DIT tax system. The
new system might include an imputed normal return, which would be taxed
as capital income. Above-normal returns would be then taxed by labor-income
tax. As long as the total tax-bill of an entrepreneur is not be subject to his
choice between different compensation forms, there is no incentive for income-
shifting.
33

Acknowledgements
I thank Jarkko Harju and Tuomas Matikka as well as Jyvaskyla summer sem-
inar audience for the discussions and comments about the paper.
References:
Alstadsæter, Annette and Martin Jacob (2013): Who participates in Tax
Avoidance?, CESifo Working Paper No. 4219
Blaufus, Kay, Sebastian Eichfelder and Jochen Hundsdoerfer (2014): Income
Tax Compliance Costs of Working Individuals: Empirical Evidence from
Germany, Public Finance Review 42(6): 800-829
Boadway, Robin (2004): The Dual Income Tax System - An Overview, CESifo
DICE Report 3/2004
Devereux, Michael P. and Simon Loretz (2013): What do we know about
corporate tax competition, National Tax Journal 66(3): 745-774
Eggert, Wolfgang and Bernd Genser (2005): Dual Income Taxation in EU
Member Countries, CESifo DICE Report 1/2005
European Commission (2013): A Review and Evaluation Methodologies to
Calculate Tax Compliance Costs, European Commission Taxation Papers,
Working Paper N.40.
Fjærli, Erik and Diderik Lund (2001): The Choice between Owner’s Wages
and Dividends under the Dual Income Tax, Finnish Economic Papers
14(2): 104-119
Fuest, Clemens, Bernd Huber and Jack Mintz (2005): Capital mobility and tax
34

competition, Foundations and Trends in Macroeconomics 1(1): 1-62
Harju, Jarkko and Tuomas Matikka (2014): Business Owners and Income-
Shifting between Tax Bases: Empirical Evidence from a Finnish Tax
Reform, CESifo Working Paper No. 5090
Keuschnigg, Christian and Martin D. Dietz (2007): A growth oriented dual
income tax, International Tax and Public Finance 14: 191-221
Kleinbard, Edward D. (2010): An American Dual Income Tax: Nordic
Precedents, Northwestern Journal of Law and Social Policy 5: 41-86
Le Maire, Daniel and Bertel Schjerning (2013): Tax bunching, income
shifting and self-employment, Journal of Public Economics 107: 1-18
Lindhe, Tobias and Jan Sodersten (2012): The Norwegian Shareholder Tax
Reconsidered, International Tax and Public Finance 19: 424-441
Maattanen, Niku and Olli Ropponen (2014): Taxation, profit distribution
and investment of non-listed companies in Finland, ETLA Reports 40
(in Finnish: Listaamattomien osakeyhtioiden verotus, voitonjako
ja investoinnit, ETLA Raportit 40)
Nielsen, Søren Bo and Peter Birch Sørensen (1997): On the Optimality
of the Nordic System of Dual Income Taxation, Journal of Public
Economics 63: 311-329
Pirttila, Jukka and Hakan Selin (2011): Income Shifting within a Dual
Income Tax System: Evidence from the Finnish Reform of 1993,
Scandinavian Journal of Economics 113(1): 120-144
Ropponen, Olli (2012): Evaluation of Entrepreneur Taxation - A Framework
35

and Simulation Results, VATT Mimeo 20 (in Finnish: Yrittajan verotuksen
arviointi - mallikehikko ja simulointituloksia, VATT Muistio 20)
Saez, Emmanuel (2010): Do Taxpayers Bunch at Kink Points?, American
Economic Journal: Economic Policy 2 (Aug. 2010): 180-212
Sandmo, Agnar (2005): Inequality and Redistribution: The Need for New
Perspectives, Norwegian School of Economics, Discussion Paper No. 4/2005
Schratzenstaller, Margit (2004): Towards Dual Income Taxes - A Country-
Comparative Perspective, CESifo DICE Report 3/2004
Sørensen, Peter Birch (1994): From the global income to the dual income
tax: Recent tax reforms in the Nordic countries, International Tax and
Public Finance 1 (1): 57-79
Sørensen, Peter Birch (2005a): Neutral Taxation of Shareholder Income,
International Tax and Public Finance 12: 777-801
Sørensen, Peter Birch (2005b): Dual Income Taxation: Why and How?
FinanzArchiv 61: 559-586
Spengel, Christoph and Wolfgang Wiegard (2004): Dual Income Tax: A
Pragmatic Tax Reform Alternative for Germany, CESifo DICE Report
3/2004
36