1 introduction to the environment and...
TRANSCRIPT

1
Introduction to the Environment and Ecosystems
GE 302 – Industry and the EnvironmentTopic 1
Department of Civil Engineering College of EngineeringKing Saud University
Course Description• This course introduces the impact of engineering and
industrial activities on the environment.
• The lectures cover basics of ecosystems,environmental balance, types of pollution, and types,sources, and limits of pollutants; in addition tofundamentals of Environmental Impact Assessment(EIA).
• Pollution control technologies and examples ofpollution from various engineering and industrialsectors are also covered.
• The course also includes a group term project.
2

2
Course Learning Objectives (CLOs)Students completing this course successfully will be able to:1. Understand the basics of the global ecosystem and
the natural cycles of its major components.2. Understand the types of environmental pollution
caused by engineering and industrial activities.3. Realize the importance of sustainable development
and maintaining environmental balance.4. Understand the different types of pollutants, their
sources, limits and the various technologies for pollution control.
5. Recognize the importance of EIA prior the development of the projects.
6. Improve their communication skills, including reading, writing, and oral presentations.
3
Course DescriptionTextbook:
– G. Tyler Miller, Scott Spoolman (2014) Living in the Environment, 17th edition, Cengage Learning. (Chapter: 3, 6, & 23)
– Jerry A. Nathanson, Richard A. Schneider (2014) Basic Environmental Technology: Water Supply, Waste Management, and Pollution Control, 6th edition, Pearson Education. (Chapter: 5, 11, 12, 13, & 14)
– Grade Distribution:Two Mid-term Exams: 40%Activities (field visit, quizzes, etc.): 10%Project: 10%Final Exam: 40%
Examinations:1st midterm on: (Monday 10/02/1439; 30/10/2017) 2nd midterm on: (Monday 23/03/1439; 11/12/2017)
4

3
Course Schedule
5
Week Topic
1 Introduction to ecosystems
2 Hydrologic and nutrients cycle
3 The human population and its impact
4 Water pollution and control
5 Water pollution and control
6 Water pollution and control
7 Air Pollution and control
8 Air Pollution and control
Course Schedule
6
Week Topic
9 Air Pollution and control
10 Municipal solid waste
11 Hazardous waste management
12 Noise pollution and control
13 Environmental impact studies and audits
14 Sustainability
15 Sustainability

4
Environmental components of earth
7
• The earth’s life-support system consists of four main spherical systems that interact with one another– The atmosphere (air)– the hydrosphere (water)– the geosphere (rock, soil, and
sediment)– the biosphere (living things)
8
Land, air, water, and a variety of plants and animals sustain the earth’s diversity of life and human economies.

5
The atmosphere• Is a thin spherical envelope of gases surrounding the
earth’s surface.
• Its inner layer, the troposphere, contains air that we breathe, which consists of:– nitrogen (78% of the total volume) – oxygen (21%). – The remaining 1% of the air includes water vapor, carbon
dioxide, methane, etc. all of which are called greenhouse gases
• The next layer is called the stratosphere, Its lower portion holds enough ozone (O3) gas to filter out about 95% of the sun’s harmful ultraviolet (UV) radiation
9
The hydrosphere• consists of all of the water on or near the earth’s
surface.
• It is found as water vapor in the atmosphere, liquid water on the surface and underground, and ice.
• The oceans, which cover about 71% of the globe, contain about 97% of the earth’s water.
10

6
The geosphere• consists of the earth’s intensely hot core, a thick mantle
composed mostly of rock, and a thin outer crust.• Its upper portion contains nonrenewable fossil fuels
and minerals that we use, as well as renewable soil chemicals (nutrients) that organisms need in order to live, grow, and reproduce.
11
The biosphere• consists of the parts of the atmosphere, hydrosphere,
and geosphere where life is found.
Factors Sustain the Earth’s Life1. The one-way flow of high-
quality energy from the sun, through living things in their feeding interactions.
2. The cycling of nutrients (the atoms, ions, and molecules needed for survival by living organisms) through parts of the biosphere.
3. Gravity, which allows the planet to hold onto its atmosphere and helps to enable the movement and cycling of chemicals through air, water, soil, and organisms.
12

7
Interaction of solar energy with the atmosphere and earth’s surface
13
Energy flow from sun to earth and within the earth’s systems• Sun releases tremendous amounts of energy into the
space, only a very small amount of this energy reaches the earth.
• This energy reaches the earth in the form of electromagnetic waves, composed mostly of visible light, ultraviolet (UV) radiation, and heat (infrared radiation).
• Much of this energy is absorbed or reflected back into space by the earth’s atmosphere and surface.
• The solar energy that reaches the atmosphere lights the earth during daytime, warms the air, evaporates and cycles water through the biosphere, and generate winds.
• Also, green plant and algae use solar energy to produce the nutrient they need through the photosynthesis process, and in turn, to feed the animal.
14

8
Energy flow from sun to earth and within the earth’s systems• The solar radiation reached the planet’s surface,
interacts with the earth’s land, water, and life and is degraded to lower-quality infrared radiation.
• Some of the infrared radiation is reflected back to the lower atmosphere, where it will interact with greenhouse gases (water vapor, carbon dioxide, methane, etc.) and Some of it flows back into space as heat.
• When radiated heat from earth’s surface interact with greenhouses gases it warm the lower atmosphere and the earth’s surfaces, which is know as greenhouse effect.
• Without this natural greenhouse effect, the earth would be too cold to support the forms of life we find here today.
15
Ecology is the science that focuses on how organisms interact with one another and with their nonliving environment of matter and energy.
16

9
Ecosystems Have Living and Nonliving Components• The ecosystems are
made up of living (biotic) and nonliving (abiotic) components.
• nonliving components are water, air, nutrients, rocks, heat, and solar energy.
• Living components include plants, animals, microbes, and all other organisms.
17
Trophic level
18
• Depending on its source of food or nutrients, organism in an ecosystem is assigned to a feeding level, or trophic level
• living organisms transfer energy and nutrients from one trophic level to another within an ecosystem
• We can broadly classify the organisms as producers and consumers.

10
• Producers, sometimes called autotrophs (self-feeders), make the nutrients they need from compounds and energy obtained from their environment.
• In a process called photosynthesis, plants typically capture solar energy that falls on their leaves and use it in combination with carbon dioxide and water to form organic molecules.
19
gree
n pl
ants
alga
e an
d aq
uatic
pla
nts
• Consumers, or heterotrophs, cannot produce the nutrients they need through photosynthesis or other processes.
• Consumers obtain their energy and nutrients by feeding on other organisms (producers or other consumers).
• Types of consumers:– Herbivores, or Primary consumers, (plant eater), are animals
that eat mostly green plants.– Carnivores (meat eaters) are animals that feed on the flesh of
other animals. secondary consumers that feed on the flesh of herbivores tertiary consumers that feed on the flesh of other carnivores
– Omnivores eat plants and other animals.– Decomposers release nutrients from the wastes or remains of
plants and animals and then return those nutrients to the soil, water, and air for reuse by producers (bacteria and fungi).
20
11
21
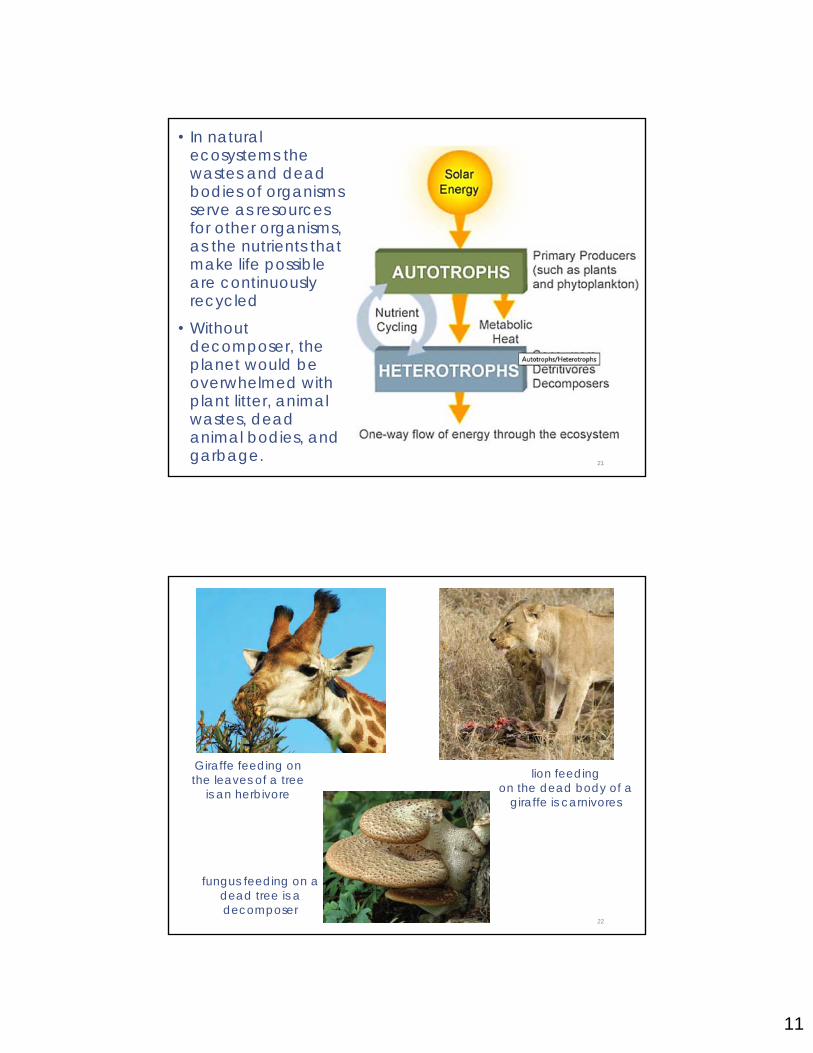
• In natural ecosystems the wastes and dead bodies of organisms serve as resources for other organisms, as the nutrients that make life possible are continuously recycled
• Without decomposer, the planet would be overwhelmed with plant litter, animal wastes, dead animal bodies, and garbage.
22
fungus feeding on a dead tree is a decomposer
Giraffe feeding on the leaves of a tree
is an herbivore
lion feedingon the dead body of a
giraffe is carnivores

12
Aerobic & anaerobic respiration• Consumers, and decomposers use the chemical
energy stored in glucose and other organic compounds to fuel their life processes.
• This energy is released by:– Aerobic respiration which uses oxygen to convert glucose
(or other organic nutrient molecules) back into carbon dioxide and water.
– Anaerobic respiration, or fermentation, which breaks down organic compounds in the absence of oxygen. The end products of this process are compounds such as methane gas (CH4), hydrogen sulfide (H2S), etc.
23
Energy Flows through Ecosystems in Food Chains and Food Webs• The chemical energy stored as nutrients in the bodies and
wastes of organisms flows through ecosystems from one trophic (feeding) level to another.
• Food chain is a sequence of organisms, each of which serves as a source of food or energy for the next.
24

13
• In natural ecosystems, most consumers feed on more than one type of organism, and most organisms are eaten or decomposed by more than one type of consumer.
• Organisms in most ecosystems form a complex network of interconnected food chains called a food web.
25
26
This diagram illustrates a greatly simplified food web in the southern hemisphere. The shaded middle area shows a simple food chain. Its participants interact in feeding relationships to form the more complex food web shown here.

14
27freshwater phytoplankton
Marine Phytoplankton
Usable Energy Decreases with Each Link in a Food Chain or Web• Each trophic level in a food chain or web contains a
certain amount of biomass (the dry weight of all organic matter contained in its organisms).
• In a food chain or web, chemical energy stored in biomass is transferred from one trophic level to another.
• As energy flows through ecosystems in food chains and webs, there is a decrease in the amount of high-quality chemical energy available to organisms at each succeeding feeding level
• With each transfer, some usable chemical energy is degraded and lost to the environment as low-quality heat.
28

15
29
This model is a generalized pyramid of energy flow that shows the decrease in usable chemical energy available at each succeeding trophic level in a food chain or web.
Why there are fewer tigers in tropical rain forests than there are insects?
food chains and webs rarely have more than four or five trophic levels
Some Ecosystems Produce Plant Matter Faster Than Others Do• The amount of living organic material (biomass) that a
particular ecosystem can support is determined by– how much solar energy its producers can capture and store as
chemical energy.– how rapidly they can do so.
• Primary productivity is the rate at which an ecosystem’s producers convert solar energy into chemical energy in the form of biomass found in their tissues.
• It is usually measured in (kcal/m2/yr)• To stay alive, grow, and reproduce; producers must use
some of the chemical energy stored in the biomass they make for their own respiration.
• Net primary productivity (NPP) is the rate at which producers use photosynthesis to produce and store chemical energy minus the rate at which they use some of this stored chemical energy through aerobic respiration.
30

16
• Only the biomass represented by NPP is available as nutrients for consumers, and they use only a portion of this amount.
• Thus, the planet’s NPP ultimately limits the number of consumers (including humans) that can survive on the earth. This is an important lesson from nature. 31
What are nature’s three most productive and three least productive systems?
GlossaryEnvironment All external conditions, factors, matter, and energy, living and nonliving, that affect any living organism or other specified system.
Ecology Biological science that studies the relationships between living organisms and their environment; study of the structure and functions of nature.
Ecosystem One or more communities of different species interacting with one another and with the chemical and physical factors making up their nonliving environment.
32

1
Hydrologic & Nutrients Cycle
GE 302 – Industry and the EnvironmentTopic 2
Department of Civil Engineering College of EngineeringKing Saud University
What Happens to Matter in an Ecosystem?
Matter, in the form of nutrients and water, cycles within and among ecosystems and the biosphere, and human activities are altering these cycles.
2

2
Nutrients Cycle within and among Ecosystems
• The elements and compounds that make up nutrients move continually through air, water, soil, and living organisms within ecosystems, as well as in the biosphere in cycles called nutrient cycles, or biogeochemical cycles.
• These cycles include the hydrologic (water), carbon, nitrogen, and phosphorus cycle.
• These cycles driven directly or indirectly by incoming solar energy and the earth’s gravity
3
The hydrologic cycle
• The hydrologic cycle, or water cycle, collects, purifies, and distributes the earth’s fixed supply of water.
• The water cycle is powered by energy from the sun and involves three major processes: evaporation, precipitation, and transpiration.
• When precipitation fall on terrestrial ecosystems it:– can become surface runoff that flows into streams.– seeps into the upper layers of soils where it is used by
plants.– some evaporate from top soil to atmosphere. – sinks through soil to underground layers of rock, sand, and
gravel called aquifers, where it is stored as groundwater.
4

3
• A small amount of the earth’s water ends up in the living components of ecosystems. As producers, plants absorb some of this water through their roots, most of which evaporates from plant leaves back into the atmosphere during transpiration.
• Because water dissolves many nutrient compounds, it is a major medium for transporting nutrients within and between ecosystems.
• Only about 0.024% of the earth’s vast water supply is available to humans and other species as liquid freshwater
5
6
Simplified model of the hydrologic cycle, in which water in various physical forms within the biosphere. Major harmful impacts of human activities are shown by the red arrows and boxes

4
Schematic diagram of the natural hydrologic cycle. The constant circulation of water is powered by energy from the sun and by gravity.
Human Activity Alter Water Cycle• We alter the water cycle in three major ways (see the
red arrows and boxes in Figure): – First, we withdraw large quantities of freshwater from
streams, lakes, and aquifers sometimes at rates faster than nature can replace it.
– Second, we clear vegetation from land for agriculture, mining, road building, and other activities, and cover much of the land with buildings, concrete, and asphalt.
This increases runoff, reduces infiltration that would normally recharge groundwater supplies, accelerates topsoil erosion, and increases the risk of flooding.
– Third, we also increase flooding when we drain and fill wetlands for farming and urban development.
wetlands provide the natural service of flood control, acting like sponges to absorb and hold overflows of water from drenching rains or rapidly melting snow.
8

5
9Jeddah floods, 2009
Natural Water Purification Processes• Throughout the hydrologic cycle, many natural
processes purify water.– Evaporation and subsequent precipitation act as a
natural distillation process that removes impurities dissolved in water.
– Water flowing above ground through streams and lakes is partially purified by chemical and biological processes (due to natural aeration and decomposer bacteria).
– Water flowing below ground in aquifers is naturally filtered by soil.
• The hydrologic cycle can be viewed as a cycle of natural renewal of water quality.
10

6
The Carbon Cycle• Carbon is the basic building block organic compounds
necessary for life.
• Various compounds of carbon circulate through the biosphere, the atmosphere, and parts of the hydrosphere, in the carbon cycle.
• The carbon cycle is based on carbon dioxide (CO2) gas, which makes up 0.039% of the volume of the earth’s atmosphere and is also dissolved in water.
• Carbon dioxide (along with water vapor in the water cycle) is a key component of the atmosphere’s thermostat.– If the carbon cycle removes too much CO2 from the atmosphere (Cooler)– if the carbon cycle generates too much CO2 to the atmosphere (Warmer)
11
The Carbon Cycle• Decomposers release the carbon stored in the bodies
of dead organisms on land back into the air as CO2.• In water, decomposers release carbon that can be
stored as insoluble carbonates in bottom sediment.• Marine sediments are the earth’s largest store of
carbon. • Over millions of years, buried deposits of dead plant
matter and bacteria are compressed between a layers of sediment, where high pressure and heat convert them to carbon-containing fossil fuels such as coal, oil, and natural gas.
• We have extracted and burned huge quantities of fossil fuels that took millions of years to form. This is why, on a human time scale, fossil fuels are nonrenewable resources.
12

7
13
Simplified model illustrates the circulation of variouschemical forms of carbon in the global carbon cycle, with major harmful impacts of human activities shown by thered arrows.
Simplified diagram of the carbon cycle. The arrows show the various directions of carbon transfer through the biosphere.
8
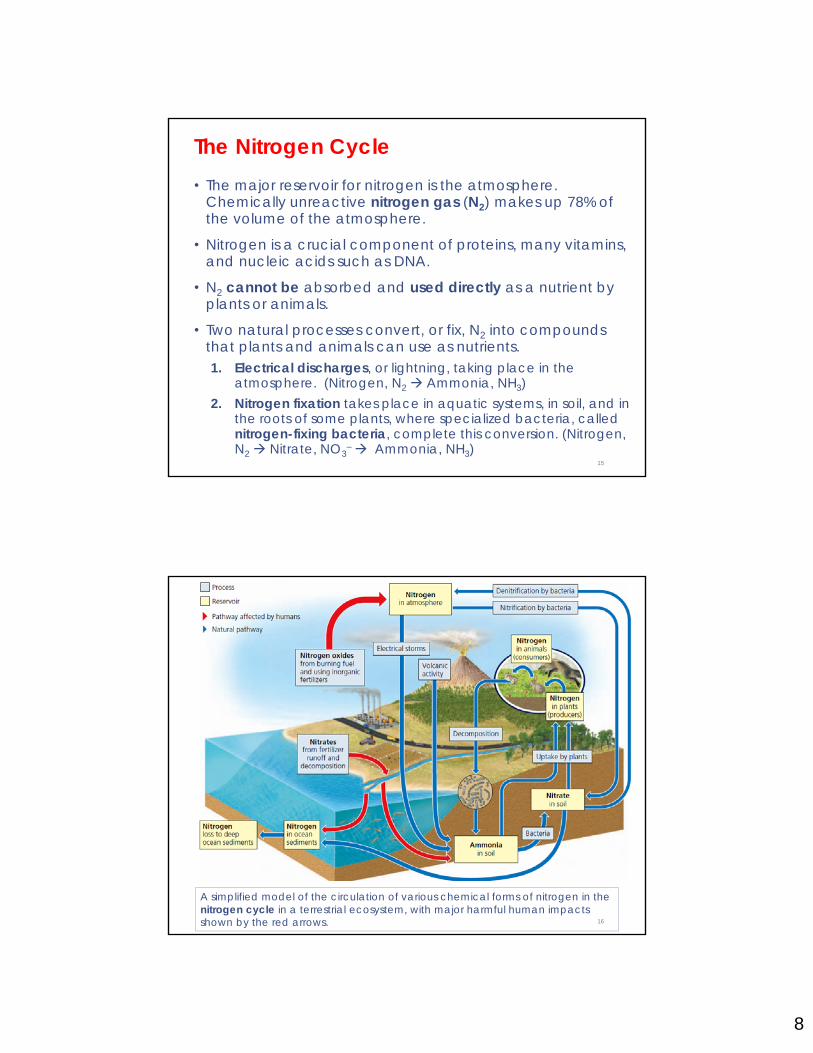
The Nitrogen Cycle• The major reservoir for nitrogen is the atmosphere.
Chemically unreactive nitrogen gas (N2) makes up 78% of the volume of the atmosphere.
• Nitrogen is a crucial component of proteins, many vitamins, and nucleic acids such as DNA.
• N2 cannot be absorbed and used directly as a nutrient by plants or animals.
• Two natural processes convert, or fix, N2 into compounds that plants and animals can use as nutrients. 1. Electrical discharges, or lightning, taking place in the
atmosphere. (Nitrogen, N2 Ammonia, NH3)2. Nitrogen fixation takes place in aquatic systems, in soil, and in
the roots of some plants, where specialized bacteria, called nitrogen-fixing bacteria, complete this conversion. (Nitrogen, N2 Nitrate, NO3
– Ammonia, NH3)15
16
A simplified model of the circulation of various chemical forms of nitrogen in the nitrogen cycle in a terrestrial ecosystem, with major harmful human impacts shown by the red arrows.

9
Simplified diagram of the nitrogen cycle. Molecular nitrogen must first be fixed (combined with oxygen) into the form of nitrate nitrogen before it can be used by plants as a nutrient.
The Phosphorus Cycle• Compounds of phosphorous (P) circulate through water,
the earth’s crust, and living organisms in the phosphorus cycle. The phosphorus cycle does not include the atmosphere.
• phosphate ions (PO43 –) serve as an important nutrient.
• The major reservoir for phosphorous is phosphate salts containing phosphate ions in terrestrial rock formations and ocean bottom sediments.
• The phosphorus cycle is slow compared to the water, carbon, and nitrogen cycles.
• For both producers and consumers, phosphates are a component of biologically important molecules such as nucleic acids.
• Because most soils contain little phosphate, the lack of it often limits plant growth on land unless phosphorus is applied to the soil as a fertilizer.
18
10
19
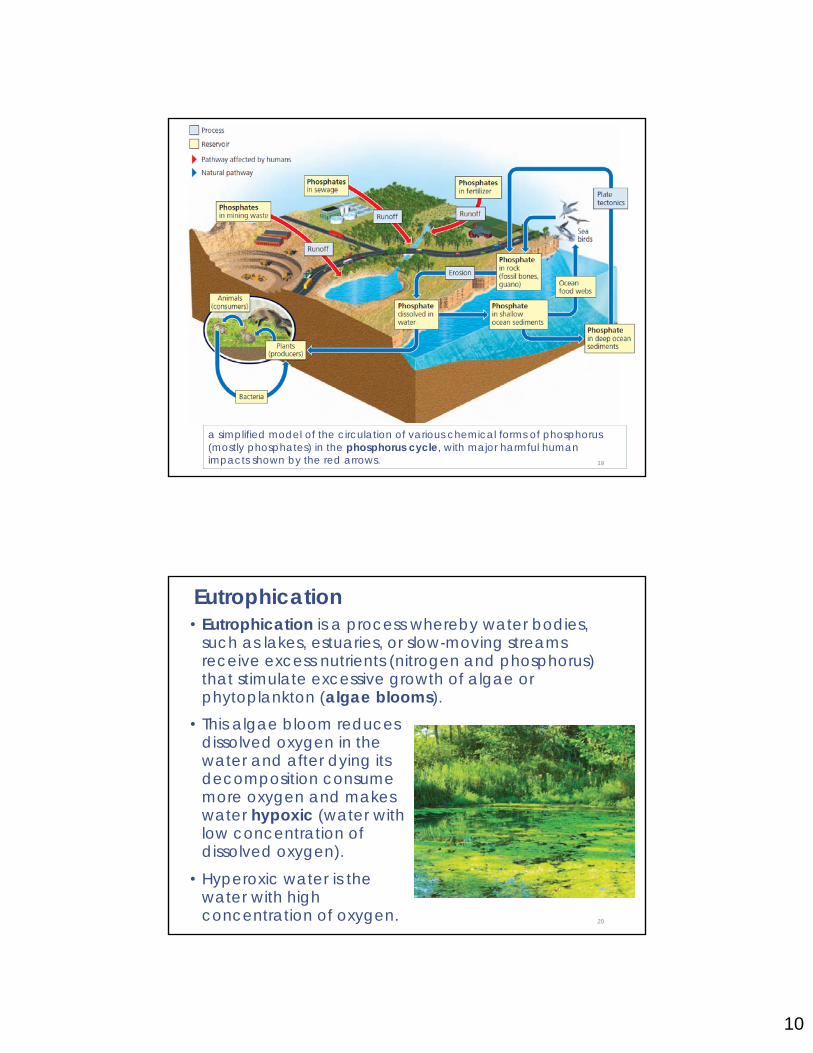
a simplified model of the circulation of various chemical forms of phosphorus(mostly phosphates) in the phosphorus cycle, with major harmful human impacts shown by the red arrows.
Eutrophication• Eutrophication is a process whereby water bodies,
such as lakes, estuaries, or slow-moving streams receive excess nutrients (nitrogen and phosphorus) that stimulate excessive growth of algae or phytoplankton (algae blooms).
20
• This algae bloom reduces dissolved oxygen in the water and after dying its decomposition consume more oxygen and makes water hypoxic (water with low concentration of dissolved oxygen).
• Hyperoxic water is the water with high concentration of oxygen.

1
The human population and its impact
GE 302 – Industry and the EnvironmentTopic 3
Department of Civil Engineering College of EngineeringKing Saud University
2
For most of history, the human population grew slowly. But for the past 200 years, the human population has grown rapidly, resulting in the characteristic J-curve of exponential growth

2
Three major factors account for population increase in the past 200 years:
1. Modern agriculture technique allow to grow more food.
2. Death rates drop because of improved sanitation and health care and development of antibiotics and vaccines to help control infectious diseases.
3. Humans adaptability to live in any climate zones and habitats.
• Most of the increase in the world’s population during the last 100 years took place because of a sharp drop in death rates – not a sharp rise in birth rates.
3
4
• No population can continue to increase in size indefinitely. Exponential growth occurs when a population has essentially unlimited resources to support its growth.
• Such exponential growth is eventually converted to logistic growth, in which the growth rate decreases as the population becomes larger and faces environmental resistance (right half of the curve).
• Over time, the population size stabilizes at or near the carrying capacity of its environment, which results in a sigmoid (S-shaped) population growth curve.
Carring capacityMaximum population of a particular species that a given habitat can support
over a given period
Environmental resistance that case the caring
capacity is: shrinkage in resources
such as food, water, and space
3
5
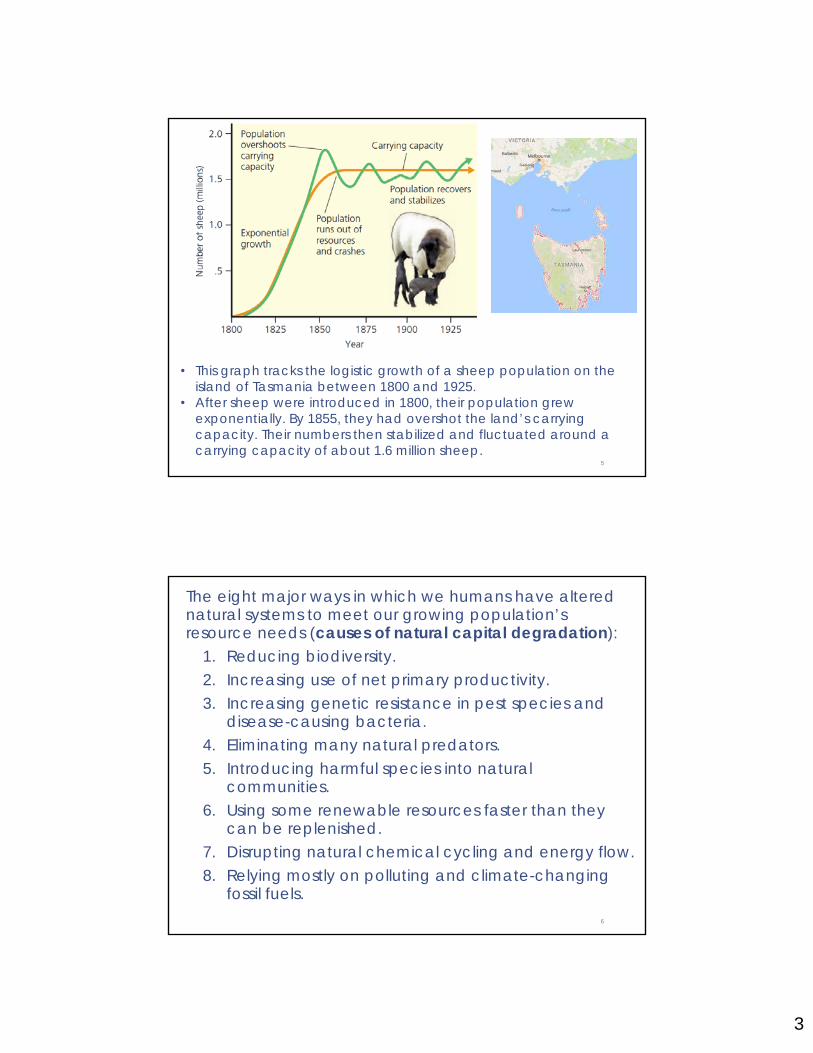
• This graph tracks the logistic growth of a sheep population on the island of Tasmania between 1800 and 1925.
• After sheep were introduced in 1800, their population grew exponentially. By 1855, they had overshot the land’s carrying capacity. Their numbers then stabilized and fluctuated around a carrying capacity of about 1.6 million sheep.
The eight major ways in which we humans have altered natural systems to meet our growing population’s resource needs (causes of natural capital degradation):
1. Reducing biodiversity.2. Increasing use of net primary productivity.3. Increasing genetic resistance in pest species and
disease-causing bacteria.4. Eliminating many natural predators.5. Introducing harmful species into natural
communities.6. Using some renewable resources faster than they
can be replenished.7. Disrupting natural chemical cycling and energy flow.8. Relying mostly on polluting and climate-changing
fossil fuels.6

4
• The average number of children born to women in a population (total fertility rate) is the key factor that determines population size.
• Population size increases through births (fertility) and immigration, and decreases through deaths (mortality) and emigration.
• Population change =
(Births + Immigration) – (Deaths + Emigration)
7
What Factors Influence the Size of the Human Population?
• Fertility rate: the number of children born to a woman during her lifetime.
• Two types of fertility rates affect a country’s population size and growth rate:
1. Replacement-level fertility rate– is the average number of children that couples in a
population must bear to replace themselves. – It is slightly higher than two children per couple: 2.1 in more-
developed countries and as high as 2.5 in some less-developed countries.
2. Total fertility rate (TFR)– is the average number of children born to women in a
population during their reproductive years. – This factor plays a key role in determining population size
8

5
9
Between 1955 and 2010, the average TFR dropped from 2.8 to 1.7 children per woman in more-developed countries and from 6.2 to 2.7 in less-developed countries.
This graph tracks the total fertility rate for both the more-developed and less-developed regions of the world, 1955 – 2010, with projections to 2050
• Two useful indicators of the overall health of people in a country or region are:– Life expectancy (the average number of years an individual
can be expected to live) o In 2010, Japan had the world’s longest life expectancy of 83
years. o In the world’s poorest countries, life expectancy is 57 years or
less.– Infant mortality rate (the number of babies out of every 1,000
born who die before their first birthday).o Infant mortality is viewed as one of the best measures of a
society’s quality of life because it reflects a country’s general level of nutrition and health care.
Several Factors Affect Death Rates:• Increased food supplies and distribution, better nutrition.• Medical advances such as immunizations and
antibiotics.• improved sanitation, and safer water supplies.
10

6
• Age structure is the numbers or percentages of males and females in young, middle, and older age groups in that population.
• Population experts construct a population age structure diagram by plotting a given population’s percentages of males and females in each of three age categories:– Pre-reproductive (ages 0–14), consisting of individuals
normally too young to have children– Reproductive (ages 15–44), consisting of those
normally able to have children– Post-reproductive (ages 45 and older), with individuals
normally too old to have children.
11
How Does a Population’s Age Structure Affect Its Growth or Decline?
12
This chart represents the generalized population age-structure diagrams for countries with rapid (3 – 1.5%), slow (1.4 – 0.3%), zero (0.2 – 0%), and negative (declining) population growth rates.

7
13
Global outlook: These charts illustrate population structure by age and sex in less-developed countries and more-developed countries for 2010
Even if the global replacement level fertility rate of 2.1 children per woman were magically achieved tomorrow, the world’s population would keep growing for at least another 50 years. This continued growth results from a population’s age structure.
Population Pyramid of
Saudi Arabia
14

8
We can slow human population growth by:1. Reducing poverty, through economic development
and education.
2. Empowering Women, by elevating the status of women.
3. Promote Family Planning
15
How Can We Slow Human Population Growth?
Three big ideas learned from this topic: The human population is increasing rapidly and may
soon bump up against environmental limits.
Even if population growth were not a serious problem, the increasing use of resources per person is expanding the overall human ecological footprint and putting a strain on the earth’s resources.
We can slow human population growth by reducing poverty through economic development, elevating the status of women, and encouraging family planning.
16

1
Water Pollutionpart-1- Introduction- Parameter of Water Quality
GE 302 – Industry and the EnvironmentTopic 4
Department of Civil Engineering College of EngineeringKing Saud University
• Water is an integral part of life on this planet.
• It is an odorless, tasteless, substance that covers more than three-fourths of the Earth's surface.
• Most of the water on Earth, 97.4% to be exact, is salt water found in the oceans.
• Water has such a strong tendency to dissolve other substances (universal solvent).
• We cannot drink salt water or use it for crops because of the salt content.
• We can remove salt from ocean water, but the process is very expensive
2
Facts about water

2
• Water surfaces constitute 70% of the earth’s surface.
• Seas and oceans (saltwater) forms approximately 97.4% of the earth’s water; i.e. only 2.6% is fresh water.
• Only small fraction (0.014%) in rivers, lakes and springs is readily available for human use
3
Global Distribution of Earth’s Water
• Solids: When water becomes very cold and freezes it will change from a liquid to a solid. It has a definite form and shape.
• Liquids: When water takes the shape of its container it is in a liquid form.
• Gases: When water is seen in a vapor form and has no definite size or shape it is in a gas form.
4
Three Forms of Water
• Surface Water (rivers, lakes, springs)
• Groundwater (difficult to obtain)
• Ocean & Seawater (not economic to Desalinize)
• Reclaimed water (Treated Wastewater)
Water Resources

3
5
SOURCE: Data from UNESCO-WWAP, 2003.
6
Source of Water & issues Associated with the Source
Source of Water
Issues
Surface water High flows, easy to contaminate, relatively high suspended solids (total suspended solids, TSS), turbidity, and pathogens. In some parts of the world, rivers and streams dry up during the dry season.
Groundwater Lower flows but natural filtering capacity that removes suspended solids (TSS), turbidity, and pathogens. May be high in dissolved solids (total dissolved solids, TDS), including Fe, Mn, Ca, and Mg (hardness). Difficult to clean up after contaminated. Renewal times can be very long.

4
7
Source of Water & issues Associated with the Source
Source of Water
Issues
Seawater Energy-intensive to desalinate, so costly compared with other sources, and disposal of resulting brine must be considered. Desalination can occur by distillation, reverse osmosis, electrodialysis, and ion exchange. Of these, multistage distillation and reverse osmosis are the two technologies most commonly used (they account for approximately 87 percent of worldwide desalination capacity). There are more reverse osmosis plants in the world; however, they are typically smaller in capacity than distillation plants.
8
Source of Water & issues Associated with the Source
Source of Water
Issues
Reclaimed andreused
Technically feasible. Currently used for irrigating agricultural crops, residential and commerciallandscaping, groundwater recharge, and potable water through direct and indirect use. Includesdecentralized use of gray water (wastewater produced from baths and showers, clothes anddishwashers, lavatory sinks, and drinking-water fountains). When used. for irrigation, nutrientspresent in reclaimed water can reduce fertilizer usage.

5
9
Trends in global water use by sectorThe Grey band represents the difference between the amount of water extracted and that actually consumed.
The quantity of water required for municipal uses for which the water supply scheme has to be designed requires following data: 1. Water consumption rate (liters per day per capita) (LPCD)2. Population to be served. Quantity = Per capita demand (lit/cap/day) x Population (cap)
Factors affecting the water consumption rate per person: • Standard of living (car wash, swimming pools, gardening) • Environmental awareness • Weather conditions and season of the year • Availability of water conservation programs • Metering and pricing • Social and cultural habits (bathing and showering frequency,
ablution, food festivals) 10
Water Quantity Estimation

6
0
1
2
3
4
5
6
7
8
9
2010 2011 2012 2013 2014
Mill
ions
m3 /
day
Water consumption in Saudi Arabia for domestic & industrial uses, all city
0 100 200 300 400 500 600 700 800 900 1000
%30الرياض %24مكة المكرمة
%6المدينة المنورة %4القصیم
%21الشرقیة %3عسیر %4تبوك %2حائل
%1الحدود الشمالیة %2جازان %1نجران %1الباحة %1الجوف
Distribution of water consumption in SA for 2014, in Millions m3/day
لإلحصاءالعامة الھیئة المملكة العربیة السعودية
Average water consumption rate in Saudi Arabia = 275 LPCDUSA: 575 LPCDUK: 150 LPCDRwanda: 20 LPCD
• Water pollution is any chemical, biological, or physical change in water characteristics that makes it unfit for a specific beneficial use.
• The distinction between polluted and unpolluted water depends on: – Type and concentration of impurities.– Intended use of water
• Water pollution occurs when pollutants are discharged directly or indirectly into water bodies without adequate treatment to remove harmful compounds.
• Water pollution affects plants and organisms living in these bodies of water, which can result in damaging natural biological system.
12
What is water pollution?

7
13
Two Types of Pollution Sources
Dispersed source pollutants are more difficult to control than are point source pollutants, which can be collected and removed from the water.
A pollutant can be classified according to the nature of its origin either a point source or a dispersed source pollutant.
• Dispersed sources cause a significant fraction of the water pollution that may exceed sewage pollution, especially from stormwater runoff in urban as well as rural areas.
• Water pollutants can be classified into groups of substances based primarily on their environmental impacts, or effects on human health.
• Generic types of water pollutants:1. Pathogenic organisms2. Oxygen-demanding substances3. Plant nutrients4. Toxic organics5. Inorganic chemicals6. Sediment7. Radioactive substances8. Heat9. Oil 14

8
1. Domestic Sewage (Wastewater):• the primary sources of the first three types of pollutants.• Pathogens, or disease-causing microorganisms, are
excreted in the feces of infected persons and may be carried into waters receiving sewage discharges.
• Oxygen-demanding substances: the organic wastes that exert a biochemical oxygen demand (BOD) as they are decomposed by microbes.
2. Agricultural activities:• The major source of water pollution is agriculture
according to the US Environmental Protection Agency (EPA).
15
Sources of Water Pollution due to Human Activities
• Farming is a source of silt, as well as nutrients, pesticides, and organic material.
3. Industrial activities:• Industry is a huge source of water pollution, it produces
pollutants that are extremely harmful to people and the environment.
• This wastewater may contain toxic chemicals, acids, alkalis, salts, poisons, oils and in some cases harmful bacteria.
4. Oil spill in oceans:• Oceans are polluted by oil on a daily basis from oil spills,
routine shipping, run-offs and dumping. 16

9
17Urban Water Cycle (Induced by human)
Parameters of Water Quality1. Physical Water Quality
– Turbidity, Color, Taste & Odor, Total Solids, Suspended Solids, Total Dissolved Solids, Temperature, etc.
2. Chemical Water Quality – pH, Alkalinity, Hardness, Chlorides, Fe and
Manganese, Sulfates, Nitrogen compounds, Dissolved oxygen, Biological oxygen demand, Chemical oxygen demand, etc.
3. Microbiological Water Quality– Microorganism: Bacteria, Algae, Protozoa, Viruses– Indicator organism: Coliforms
18

10
• Total Suspended Solids (TSS)o include colloids, supra-colloids, and settleable solids.
• Total Dissolved Solids (TDS)o Dissolved Solids are the solids that can be recovered
from water by evaporating the water after filtering the suspended solids
• Total Solids (TS) o Total solids in water and wastewater include
suspended solids and dissolved solids (TS= TSS + TDS).• Color
o Types: True color caused by dissolved solids; Apparent color caused by suspended solids and includes true color.
o Measured by Colorimeter or Spectrophotometer (Units: True Color Unit)
19
• Turbidityo Turbidity measures the clarity of water containing
colloidal material (cloudy water).o Measured by Turbidimeter (Units: Nephlometric
Turbidity Unit, NTU)
20
• Dissolved Oxygen (DO) o Dissolved Oxygen (DO) is generally considered to be
one of the most important parameters of water quality in streams, rivers, and lakes.
o The higher the concentration of dissolved oxygen in water body, the better is the water quality.
11
21
• pH (hydrogen ion concentration)o Water (H2O) dissociate slightly to H+ and OH-:
H2O ↔ H+ + OH-
o pH is an intensity factor.- pH = 7: Neutral- pH < 7: Acidic- pH> 7: Alkaline
o pH of most raw water sources: 6.5 - 8.5 o Significance:
- Influences the chemical and biological reactions in water and wastewater treatment plant respectively.
- Corrosion problems (low pH)- Many industrial waters require rigid pH control- Optimum pH required for fish and other aquatic life
• Alkalinity– Ability of water to neutralize acids (buffering
capacity of water). – Alkalinity is mostly due to bicarbonates (HCO3
-), of Ca, Mg, and Na.
– Highly alkaline water often has a high pH and generally contains high levels of dissolved solids (harmful for water to be used in boilers and food processing).
– Significance:
- Prevent sudden change of pH in aquatic system- Influences the chemical and biological reactions in
water and wastewater treatment plant respectively.
22

12
• Hardness– Hardness is a characteristics of water that prevents
lathering of soap and produces scale in hot water pipes and heaters
– Hardness is due to the presence of calcium (Ca) and magnesium (Mg) which is common in groundwater
– Significance:
- Scale build-up in boilers and hot water pipe- Excessive soap usage- Spotted dishes, glasses and silverware
23
• Iron (Fe) and Manganese (Mn)– Ground waters that are devoid of dissolved oxygen
can contain appreciable amounts of (Fe2+) & (Mn2+).– Iron in concentrations greater than 0.3 mg/L and
manganese in concentrations greater than 0.05 mg/L is considered significance.
– Significance: Brown and black stains on laundry and plumbing fixtures A metallic taste of water may be present.
• Trace Metals– Trace metals include those metals that are harmful
and toxic in relatively small amounts. – The main source of these metals is the discharges of
industrial wastewater.– Examples of trace metals: arsenic, cadmium,
chromium, mercury, lead, silver and barium.24

13
• Nitrogen compounds– Inorganic: Ammonia NH3, Nitrite NO2
-, Nitrate NO3-
– Organic: Protein, amino acids– Main Sources: Discharge of domestic, agricultural (fertilizers), industrial
wastewater. Animal wastes and decomposition of dead plants,
animal.– Significance: Drinking of water with high nitrate content (NO3
-) causes Blue-baby disease in infants. Presence of nitrogen compounds along with
phosphorus in water bodies cause eutrophication
25
• Organic Matter– Organic compounds are composed mainly of carbon
and hydrogen along with other elements such as oxygen, nitrogen, phosphorus, and sulfur.
– Organics can be classified on the basis of their origin into: Natural organics (e.g. plants and animal tissues, human feces) Synthetic organics (e.g. plastics, rubber)
– Based on their microbial degradation, organics can be: Biodegradable
Non-biodegradable
– Methods of measurement the organic concentration in water: Biochemical Oxygen Demand, BOD Chemical Oxygen Demand, COD
26
14
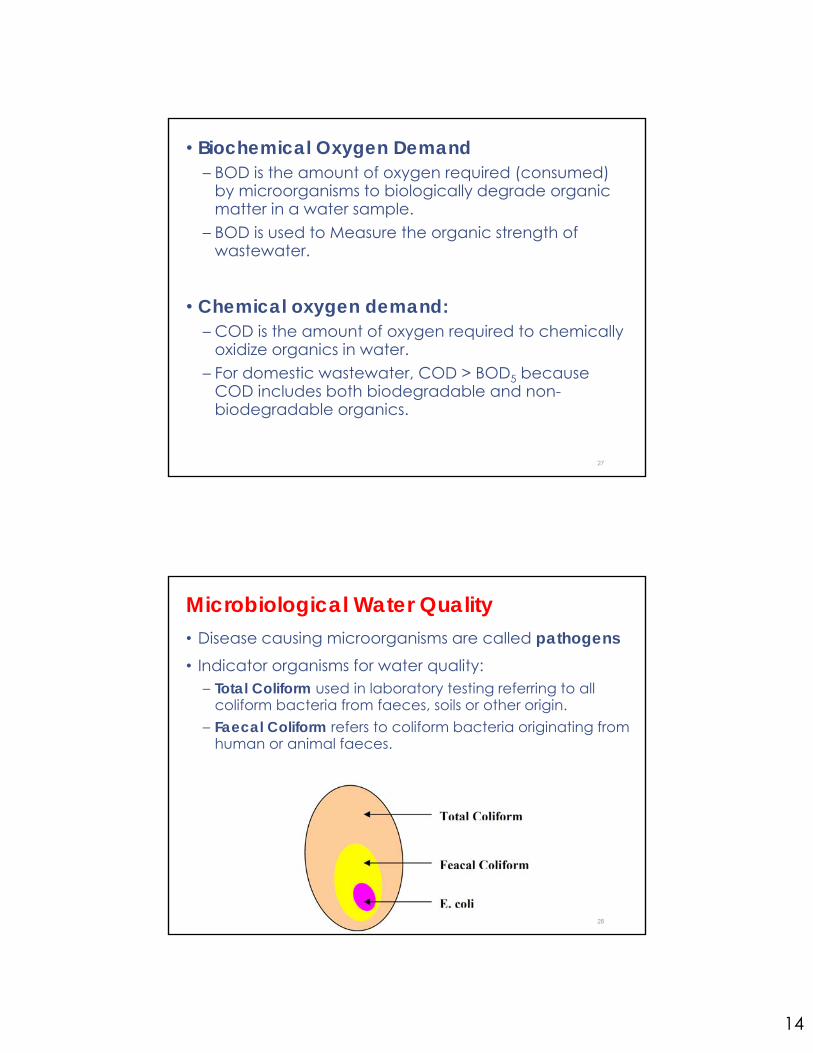
• Biochemical Oxygen Demand– BOD is the amount of oxygen required (consumed)
by microorganisms to biologically degrade organic matter in a water sample.
– BOD is used to Measure the organic strength of wastewater.
• Chemical oxygen demand:– COD is the amount of oxygen required to chemically
oxidize organics in water.– For domestic wastewater, COD > BOD5 because
COD includes both biodegradable and non-biodegradable organics.
27
Microbiological Water Quality• Disease causing microorganisms are called pathogens• Indicator organisms for water quality:
– Total Coliform used in laboratory testing referring to all coliform bacteria from faeces, soils or other origin.
– Faecal Coliform refers to coliform bacteria originating from human or animal faeces.
28

15
History of water pollution control
29
Waterborne Disease
Organic pollution in receiving water bodies
Pollution by toxic chemicals & heavy metals
Eutrophication (N & P)
Micro-pollutantsRefractory chemicals
Development of water supply & sewerage system
Cleaner technology Decentralized system
WWTP constructed End-of-Pipe technology
Increase in urban population &
poor sanitation
Industrial evolution
Intensive agriculture
High-tech society & modern life style
Background Type of water pollution Technological Measures
Source control
Advanced WWTP Nutrient recovery

1
Water Pollutionpart-2- Type of Water Pollution- e.g. of Water Pollution Control
GE 302 – Industry and the EnvironmentTopic 4
Department of Civil Engineering College of EngineeringKing Saud University
Type of Water Pollution: 1. Thermal Pollution
2. Soil Erosion and sediment Control
3. Stream Pollution
4. Lake Pollution
5. Groundwater Pollution
6. Ocean Pollution
2
2
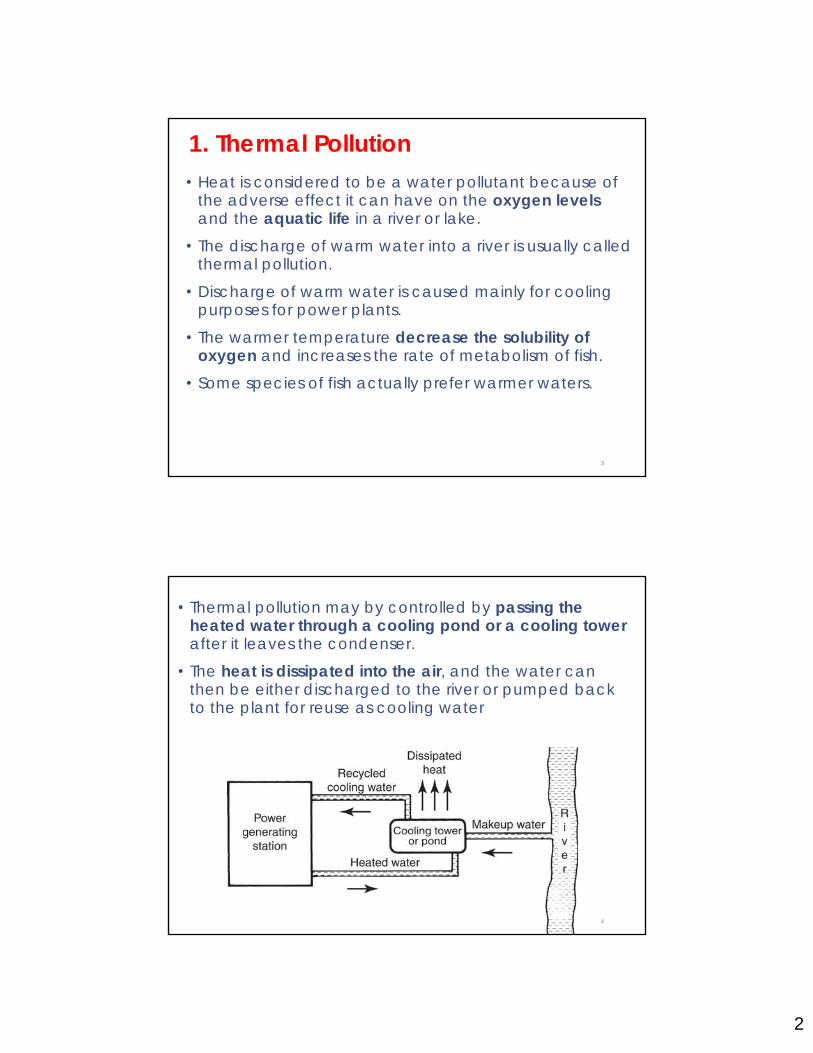
• Heat is considered to be a water pollutant because of the adverse effect it can have on the oxygen levels and the aquatic life in a river or lake.
• The discharge of warm water into a river is usually called thermal pollution.
• Discharge of warm water is caused mainly for cooling purposes for power plants.
• The warmer temperature decrease the solubility of oxygen and increases the rate of metabolism of fish.
• Some species of fish actually prefer warmer waters.
3
1. Thermal Pollution
• Thermal pollution may by controlled by passing the heated water through a cooling pond or a cooling towerafter it leaves the condenser.
• The heat is dissipated into the air, and the water can then be either discharged to the river or pumped back to the plant for reuse as cooling water
4
3
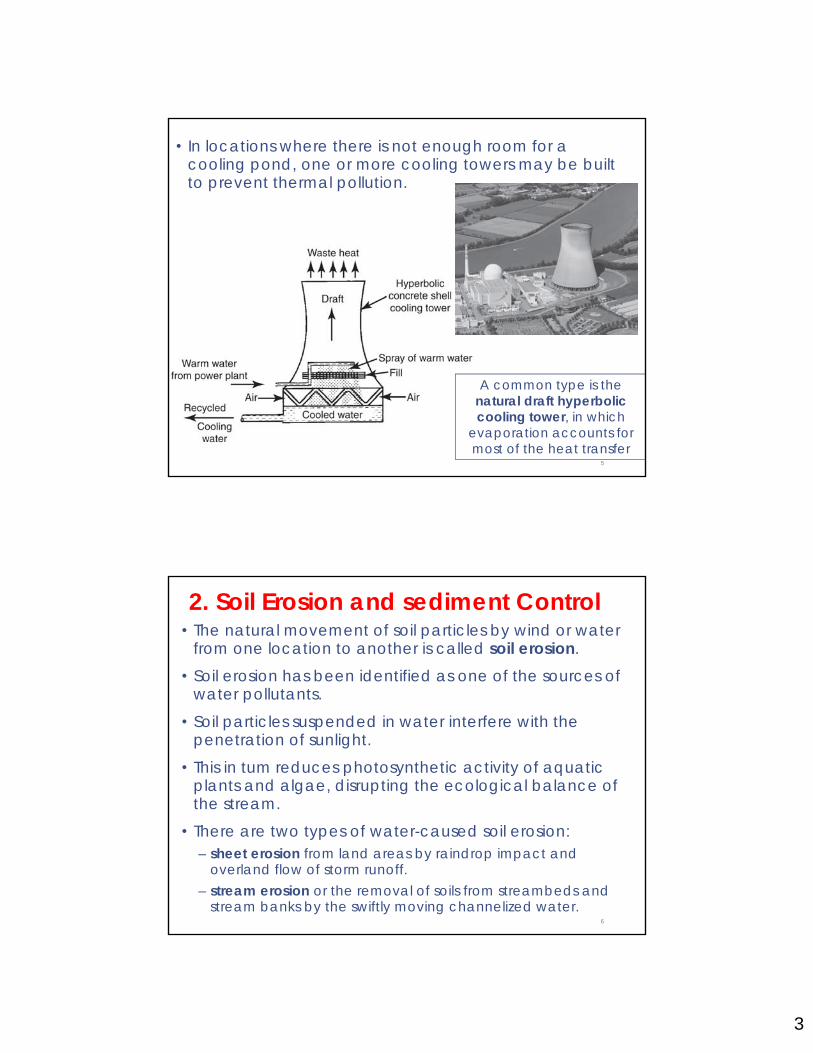
• In locations where there is not enough room for a cooling pond, one or more cooling towers may be built to prevent thermal pollution.
5
A common type is the natural draft hyperbolic cooling tower, in which
evaporation accounts for most of the heat transfer
• The natural movement of soil particles by wind or water from one location to another is called soil erosion.
• Soil erosion has been identified as one of the sources of water pollutants.
• Soil particles suspended in water interfere with the penetration of sunlight.
• This in tum reduces photosynthetic activity of aquatic plants and algae, disrupting the ecological balance of the stream.
• There are two types of water-caused soil erosion: – sheet erosion from land areas by raindrop impact and
overland flow of storm runoff. – stream erosion or the removal of soils from streambeds and
stream banks by the swiftly moving channelized water.6
2. Soil Erosion and sediment Control

4
• When the water velocity decreases, the suspended particles settle out and are deposited as sediment at the bottom of the stream or lake.
• Sediment smothers benthic, or bottom-dwelling, organisms and disrupts the reproductive cycles of fish and other life forms.
• Some of the more common best management practices (BMPs) include the following:– Temporary grass cover on exposed soils to reduce wind and
water erosion.– Hay bales can be placed around stormwater inlets to
intercept sediment.– Diversion channels can be constructed across slopes to
reduce open slope length.– Channel stabilization for streams and drainage ditches.
7
8
A typical hay bale and gravel filter, which prevents sediment
from entering a drainage system and then local streams, is usually
used in the vicinity of active construction sites.
Diversion channels reduce the distance of overland sheet flow, thereby reducing soil
erosion and sedimentation of nearby streams and lakes.

5
• The flowing water carries algae rapidly downstream and tends to discourage the growth of rooted plants on the stream bed.
• To a limited extent, streams and rivers have the ability to assimilate or degrade biodegradable wastes. Thus, they can recover from the effects of pollution naturally, without significant or permanent environmental damage.
• The capacity for self-purification depends on:– the strength and volume of pollutants, – the stream discharge or flow rate, – the level of turbulence in the water as it may cascade over
rocks and boulders in the stream channel
• It used to be said that: the solution to pollution is dilution9
3. Stream Pollution
• The effect of oxygen transfer between the air and the water (reaeration) is important factor for natural purification.
• Fast-flowing, shallow, turbulent streams are reaerated more effectively than slow, deep, twisting streams.
• Modem-day population densities are too high for most streams and rivers to assimilate raw sewage discharges.
• Some degree of treatment is required to remove enough of the BOD from the sewage so that stream can finish the job of the purification.
• A level of treatment called secondary treatment is generally sufficient for this purpose; it is the minimum level of treatment required.
10

6
• There are two basic steps involved in the process of waste assimilation in a stream or river:1. Physical processes of dilution and reaeration occur.2. Biological processes occur, in which microorganisms in
the water use dissolved oxygen to metabolize organic pollutants and convert them into harmless substances.
11
Dilution
• One input to the system is a stream with a flow rate Qs(volume/time) and pollutant concentration Cs(mass/volume).
• The other input is assumed to be a waste stream with flow rate Qw and pollutant concentration Cw.
• The output is a mixture with flow rate Qm and pollutant concentration Cm
Dilution

7
Example_1:A stream flowing at 10.0 m3/s has a tributary feeding into it with a flow 5.0 m3/s. The stream's concentration of chlorides upstream of the junction is 20 mg/L and the tributary chloride concentration is 40 mg/L. Treating chlorides as a conservative substance, and assuming complete mixing of the two streams, find the downstream chloride concentration.
13
Solution
14
C Q C Q C Q
C20 10 40 5 mg/L · m /s
10 5 m /s26.7mg/L
Q Q Q
CC Q C Q
QC Q C QQ Q
8
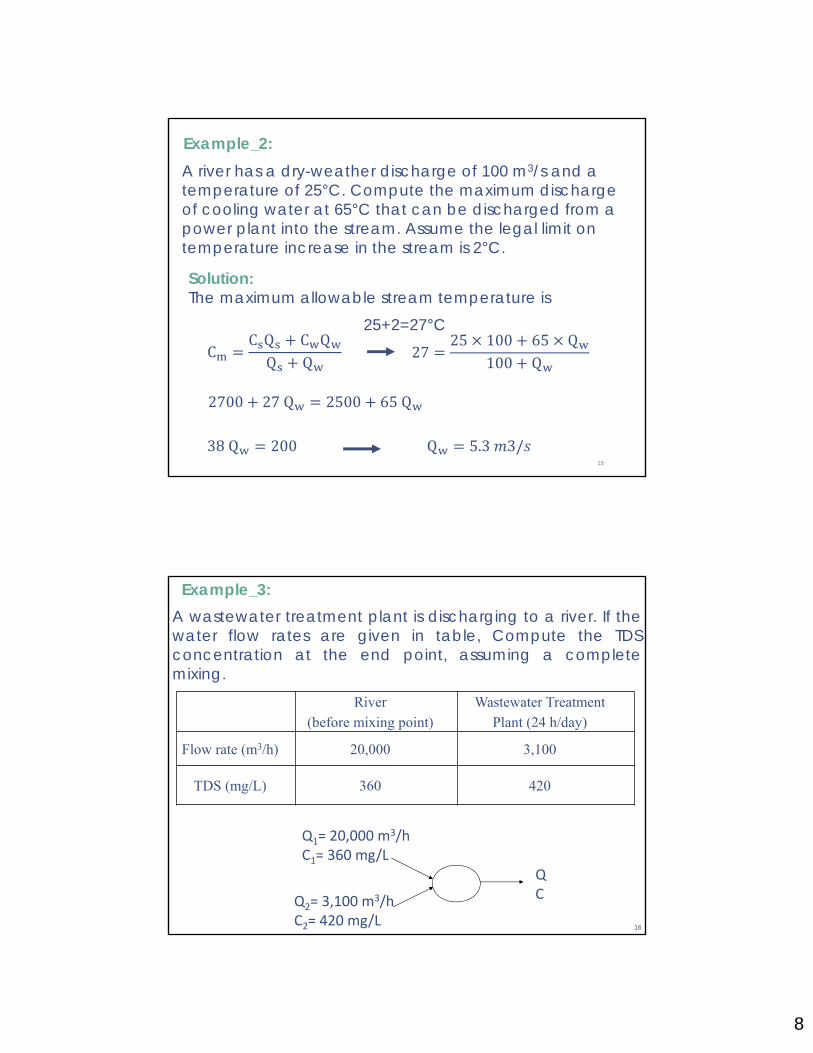
Example_2:A river has a dry-weather discharge of 100 m3/s and a temperature of 25°C. Compute the maximum discharge of cooling water at 65°C that can be discharged from a power plant into the stream. Assume the legal limit on temperature increase in the stream is 2°C.
15
Solution:The maximum allowable stream temperature is
25+2=27°CC
C Q C QQ Q
2725 100 65 Q
100 Q
2700 27Q 2500 65Q
38Q 200 Q 5.3 3/
16
A wastewater treatment plant is discharging to a river. If thewater flow rates are given in table, Compute the TDSconcentration at the end point, assuming a completemixing.
River (before mixing point)
Wastewater Treatment Plant (24 h/day)
Flow rate (m3/h) 20,000 3,100
TDS (mg/L) 360 420
Example_3:
Q1= 20,000 m3/h
C1= 360 mg/L
Q2= 3,100 m3/h
C2= 420 mg/L
Q C

9
17
Q = Q1+Q2 = 20,000 m3/h + 3,100 m3/h = 23,100 m3/h
Q1C1+Q2C2 = 20000 * 360 + 3100 * 420 = 8,502,000
C = [ Q1C1+Q2C2 ] / [ Q1+Q2 ] = 8,502,000 / 23,100
C = 368 mg/l
Q1= 20,000 m3/h
C1= 360 mg/L
Q2= 3,100 m3/h
C2= 420 mg/L
Q C
Solution of example-3:
18
If the wastewater is released during some hours, notcontinuous flow, equalization tanks may be used toreduce the flow rates.
New flow rates, can be found by Equalized flow rate:
New flow rates = Total discharge volume/24= originalflowrate

10
19
Example_4: A factory and WWT plant discharges in to a river.Based on the below table; determine TDS after junction
1) Within and out of working hours of factory2) Using the equalization tank in factory
River (before mixing point)
Wastewater Treatment Plant
Factory
Flow rate (m3/h) 20,000 3,100 800
Working hours daily
24 6
COD (mg/L) 14 70 420
TDS (mg/L) 360 420 2,600
20
1.1) Within working hours of factoryTDS=[ 20,000 * 360 + 3100 * 420 + 800 * 2600 ]/
[ 20,000 + 3,100 + 800] = 442.8 mg/L
River (before mixing point)
Wastewater Treatment Plant
Factory
Flow rate (m3/h) 20,000 3,100 800Working hours daily 24 6COD (mg/L) 14 70 420TDS (mg/L) 360 420 2,600
Solution of example-4:
1.2) Out of working hours of factoryTDS= [ 20,000 * 360 + 3,100 * 420 ]/
[ 20,000 + 3100 ] = 368.1 mg/L
2) Using equalization tankTDS = [ 20,000*360 + 3100*420 + 800*2600*6/24 ] /
[ 20000 + 3100 + 200 ] = 387.2 mg/L

11
• When sewage is discharged into a stream, dissolved oxygen is utilized by microorganisms as they metabolize and decompose organic substances from the wastewater.
21
Dissolved Oxygen Profile
The oxygen sag curve shows the effect of organic pollution on the DO levels in a stream or river. After the organics decompose, surface reaeration will restore the original water quality. This is called stream self-purification.
The minimum dissolved oxygen content in the stream occur when the rate of reaeration equals the rate of deoxygenation.
22
Dissolved Oxygen Profile
Under heavy loads of pollution, the DO level may drop to zero. This results in hateful odors and very unsightly conditions in the water. With additional time and distance downstream, the water will eventually be reaerated and water quality will be restored.

12
• Most streams that are polluted by a point source of biodegradable organic substances can be described and evaluated in terms of four distinct zones.
23
Zones of Pollution
• Most streams that are polluted by a point source of biodegradable organic substances can be described and evaluated in terms of four distinct zones.
24
Zones of Pollution

13
• Water in lakes is not moving much and is detained for a relatively long period of time, that mean self-purification will requires more time not like river and stream.
• In lakes, water quality may be more dependent on plant nutrients than on organics from sewage.
• Phosphorus and nitrogen are the most critical plant nutrients.
• When pollutants containing phosphorus and nitrogen compounds accumulate in a lake, rooted aquatic plants and free-floating algae may grow plentifully.
• The algae and aquatic weeds eventually die and settle to the bottom of the lake, where they are decomposed by bacteria and protozoa.
• This exerts an oxygen demand on the water and may deplete the DO in parts of the lake. 25
4. Lake Pollution
• The process of nutrient enrichment and gradual accumulation in a lake, as just described, is a natural process. It is called eutrophication and can be thought of as an inevitable an continual aging of the lake.
26
• Four stages in the life of a lake. All lakes go through a natural aging process called eutrophication. Human activity often accelerates this process.
• Cultural (or anthropogenic) eutrophication is the acceleration of the natural aging process due to human activity.

14
• Groundwater is usually of excellent quality. This is primarily because of the natural filtration that occurs in the layers of soil through which the water slowly moves underground.
• An increasing number of contaminated groundwater in certain locations have been reported.
• The contaminants come from many different sources and include a variety of materials, most notably synthetic organic chemicals.
• Of all types of water pollution, this synthetic organic chemicals is perhaps the most insidious because at low concentrations the contaminants rarely impart any noticeable taste or odor to drinking water.
27
5. Groundwater Pollution
Sources of Groundwater Contamination:1. Improper disposal of wastes, such as unlined landfills
or industrial sewage lagoons.2. Accidental spills of hazardous substances, especially
from industrial activities.3. Petroleum products leaking from old underground
storage tanks (USTs).4. Mining and petroleum production, especially from
hydraulic fracturing technology.5. Subsurface sewage disposal systems.6. Agricultural activities.7. Saltwater Intrusion.
28

15
• Diagram showing two sources of ground water pollution from industrial waste disposal a leaky surface impoundment or lagoon and deep well wastewater injection.
• The arrows indicate the direction of flow of the pollutants.
• A bottom liner for the lagoon and thorough geological exploration of the saline aquifer can help prevent the pollution.29
• Groundwater can be polluted from on-site sewage disposal systems.
• Wells located downhill from septic absorption fields are susceptible to contamination.
30

16
Water cycle in hydraulic fracturing. (Courtesy of the U.S. EPA)31
• Natural purification of chemically contaminated groundwater can take decades and perhaps centuries, and cleanup efforts are sometimes much too expensive to be practical.
• If an aquifer that supplies drinking water is polluted, it may be necessary to abandon the contaminated well(s) and drill new ones some distance away.
• The best way to control groundwater pollution is to prevent it from occurring in the first place.
• Laws related to solid and hazardous waste disposal significantly reduce new contamination.
32

17
• Ocean water is naturally saline (salty), containing about 3.5% dissolved solids (35 grams per liter, or 35,000 mg/L).
• Despite the ocean provide a tremendous reservoir for dilution of pollution, the ocean volume is not infinite, and its capacity to assimilate pollution in estuaries and other sensitive coastal zones between ocean and land is finite and limited
• In some coastal areas, excessive chemical nutrients from sewage and dispersed agricultural runoff can cause seasonal formations of hypoxic areas, in which DO levels drop so low.
• Problems related to degradation of the ocean waters are global in scope.
33
6. Ocean Pollution
Sources of ocean pollution:1. Diffusion of sewage in Seawater.
– Treated sewage effluent from cities and towns is discharged directly into the ocean in many coastal areas.
2. Ocean dumping of sludge– Used in the past but now is banned
3. Oil spills– Accidental discharges of oil into ocean and bay waters
can cause serious ecological damage to marine system.
4. Floating plastic rubbish– Use of biodegradable plastics, as well as an emphasis
on waste recycling and waste minimization can help to mitigate this problem.
34

18
Plastic debris has been found by oceanographers to accumulate primarily in five regions 35
• Standards were established to limit the amount of pollutants discharged into streams, lakes, and coastal waters
• Water quality standards are limits on the amount of physical, chemical, or microbiological impurities allowed in water that is intended for a particular use.
• There are three different types of water quality standards: 1. Stream standards
– classification of surface waters on the basis of their beneficial use.
2. Effluent standards.3. Drinking water standards.
36
Water Quality Standard

19
Three different types of water quality standards are enforced by the regulatory agencies to protect public
health and environment. 37
38
Saudi Arabian Drinking Water Standards (bottled water)
(Ministry of Municipal and Rural Affair, 1426)

20
39
• Water Treatment Plant
• Wastewater Treatment Plant
• Oil Spill treatment methods
• Produced Water Treatment
Examples of Water Pollution Control
Flow diagram of a typical Surface Water treatment plant
40
Coagulant chemicals
added
Flocculation basin
Sedimentation basin
Coa
gula
tion
ba
sin Sand filtration
Disinfection
High-lift pump
Potable water to
distribution system
SludgeDirty
backwash water
To disposal
• Screens keep debris and large objects out of the plant• Low-pressure pumps lift the water to the coagulation tank• Coagulation-flocculation, sedimentation, and sand filtration
remove turbidly, suspended solids, some of dissolved solids, and clarify the water (Clarifications)
• Disinfection destroys pathogenic organisms• High-pressure pumps deliver potable water to the consumers
Raw water From river
or lake
Intake screen
Low-lift pumps

21
Flow diagram of a typical Groundwatertreatment plant
41
• Aeration removes gases and convert soluble iron and manganese to insoluble precipitate
• Membrane filtration, like reverse osmosis, removes dissolved solids
Gro
und
wat
er
From
wel
lCoagulant chemicals
added
Flocculation basin
Sedimentation basin
Coa
gula
tion
ba
sin Sand filtration
Disinfection
High-lift pump
Potable water to distribution
system
SludgeDirty
backwash water
To disposal
Brine water
Membrane filtration
High-lift pumps
Aeration
Reverse Osmosis (RO) units

22
Schematic of conventional Wastewater Treatment Plant
(Biological Treatment)
43
Aerial view of Wastewater Treatment Plant
23
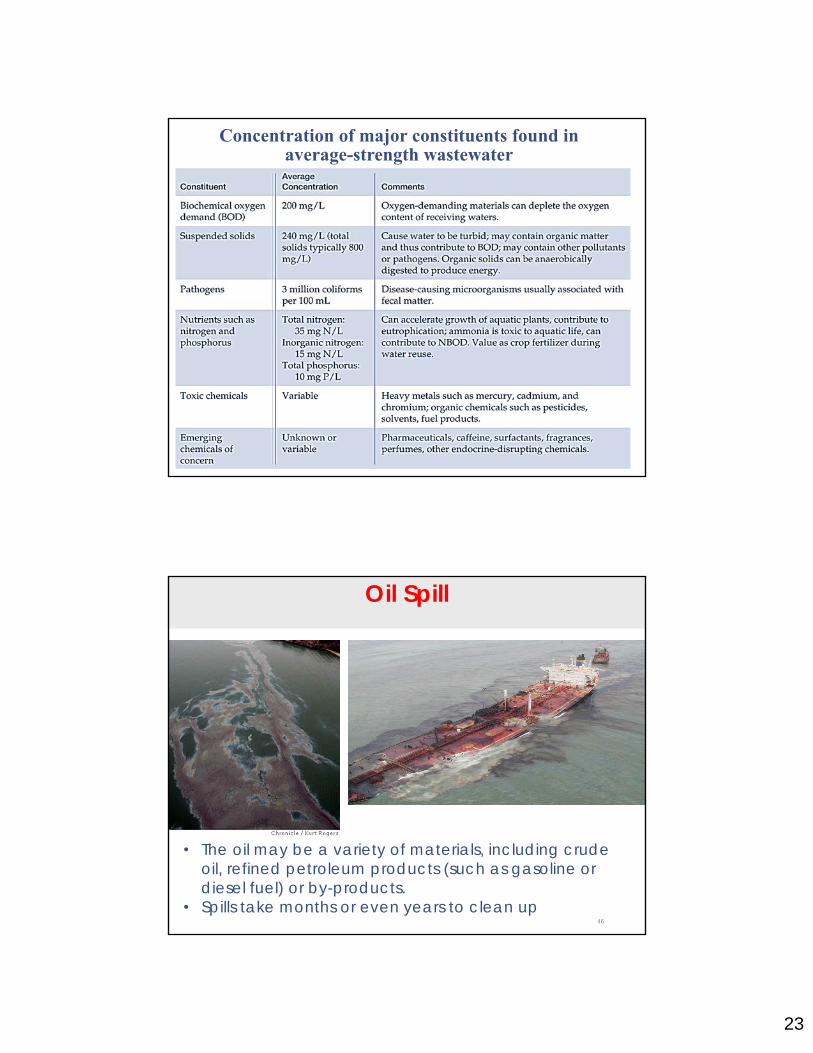
Concentration of major constituents found in average-strength wastewater
46
• The oil may be a variety of materials, including crude oil, refined petroleum products (such as gasoline or diesel fuel) or by-products.
• Spills take months or even years to clean up
Oil Spill

24
Methods for Cleaning up Oil spills1) BoomsOil boom is a floating barrier, which is used in cleaning up oil
on the surface of the water. Boom is used to contain oil, to collect oil, as a barricade to exclude oil from a certain area.
2) Oil Spill SkimmersSkimming is a process of removing oil from the top of the
water surface. This is achieved by the use of various mechanical devices such as pumps and vacuum systems.
47
3) SorbentsSorbent booms and barriers are used to absorb a moving oil
slick. They only work well when a slick is thin, because once their surfaces are saturated, they cannot absorb anymore.
4) In-situ BurningThrough controlled burning of the oil can effectively remove
the oil slick. This method is called in-situ burning.
5) BioremediationOil, like many natural substances, will biodegrade over a period of time into simple compounds such as carbon dioxide, water and biomass. Bioremediation is the term used to describe a range of processes, which can be used to accelerate natural biodegradation.
48

25
6) Manual CleanupThe other best way to clean up oil once it has hit the shore is by
manual cleanup.
7) DispersantsDispersants are chemicals, which have components of surface-
active agents called surfactants. The dispersants aids in the breaking up of the oil slick into smaller droplets.
49
Produced Water
50
• Is a byproduct water along with the oil and gas production.
• Oil wells have more produced water than gas wells• Waterflooding (or water injection) is a technique that
often used to increase the production of oil wells.

1
Air Pollution and Control
Department of Civil Engineering College of EngineeringKing Saud University
GE 302 – Industry and the EnvironmentTopic 5
•Air is necessary for the survival of all higher forms of life on earth. On the average, a person needs at least 13 kg of air every day to live, but only about 1.4 kg of water and 0.7 kg of food.• Scientific studies have demonstrated that over the
long term, the standard of health for people living and working in urban areas is lower than that for populations in rural areas, where air pollution is much less severe.• There is much scientific evidence of a distinct
relationship between generally dirty air and a higher incidence of respiratory diseases, including lung cancer. • There is also compelling evidence that air pollution
has a significant and lasting worldwide (global) impact on the Earth's climate.

2
Atmospheric Layers
Atmospheric layers is
divided into 5 layers, based on increase or decrease of temperature with altitude.
3
Exosphere
Troposphere
Stratosphere
Mesosphere
Thermosphere
Composition of the Atmosphere• Dry air in the troposphere (the lowermost atmospheric
layer) is a mixture of molecular of:78 % Nitrogen by volume21 % Oxygen by volume1 % Other gases: argon(about 0.9 %), carbon dioxide,
methane, and water vapor.
• The relative amount or concentrations of gases in air can be expressed in terms of parts per million (ppm) and in terms of percentage. • For example, since 1 % = 10,000 ppm, an oxygen level
of 21 % in air can also be expressed as 210,000 ppm.• The concentration of carbon dioxide (CO2) in the
atmosphere, now close to 0.04%, may be more conveniently expressed as 400 ppm.
4

3
• The troposphere, contains about 80 % of the total air mass. • It is in this relatively thin layer of air that oxygen-
dependent life is sustained, clouds are formed, weather patterns develop, and most air pollution problems occur.• The density of air (about 1.23 kg/m3 at sea level)
decreases significantly with an increase in altitude.• Troposphere layer is about on average 12 km depth• Troposphere is deeper in the tropics, up to 20 km, and
shallower near the polar regions, approximately 7 km
5
Effects of Weather •Air pollutants are mixed, dispersed, and diluted within
the troposphere by movement of air masses, both horizontally and vertically.•Air movements and therefore air quality are very
dependent on local and regional weather conditions.• Knowledge of horizontal and vertical circulation
patterns of air is of importance with regard to:–site selection for new industrial plants.–design of tall stacks or chimneys.
6
4
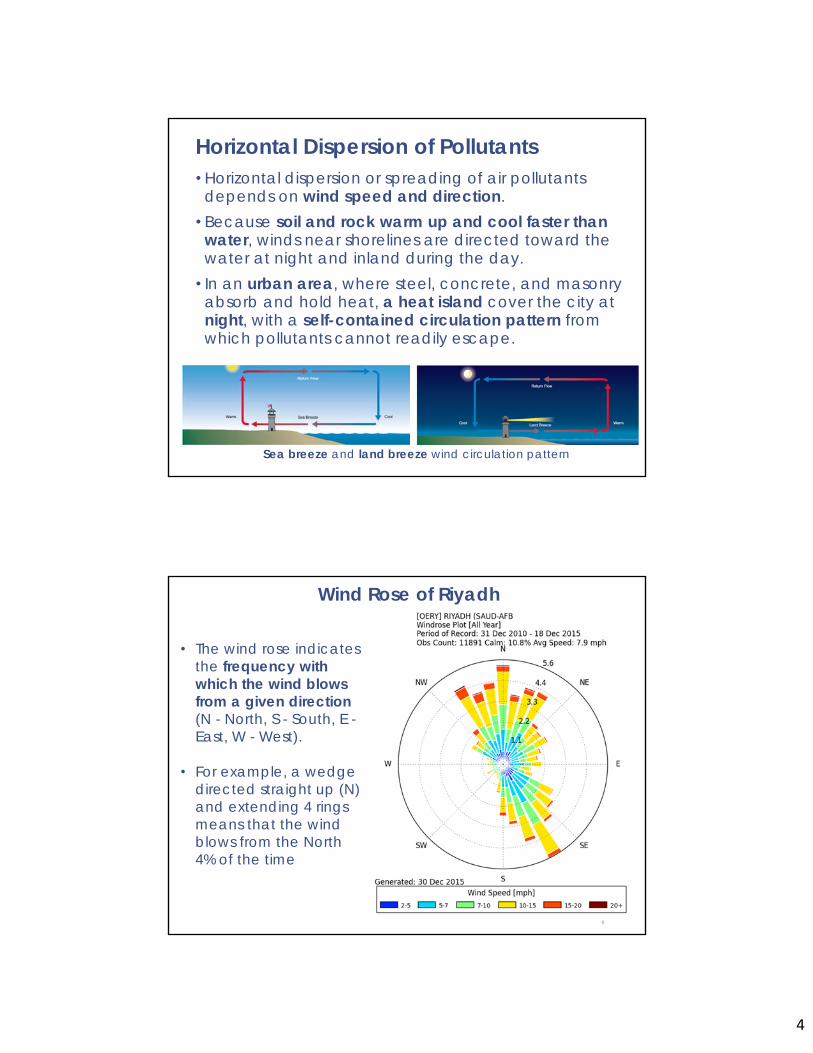
Horizontal Dispersion of Pollutants• Horizontal dispersion or spreading of air pollutants
depends on wind speed and direction.• Because soil and rock warm up and cool faster than
water, winds near shorelines are directed toward the water at night and inland during the day.• In an urban area, where steel, concrete, and masonry
absorb and hold heat, a heat island cover the city at night, with a self-contained circulation pattern from which pollutants cannot readily escape.
Sea breeze and land breeze wind circulation pattern
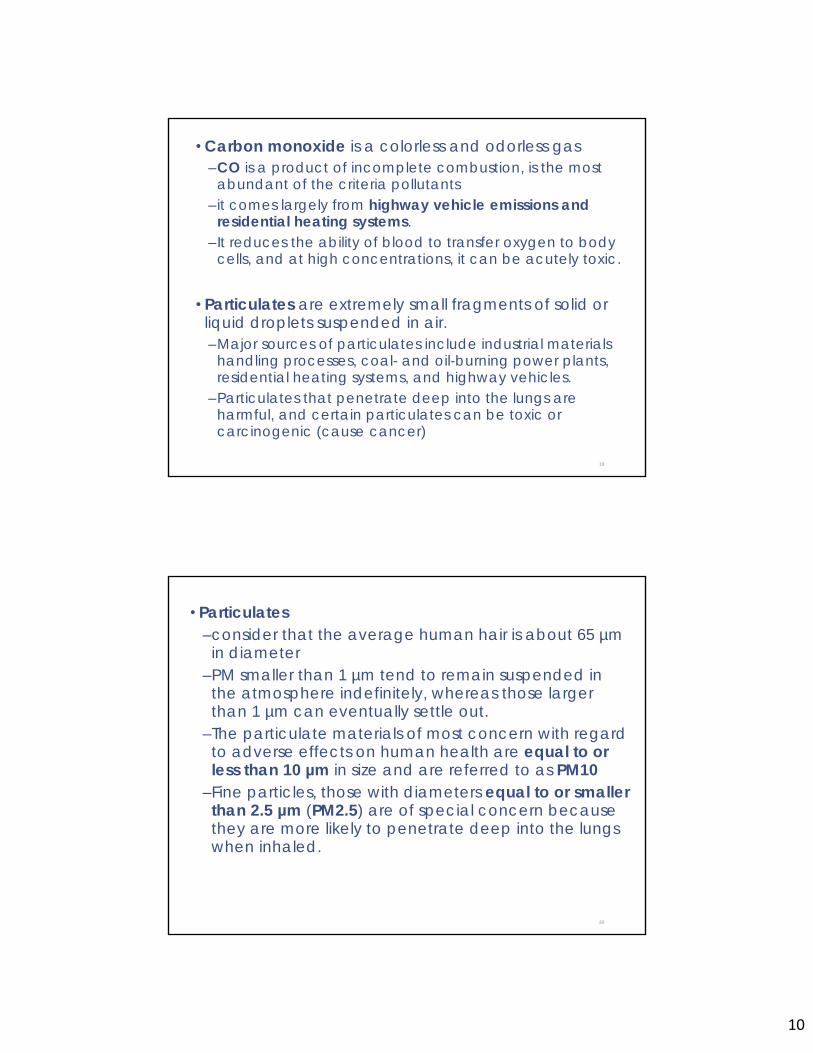
Wind Rose of Riyadh
8
• The wind rose indicates the frequency with which the wind blows from a given direction (N - North, S - South, E -East, W - West).
• For example, a wedge directed straight up (N) and extending 4 rings means that the wind blows from the North 4% of the time

5
Vertical Dispersion of Pollutants• Vertical mixing of air and dispersion of pollutants
depends on the kind of atmospheric stability prevailing at any given time.• The atmosphere is considered to be stable when there
is little or no vertical movement of air masses and therefore little or no mixing and dispersion of pollutants in the vertical direction.•An unstable atmosphere, on the other hand, is one in
which the air moves naturally in a vertical direction, increasing mixing and dispersion of the pollutants.•With regard to local or regional air quality, a condition
of atmospheric instability is preferable to a stable condition.
Vertical Dispersion of Pollutants
•Air stability depends on the rate of change of air temperature with altitude, called the temperature gradient.• The rate at which air temperature drops with increasing
altitude in the troposphere is called the environmental lapse rate.• The dry adiabatic lapse rate is the lapse rate of a dry
mass of air which expands and cools as it rises. This rate is typically -10 °C per 1 km (or -1 °C per 100 m).•Dry adiabatic lapse rate is independent of the
prevailing atmospheric temperature gradient at any given time.
10

6
Vertical Dispersion of Pollutants•When the environmental lapse rate exceeds the
adiabatic lapse rate, the atmosphere is unstable and vertical mixing of air masses will occur•A lapse rate characterized by an increase in air
temperature with increasing altitude, called a temperature inversion, results in an extremely stable condition.–This prevents the upward mixing of pollutants and a
major cause of severe air pollution episodes.
11
12
Illustration of unstable atmospheric conditions, when the environmental lapse rate (e.g., –2° per 100 m) exceeds the adiabatic lapse rate. In this example, buoyant forces keep the air parcels moving in a vertical direction.

7
13
When a temperature inversion begins above the ground because of local weather conditions, it acts as ceiling that prevents further vertical mixing and traps pollutants below it
14
• Trapping of pollutants below the inversion, allowing them to build up.
• If the sky is very hazy, or is sunsets are very red, there is likely an inversion somewhere in the lower atmosphere.
• This happens more frequently in high pressure zones, where the gradual sinking of air in the high pressure dome typically causes an inversion to form at the base of a sinking layer of air.
Tem
pera
ture
Inve
rsio
n

8
Type of Air Pollution•Air pollution may be simply defined as the presence of
certain substances in the air in high enough concentrations and for long enough durations to cause undesirable effects.–"Certain substances" may be any gas, liquid, or solid
• Based on the sources, air pollutants involves:–Primary pollutants: are emitted directly into the air from a
specific source, such as a power plant stack.–Secondary pollutants: are not emitted directly from a
source but are formed in the atmosphere by complex chemical reactions involving the primary pollutants and sunlight (like ozone).
•Air pollution is anthropogenic, that is, caused by human activities. But air pollution may also result from natural causes.
15
• The sources of primary air pollutants are either mobile(e.g., automobiles) or stationary (e.g., coal-fired electric power generating stations).
•Criteria air pollutants that are regulated in many countries are:–Sulfur dioxide (SO2)–Nitrogen oxides (NOx)–Carbon monoxide (CO)–Particulates matter (PM)–Lead (Pb)–Ozone (O3)
•All the criteria pollutants tend to harm human health, diminish environmental quality, and damage property.
16

9
17
Human inputs of air pollutants come from mobile sources (such as cars) and stationary sources (such as industrial, power, and cement plants). Some primary air pollutants react with one another and with other chemicals in the air to form secondary air pollutants.
• Sulfur dioxide, a colorless gas with a sharp, choking odor, –comes primarily from fossil fuel combustion at electric
power plants. – It is one of the causes of acid rain.
•Nitrogen dioxide, a pungent irritating gas – it is also caused by combustion of fossil fuels –can react in sunlight with hydrocarbons to form
photochemical smog.
18Photochemical smog, Santiago, Chile
10
•Carbon monoxide is a colorless and odorless gas–CO is a product of incomplete combustion, is the most
abundant of the criteria pollutants– it comes largely from highway vehicle emissions and
residential heating systems. – It reduces the ability of blood to transfer oxygen to body
cells, and at high concentrations, it can be acutely toxic.
• Particulates are extremely small fragments of solid or liquid droplets suspended in air. –Major sources of particulates include industrial materials
handling processes, coal- and oil-burning power plants, residential heating systems, and highway vehicles.
–Particulates that penetrate deep into the lungs are harmful, and certain particulates can be toxic or carcinogenic (cause cancer)
19
• Particulates–consider that the average human hair is about 65 µm
in diameter–PM smaller than 1 µm tend to remain suspended in
the atmosphere indefinitely, whereas those larger than 1 µm can eventually settle out.
–The particulate materials of most concern with regard to adverse effects on human health are equal to or less than 10 µm in size and are referred to as PM10
–Fine particles, those with diameters equal to or smaller than 2.5 µm (PM2.5) are of special concern because they are more likely to penetrate deep into the lungs when inhaled.
20
11
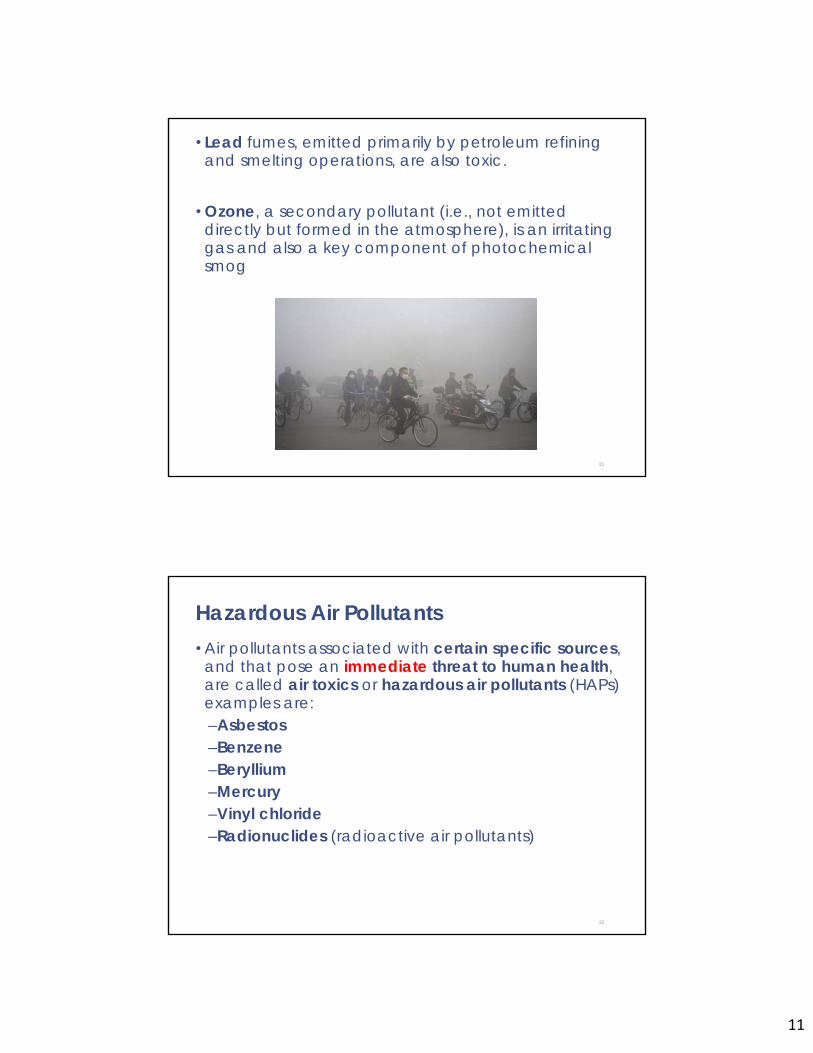
• Lead fumes, emitted primarily by petroleum refining and smelting operations, are also toxic.
•Ozone, a secondary pollutant (i.e., not emitted directly but formed in the atmosphere), is an irritating gas and also a key component of photochemical smog
21
Hazardous Air Pollutants•Air pollutants associated with certain specific sources,
and that pose an immediate threat to human health, are called air toxics or hazardous air pollutants (HAPs) examples are:–Asbestos–Benzene–Beryllium–Mercury–Vinyl chloride–Radionuclides (radioactive air pollutants)
22

12
Gases Concentration Measurement•Concentration of air gaseous pollutants in air are mostly
expressed in volumetric terms
1volumeofgaseouspollutant10 volumeofair
byvolume
• Sometimes concentrations are expressed as mass per unit volume, such as µg/m3 or mg/m3. • The relationship between ppm and mg/m3 depends
on the pressure, temperature, and molecular weight (MW) of the pollutant.• The ideal gas law helps us establish that relationship
23
Conversion between ppm and mg/m3
In general, the conversion from ppm to mg/m3 is given by:
/.
.
Where:MW = molecular weight of the compound (g/mol)T = absolute temperature (K) = °C + 273.15P = absolute pressure (atm) = mmHg/760
/.
24

13
Example_1: The Air Quality Standard for carbon monoxide is 9.0 ppm. Express this standard as a percent by volume and in mg/m3 at 1 atm and 25 °C.
Solution:• Within a million volumes of this air there are 9.0 volumes of
CO, no matter what the temperature or pressure (advantage of the ppm units)
%CO910
100% 0.0009%
• To find the concentration in mg/m3, we need the molecular weight of CO, which is = 12 +16 = 28
/.
.
/.
.
.
CO 10.3 mg/m25
Example_2: Suppose the exhaust gas from an automobile contains 0.75% by volume of sulfur dioxides (SO2). Express this concentration in mg/m3 at 29 °C and 1.0 atm pressure.
Solution:
26
Homework

14
Primary and secondary National Ambient Air Quality Standards (NAAQS)
27
Effects of Ambient Air Pollution•Air pollution is known to have many adverse effects,
including those on:–Human health–Building facades and other exposed materials –Vegetation and agricultural crops –Animals and aquatic habitat–The climate of Earth as a whole
•Generally, air pollution is most harmful to the elderlyand to the baby.
28

15
•Major health effects are categorized as being either:–Acute
short-lasting, but severe, and may even result in death–Chronic
long-term effects usually include respiratory illnesses such as asthma and perhaps lung cancer
–Temporaryeffects include intermittent periods of eye or throat irritation, coughing, chest pain, …
• Typical effects of sulfur dioxide, oxides of nitrogen, and ozone include eye and throat irritation, coughing, and chest pain.•A threshold level for a given pollutant is a minimum
level below which there will be no health effects.
29
Worldwide Air Quality Issues•Air pollution problems are not necessarily confined to
a local or regional scale. Atmospheric circulation can transport certain pollutants far away from their point of origin, expanding air pollution to continental or global scales•Worldwide air quality issues:
–Acid rain–Global warming –Ozone layer depletion
30

16
Acid Rain• acid rain, for example, occurs largely on a regional and
a continental scale. It has killed fish and plant life in thousands of lakes in Europe, China, Canada, and the northeast United States. • It also causes deterioration of metals, concrete, painted
surfaces, and other exposed objects.•Acid rain is caused by emission of sulfur and nitrogen
oxides, mostly from electric power plants.
31
Global Warming• The current trend of increasing average temperatures
is believed by most scientists to be caused by the accumulation of carbon dioxide and other greenhouse gases emitted as a result of human activities.•Global warming may lead to melting of glaciers and a
rise in sea levels, as well as adversely affecting ecosystems in some parts of the world
32

17
Global W
arming
33
The amount of incoming energy from the sun is in equilibrium with the energy radiated and reflected back into space. The atmosphere acts as a "blanket" that regulates average temperatures at the Earth's surface. The "thicker" the blanket (i.e., the more "greenhouse gases" in the atmosphere), the warmer is the temperature in the lower atmosphere and Earth's surface.
Infrared Radiation (Heat Radiation)
34
• Infrared (IR) radiation is just as important to the Earth's weather and climate as sunlight is.
• This is because, for all of the sunlight that the Earth absorbs, an equal amount of IR radiation must travel from the Earth back to outer space.
• If this was not the case, there would be global warming or global cooling.
18
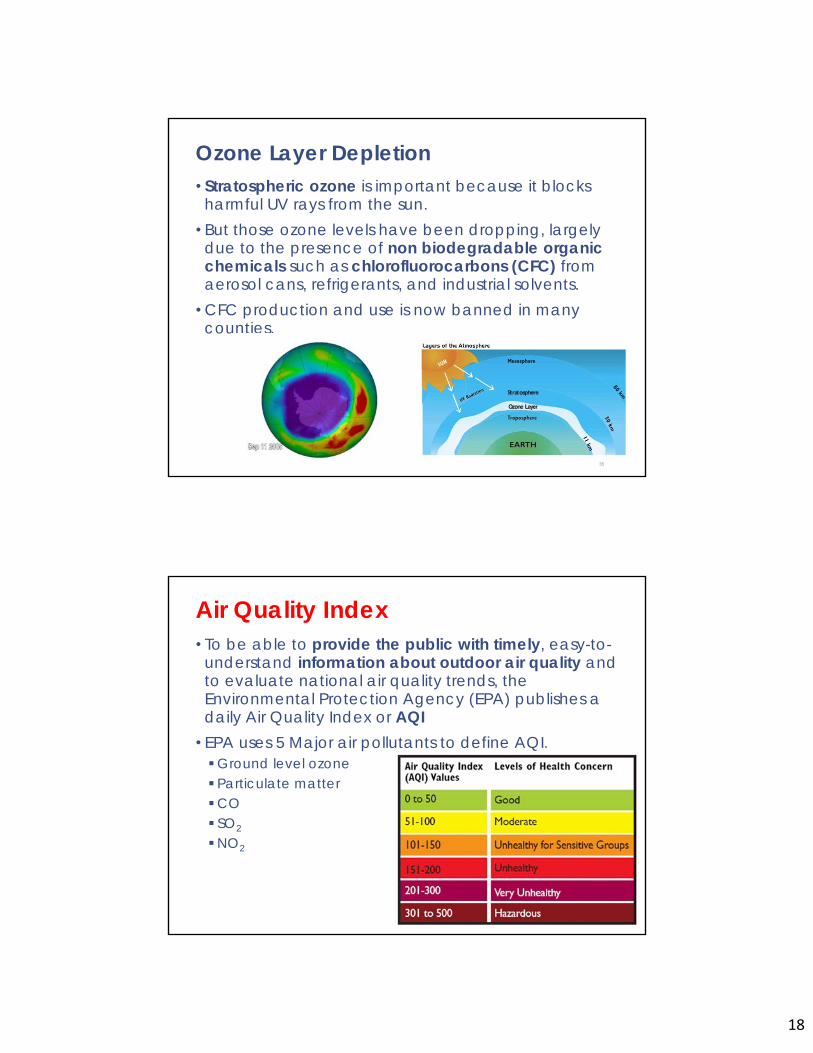
Ozone Layer Depletion• Stratospheric ozone is important because it blocks
harmful UV rays from the sun.• But those ozone levels have been dropping, largely
due to the presence of non biodegradable organic chemicals such as chlorofluorocarbons (CFC) from aerosol cans, refrigerants, and industrial solvents. •CFC production and use is now banned in many
counties.
35
Air Quality Index• To be able to provide the public with timely, easy-to-
understand information about outdoor air quality and to evaluate national air quality trends, the Environmental Protection Agency (EPA) publishes a daily Air Quality Index or AQI• EPA uses 5 Major air pollutants to define AQI.Ground level ozone Particulate matterCO SO2
NO2
36

19
Air Quality Index (AQI)z
Category and Range
37
Category AQI 8-hr O3(ppm)
1-hr O3(ppm)
24-hr PM2.5(µg/m3)
24-hr PM10(µg/m3)
8-hr CO(ppm)
24-hr SO2(ppm)
Good 0 – 50 0.000 – 0.064 –– 0 – 15.4 0 – 54 0 – 4.4 0.000 – 0.034
Moderate 51 - 100 0.065 – 0.084 –– 15.5 – 40.4 55 – 154 4.5 – 9.4 0.035 – 0.144
Unhealthy for sensitive 101 - 150 0.085 – 0.104 0.125 – 0.164 40.5 – 65.4 155 – 254 9.5 – 12.4 0.145 – 0.224
Unhealthy 151 - 200 0.105 – 0.124 0.165 – 0.204 65.5 – 150.4 255 – 354 12.5 – 15.4 0.225 – 0.304
Very unhealthy 201 - 300 0.125 – 0.374 0.205 – 0.404 150.5 – 250.4 355 – 424 15.5 – 30.4 0.305 – 0.604
hazardous 301 - 400 Use 1-hr 0.405 – 0.504 250.5 – 350.4 425 – 504 30.5 – 40.4 0.605 – 0.804
hazardous 401 - 500 Use 1-hr 0.505 – 0.604 350.5 – 500.4 505 – 604 40.5 – 50.4 0.805 – 1.004
The most significant number on the AQI scale is 100, since this number corresponds to the standards established under the Clean Air Act for each pollutant.
Example_3:What AQI descriptor (good, moderate, etc.) should be reported for air quality on the following day?
Solution:From AQI table:AQI 151-200 triggered by PM2.5, Unhealthy
38
Pollutant Concentration
O3, 1-hr (ppm) 0.15
CO, 8-hr (ppm) 12
PM2.5, 24-hr (µg/m3) 130
PM10, 24-hr (µg/m3) 180
SO2, 24-hr (ppm) 0.12

20
Indoor Air Quality• Indoor air quality (IAQ) is important because people
generally spend most of their time indoors.• Indoor air contaminants include:
–combustion products (especially tobacco smoke) – radon–asbestos –formaldehyde–lead–biological substances
• Environmental tobacco smoke (ETS), which contains more than 40 carcinogenic compounds, causes thousands of lung cancer deaths each year in nonsmoking adults
39
Indoor Air Quality• Radon, a naturally occurring colorless, odorless,
radioactive gas, can enter buildings through porous soil and rock fissures at basement walls and floors. – It can be a cause of lung cancer if inhaled for long
periods
•Asbestos, a mineral fiber used as insulation and as a fire retardant in buildings. It has been banned from Saudi Arabia. – It can cause lung cancer if very small airborne asbestos
fibers are inhaled.
• Formaldehyde, a colorless gas that comes from certain building materials and household products.–can cause eye and throat irritation (and maybe cancer)
40

21
Simplified Uranium decay series, with half-lives and emissions. Radon gas that seeps out of soils can decay
inside the buildings41
Indoor Air Quality• Proper infiltration and ventilation (air exchange) is
necessary to minimize levels of indoor air pollutants. • Indoor Air Quality (IAQ) is a component of the LEED
green building certification credits related to indoor environmental quality.
42
Leadership in Energy and Environmental Design (LEED)

22
43
Num
erou
s ind
oor a
ir po
lluta
nts a
re fo
und
in m
ost
mod
ern
hom
es
Air Pollution Control•Air pollution control strategies include:
–Complete source shutdown–Source location (or air zoning)–Fuel substitution–Process changes–Enforcement of emission standards for specific
sources• Several types of air cleaning devices can trap air
pollutants before they are emitted into the atmosphere.
44

23
Air Pollution Control• Particulate matter control equipment includes:
–Gravity settlers –Cyclones–Electrostatic precipitators–Fabric filters–Wet scrubbers
• The selection of control equipment depends on the range of particulate sizes, flow rates, temperatures of the carrier gas, costs, and other factors.•One of the most efficient of these devices for
removing suspended particulates is the fabric filter (or baghouse)
45
Particulate matter control equipment
46
Cyclones

24
Particulate matter control equipment
47
Baghouse (Fabric filters) Wet scrubbers
Particulate matter control equipment
48
Electrostatic precipitators

25
Gaseous air pollutants •Gaseous air pollutants can be controlled using either
absorption or adsorption processes. •Absorption involves the transfer of a gaseous pollutant
into a contacting liquid.•Adsorption involves attracting and trapping gas
molecules onto the surface of a solid (e.g., activated carbon)•Wet scrubbers can be used for gas absorption, as well
as packed scrubber towers.• Emissions from the internal combustion engine, which is
a major mobile source of air pollutants, are controlled by positive crankcase ventilation systems and catalytic converters.
49
50
Activated carbon can be used to adsorb certain gaseous air pollutants

26
catalytic converters
51

1
Solid Waste Management
Department of Civil Engineering College of EngineeringKing Saud University
GE 302 – Industry and the EnvironmentTopic 6
• Any non-liquid material that is thrown away or discarded as useless and unwanted is considered to be solid waste.
• Improper disposal of solid waste can cause serious environmental or ecological damage.– Air pollution can result from inadequate solid waste
incineration– soil contamination– Surface water and groundwater pollution, can be caused by
the disposal of solid waste in improperly built landfills.
• There is connection between improper solid waste disposal and public health.
• Solid waste can host rodents and insects, which may act as vectors of infectious diseases such as typhoid, plague, and dysentery.

2
Sources of Solid Wastes:• Municipal solid waste (MSW)
– The term municipal solid waste is generally used to describe most of the nonhazardous solid waste from a city, town, or village that requires routine or a periodic collection and transport to a processing or disposal site.
• Industrial solid waste– Wastes arising form industrial activities– Some of industrial waste is classified as hazardous waste
• Agricultural• Mining
• Waste is a human-derived word• Materials are considered a waste when owners and
society believe they no longer have value.
Sources of Solid Waste and Typical percentage that makes up Municipal Solids Waste

3
Sources of Solid Waste and Typical percentage that makes up Municipal Solids Waste
Overview of the Solid Waste Management System
• Solid waste management requires an understanding of waste generation, storage, collection, transport, processing, and disposal.

4
1. Follow the pollution prevention hierarchy, which prefers source reduction and recycling over treatment and disposal.
2. Protect public health.
3. Protect the environment (including biodiversity) and view the waste material as a resource.
4. Address social concerns (equity, environmental justice, aesthetics, risk, public preferences, recycling & renewable energy).
5. Minimize economic, social, and environmental costs.
Proper management of solid wastes has five main objectives:
pollution prevention hierarchy
• Garbage contains putrescible or highly decomposable food waste, such as vegetable and meat scraps.
• Rubbish contains mostly dry, non-putrescible material, such as glass, rubber, metal cans, and lowly decomposable or combustible material, such as paper, textiles, or wood objects.
• Trash includes bulky waste materials that generally require special handling and is therefore not collected on a routine basis. An old couch, mattress, television, or refrigerator and even a large uprooted tree stump are examples of trash items.
Municipal Solid waste
RefuseGarbage
RubbishTrash
Types of Municipal Solid W
aste

5
Quantities and MSW• Information regarding the weight, volume, and the
composition of the MSW is important for the proper planning, design, and operating of collection and disposal facilities.
• In Saudi Arabia, about 15 million tons of MSW/year.
• (1.5-1.8) kg are generated per person every day.
The actual number will vary for each community depending on:
1. The time of year2. The location3. Commercial and industrial activities
Composition of Solid Wates (USA)
FIGURE 11-3 MSW components in the United States (percent by weight), before recycling (2010).

6
In Saudi Arabia:*• Recycling rate ranges from 10-15% (low rate).
• Recycling activities are mostly manual and labor intensive.
• Composting is also gaining increased interest in Saudi Arabia due to the high organic content of MSW (around 40%).
*http://www.ecomena.org/tag/msw-in-saudi-arabia/
MSW Management Strategy (3 main components)
1- Source reduction (waste prevention) includes:- reuse of products on-site- packaging to reduce their quantity- on-site composting of garden trimmings
2- Recycling- off-site recovery and processing for reuse- off-site composting
3- Energy recovery4- Treatment5- Disposal
- incineration- landfills

7
Solid Waste Collection• It includes:
- Temporary storage and containerization
- Transfer to a collection vehicles
- Transport to a processing facility or disposal site
• About 2/3 of the total cost for MSW management is needed for waste collection it is labor intensive
• If source separation is applied, the recyclable material (e.g. Plastic, Paper, … etc.) can be collected separately from non-recyclable garbage and rubbish.
• Transfer stations solid wastes from individual collection trucks are consolidated into larger truck, economical way to transport the solid waste over the long-haul distance to the processing and disposal site.
• The purpose of MSW processing is to:– Reduce the total volume and weight that needs final
disposal, – Improve its handling characteristics, and – Recover natural resources and energy for reuse.
• The commonly used processes for MSW includes:– Sorting and separating– Shredding – Pulverizing – Baling – Composting– Incineration
Solid Waste Processing
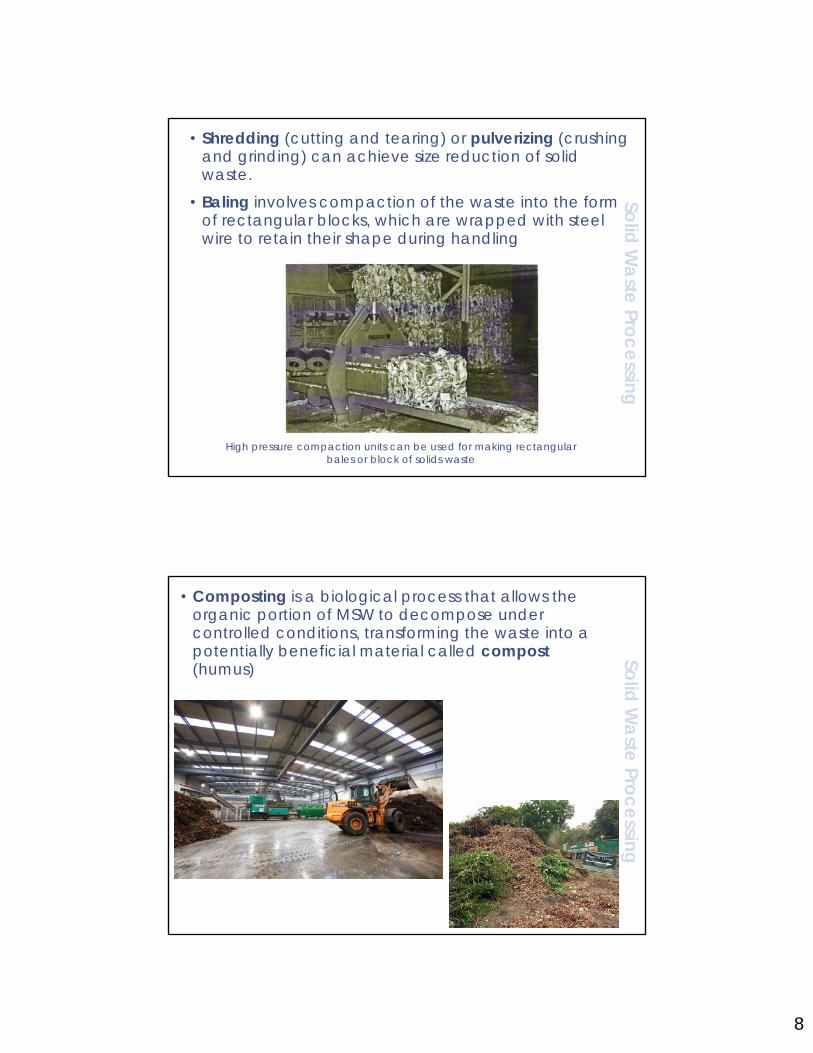
8
• Shredding (cutting and tearing) or pulverizing (crushing and grinding) can achieve size reduction of solid waste.
• Baling involves compaction of the waste into the form of rectangular blocks, which are wrapped with steel wire to retain their shape during handling
High pressure compaction units can be used for making rectangular bales or block of solids waste
Solid Waste Processing
• Composting is a biological process that allows the organic portion of MSW to decompose under controlled conditions, transforming the waste into a potentially beneficial material called compost(humus)
Solid Waste Processing

9
• Recycling involves separating out and reusing the components of the MSW stream that have some economic value, including metals, paper, glass, andplastic (Aluminum has the highest recycling value).
• Separation can be done at the source or at a centralized waste processing plant.
Labels on paper products with Mobius arrows
Type of Plastics Found in Commercial Products with Resin Code Used to Aid Recovery
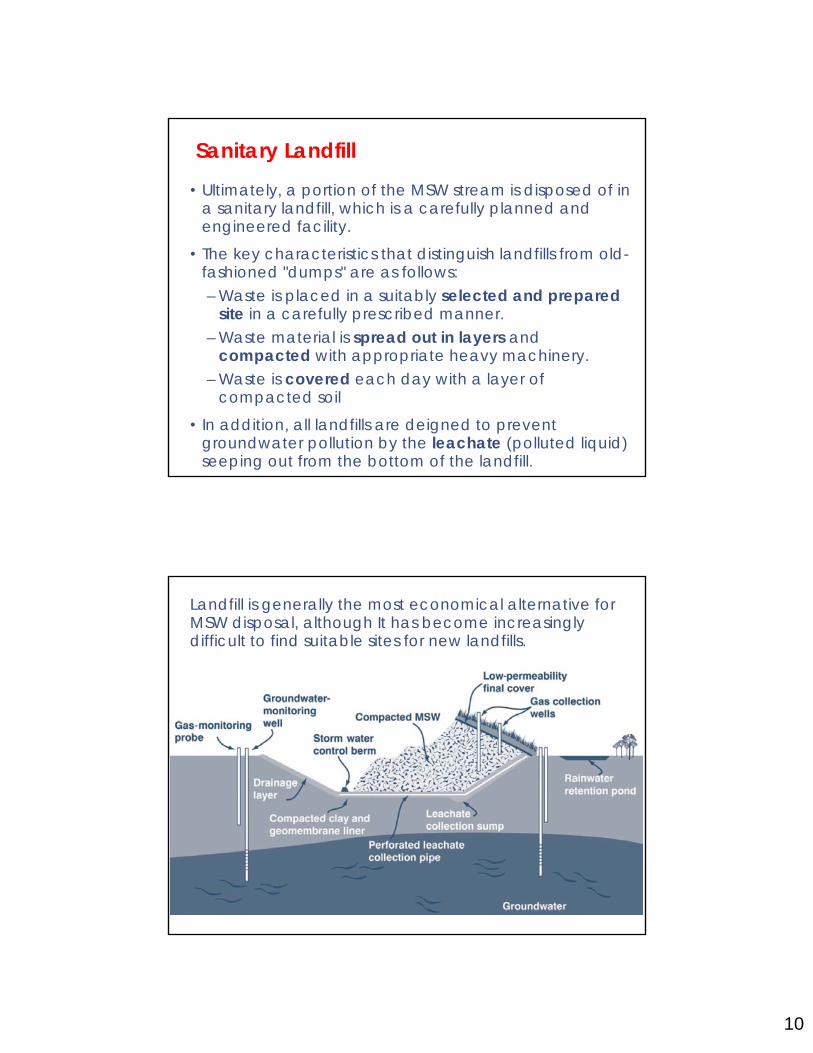
10
Sanitary Landfill• Ultimately, a portion of the MSW stream is disposed of in
a sanitary landfill, which is a carefully planned and engineered facility.
• The key characteristics that distinguish landfills from old-fashioned "dumps" are as follows:– Waste is placed in a suitably selected and prepared
site in a carefully prescribed manner.– Waste material is spread out in layers and
compacted with appropriate heavy machinery.– Waste is covered each day with a layer of
compacted soil
• In addition, all landfills are deigned to prevent groundwater pollution by the leachate (polluted liquid) seeping out from the bottom of the landfill.
Landfill is generally the most economical alternative for MSW disposal, although It has become increasingly difficult to find suitable sites for new landfills.

11
The basic building block of a sanitary landfill is a compacted cell of solid waste, which is separated from
other cells by a layer of compacted soil
Riyadh landfill

12
Sanitary Landfill site selection• The most important factors in landfill site selection are:
1. volume capacity2. accessibility3. hydrogeological condition
• Accessibility refers to the ease with which collection or transport vehicles can reach the disposal area without causing a public nuisance or hazard.
• Local geology and hydrology (hydrogeology) have a direct influence on the possibility of water pollution
• Modern landfills are also called containment landfills because they are constructed with bottom liners. The liners confine the leachate and prevent it from mixing with groundwater.
Example-1: (Service years for landfill)
A city has 600,000 inhabitants. The daily MSW production rate is approximately 2 kg/capita · day. Estimate the following requirements under the given conditions:
If the landfill area is approximately 0.5 km x 1.0 km and its average depth is 10.0 m, estimate the number of years (365 days/year) that the landfill will serve. Assume the wastes layers in the landfill will be compacted to a density of 400 kg/m3

13
Solution:Capacity of the landfill =
500 m x 1000 m x 10 m x 400 kg/m3 = 2 x 10⁹ kg
Daily MSW production rate of the city =
600,000 capita x 2 kg/capita · day = 1.2 x 10⁶ kg/day
Number of years that the landfill will serve =
years4.57days365
year1days1666.7days1666.7
kg/day10X1.2
kg10X 26
9
Hazardous Wastes• MSW is not generally considered to be hazardous, but
certain types of commercial or industrial wastes are characterized as hazardous waste that can cause immediate and direct harm to people or the environment if disposed of improperly.
• Hazardous Waste is defines as a solid waste that may cause or significantly contribute to an increase in mortality or an increase in serious irreversible or incapacitating reversible illness; or pose a substantial present or potential hazard to human health or the environment when it is improperly treated, stored, transported, or dispose of.
• This hazardous waste typically requires transport, processing, and disposal methods that are different from those required for nonhazardous MSW.
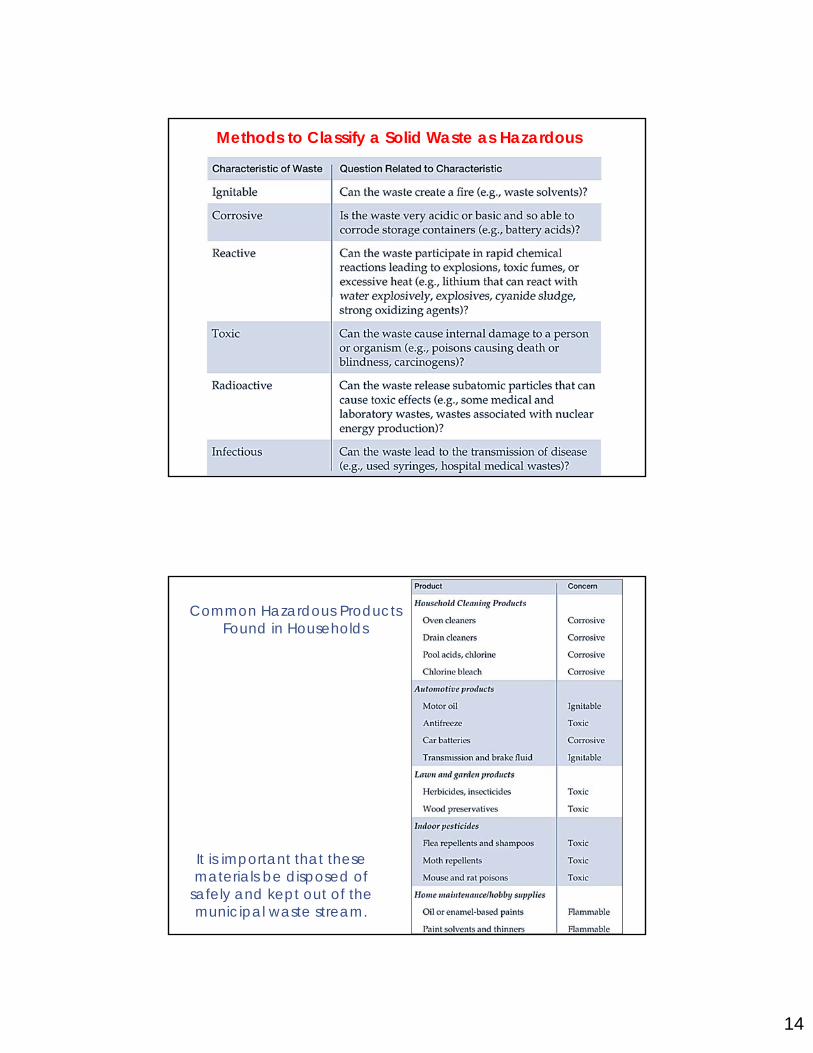
14
Methods to Classify a Solid Waste as Hazardous
Common Hazardous Products Found in Households
It is important that these materials be disposed of
safely and kept out of the municipal waste stream.

15
GHS Pictograms and Hazard
Classes
Globally Harmonized
System (GHS) of Classification
and Labelling of Chemicals
Transport “Pictograms”
Globally Harmonized
System (GHS) of Classification
and Labelling of Chemicals