1 intertanko athens tanker event april 2005 john kartsonas (212) 816-6134...
Post on 19-Dec-2015
218 views
TRANSCRIPT
1
Intertanko Athens Tanker Event
April 2005
John Kartsonas(212) 816-6134
See pages 15 to 17 for Analyst Certification and important disclosures
Smith Barney is a division of Citigroup Global Markets. (the "Firm"), which does and seeks to do business with companies covered in its research reports. As a result, investors should be aware that the Firm may have a conflict of interest that could affect the objectivity of this report. Investors should consider this report as only a single factor in making their investment decision. Customers of the Firm in the United States can receive independent, third-party research on the company or companies covered in this report, at no cost to them, where such research is available. Customers can access this independent research at http://www.smithbarney.com (for retail clients) or http://www.citigroupgeo.com (for institutional clients) or can call (866) 836-9542 to request a copy of this research.

2Inte
rtan
ko A
then
s T
anke
r E
ven
t
Ap
ril
2005 Our View
Return on Investment drives vessel and tanker stock valuations
How much a vessel will earn in the next few years depends on one thing: Dayrates.
Fundamentals relating to supply and demand determine dayrates.
Supply is pretty much set for the next three years: Expect fleet growth of 7%-8% per year.
Demand is capped by production and refining capacity: Tanker demand cannot grow faster than 3%-4% per year till end of 2007 (incl. non-OPEC expectations).
The best case scenario is easy to envision: OPEC produces at capacity, but tanker supply grows faster leading to lower average dayrates.
The worst case scenario takes us back into the 90’s or even the 80’s…

3Inte
rtan
ko A
then
s T
anke
r E
ven
t
Ap
ril
2005 Tanker Demand Capped by OPEC Capacity
Source: IEA, Clarksons and Smith Barney
24,000
25,000
26,000
27,000
28,000
29,000
30,000
31,000
32,000
33,000
34,000
35,000
36,000
37,000
38,000
J an-00 J ul-00 J an-01 J ul-01 J an-02 J ul-02 J an-03 J ul-03 J an-04 J ul-04 J an-05 J ul-05 J an-06 J ul-06 J an-07 J ul-07 J an-08
116
121
126
131
136
141
146
151
156OPEC Production VLCC fleet, million Dwt
OPEC producing at estimated capacity
in 2006-2007
Estimated

4Inte
rtan
ko A
then
s T
anke
r E
ven
t
Ap
ril
2005 Demand is only half of the Equation
The fleet is growing at historically high rates.
Expect the tanker fleet to be some 27% higher at the end of 2007, compare to 2003.
The bet is on OPEC production, not on the fundamentals of the tanker market.
Our analysis is based only on VLCCs; the picture looks even worse when we include the whole crude fleet.
Middle East Production to VLCC fleet
Source: IEA, Clarksons and Smith Barney
• at capacity
•0.5 mbpd increase annually
•Flat to Feb ’05 levels
Rat
io o
f M
idd
le E
as
t P
rod
uc
tio
n t
o V
LC
C f
lee
t
6.0
6.2
6.4
6.6
6.8
7.0
7.2
7.4
7.6
7.8
8.0
1993 1994 1995 1996 1997 1998 1999 2000 2001 2002 2003 2004 2005 2006 2007

5Inte
rtan
ko A
then
s T
anke
r E
ven
t
Ap
ril
2005 Chinese refining capacity limits crude imports
Source: OGJ, IEA and Smith Barney
-
1,000
2,000
3,000
4,000
5,000
6,000
1999 2000 2001 2002 2003 2004 2005E
Production Crude Imports Refining Capacity
Chinese refineries operated at an estimated 94% utilization in 2004, up from 89% in 2003.
We estimate expansion projects for 2005 of 200,000 bpd or 3.4%, and another 200,000 in 2006, with the risk being on the downside.
Crude import growth this year is limited by refining capacity, and we estimate incremental demand growth of about 1 mdwt ( about 4-5 VLCCs), down from 2.8 mdwt (10 VLCCs) in ‘04.
SPR not significant in terms of imports ( est. at less than 40k bpd until 2008).

6Inte
rtan
ko A
then
s T
anke
r E
ven
t
Ap
ril
2005 How we think about the Future
Try to envision what the status of the tanker market will be 12 months from now
Estimate asset values at such an environment
Add back the best case scenario for 2005
Compare to where we stand today
M. East Production : 20.5 mbpd
VLCC fleet: 135 mdwt
= 7.8
= 7.4
March ‘05 avg VLCC rate: $59,000
March ‘06 avg VLCC rate< $59,000
Highest M.E. Production to VLCCs ratio was last September, but lower than October ‘00
March 2005 OPEC @95% capacity
March 2006 OPEC @99% capacity
M. East Production : 21.5 mbpd
VLCC fleet: 144 mdwt

7Inte
rtan
ko A
then
s T
anke
r E
ven
t
Ap
ril
2005 Dayrate Economics
Assume a required return on investment.
Buy vessel in the secondhand market.
Calculate the breakeven level under different return assumptions.
Breakeven levels are sensitive to purchase price and financing costs.
Secondhand prices are at all time high, interest rates are on the rise.
Breakeven levels should include the overall cost of capital
Source: Smith Barney
* For model assumptions please see appendix
VLCC Suezmax Aframax VLCC Suezmax Aframax VLCC Suezmax AframaxRequired Return on Investment 8.0% 8.0% 8.0% 9.5% 9.5% 9.5% 4.0% 4.0% 4.0%Secondhand Prices, Modern 130$ 80$ 65$ 130$ 80$ 65$ 130$ 80$ 65$ Annual Cash Flow $12.08 $7.43 $6.04 $13.70 $8.43 $6.85 $8.15 $5.02 $4.08
Average Dayrate, next 25 years 44,807$ 30,165$ 25,429$ 49,726$ 33,192$ 27,887$ 32,840$ 22,802$ 19,452$
15-year average 33,837$ 24,904$ 21,640$ 33,837$ 24,904$ 21,640$ 33,837$ 24,904$ 21,640$ 10-year average 38,893$ 29,491$ 25,020$ 38,893$ 29,491$ 25,020$ 38,893$ 29,491$ 25,020$ 5-year average 50,190$ 39,258$ 33,195$ 50,190$ 39,258$ 33,195$ 50,190$ 39,258$ 33,195$
8.0% ROI, 10% ROE 4.0% ROI, 0% ROE9.5% ROI, 15% ROE
Breakeven rates under different assumptions

8Inte
rtan
ko A
then
s T
anke
r E
ven
t
Ap
ril
2005 Risk and Reward
Buy vessel in the secondhand market
Operate it for one year
Sell vessel in the secondhand market
VLCC Suezmax AframaxAcquisition Price 130$ 80$ 65$ 1 Year Average Dayrate 65,000$ 45,000$ 35,000$ Annual Cash Flow 19$ 12$ 9$ Sale Price 83$ 53$ 47$
Return -22% -19% -14%
Sale price represents purchase price minus one year worth of cash flows at mid-cycle rate
Amounts are discounted at 8%
Sale price declines to May 2004 level
Risk is high
VLCC Suezmax AframaxAcquisition Price 130$ 80$ 65$ 1 Year Average Dayrate 65,000$ 45,000$ 35,000$ Annual Cash Flow 19$ 12$ 10$ Sale Price 128$ 78$ 63$
Return 13% 13% 12%
ROE~ 33%
ROE~ -50%

9Inte
rtan
ko A
then
s T
anke
r E
ven
t
Ap
ril
2005 How about publicly traded stocks?
The previous analysis was for the secondhand market.
Publicly traded stocks currently trade at a premium to NAV.
Previous analysis becomes even more worrisome for publicly traded companies, as breakeven levels move even higher.
If you have second thoughts on buying at these levels, how about buying at a 50% higher price?
Shipping is called cyclical for a reason and recognizing the peak is what would make an investment successful.
Risk and Reward are parts of the same formula, and investors should think about it the same way.
10
Inte
rtan
ko A
then
s T
anke
r E
ven
t
Ap
ril
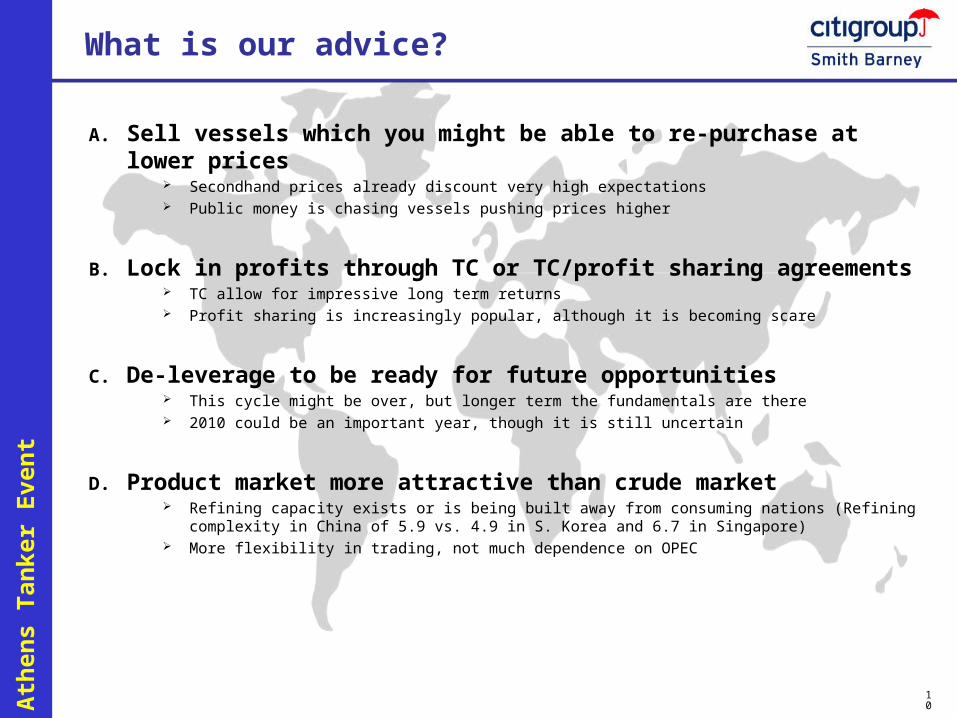
2005 What is our advice?
A. Sell vessels which you might be able to re-purchase at lower prices Secondhand prices already discount very high expectations Public money is chasing vessels pushing prices higher
B. Lock in profits through TC or TC/profit sharing agreements TC allow for impressive long term returns Profit sharing is increasingly popular, although it is becoming scare
C. De-leverage to be ready for future opportunities This cycle might be over, but longer term the fundamentals are there 2010 could be an important year, though it is still uncertain
D. Product market more attractive than crude market Refining capacity exists or is being built away from consuming nations (Refining complexity in China of
5.9 vs. 4.9 in S. Korea and 6.7 in Singapore) More flexibility in trading, not much dependence on OPEC
11
Inte
rtan
ko A
then
s T
anke
r E
ven
t
Ap
ril
2005
Intertanko Athens Tanker Event
April 2005

12
Inte
rtan
ko A
then
s T
anke
r E
ven
t
Ap
ril
2005
Appendix
13
Inte
rtan
ko A
then
s T
anke
r E
ven
t
Ap
ril
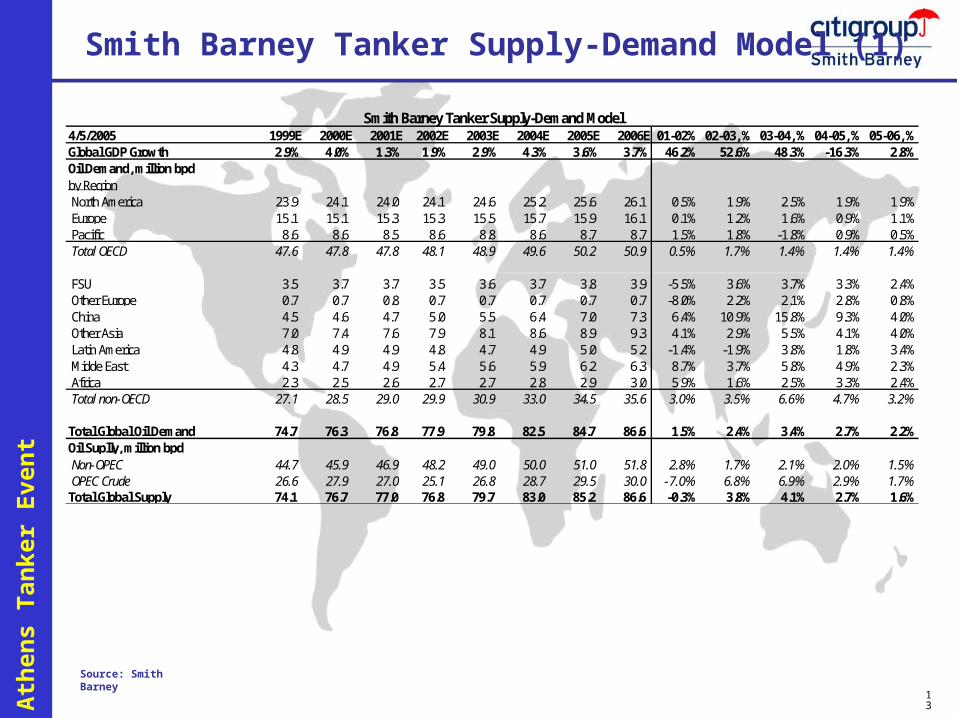
2005 Smith Barney Tanker Supply-Demand Model (1)
Source: Smith Barney
4/5/2005 1999E 2000E 2001E 2002E 2003E 2004E 2005E 2006E 01-02% 02-03, % 03-04, % 04-05, % 05-06, %Global GDP Growth 2.9% 4.0% 1.3% 1.9% 2.9% 4.3% 3.6% 3.7% 46.2% 52.6% 48.3% -16.3% 2.8%Oil Demand, million bpdby RegionNorth America 23.9 24.1 24.0 24.1 24.6 25.2 25.6 26.1 0.5% 1.9% 2.5% 1.9% 1.9%Europe 15.1 15.1 15.3 15.3 15.5 15.7 15.9 16.1 0.1% 1.2% 1.6% 0.9% 1.1%Pacific 8.6 8.6 8.5 8.6 8.8 8.6 8.7 8.7 1.5% 1.8% -1.8% 0.9% 0.5%Total OECD 47.6 47.8 47.8 48.1 48.9 49.6 50.2 50.9 0.5% 1.7% 1.4% 1.4% 1.4%
FSU 3.5 3.7 3.7 3.5 3.6 3.7 3.8 3.9 -5.5% 3.6% 3.7% 3.3% 2.4%Other Europe 0.7 0.7 0.8 0.7 0.7 0.7 0.7 0.7 -8.0% 2.2% 2.1% 2.8% 0.8%China 4.5 4.6 4.7 5.0 5.5 6.4 7.0 7.3 6.4% 10.9% 15.8% 9.3% 4.0%Other Asia 7.0 7.4 7.6 7.9 8.1 8.6 8.9 9.3 4.1% 2.9% 5.5% 4.1% 4.0%Latin America 4.8 4.9 4.9 4.8 4.7 4.9 5.0 5.2 -1.4% -1.9% 3.8% 1.8% 3.4%Midde East 4.3 4.7 4.9 5.4 5.6 5.9 6.2 6.3 8.7% 3.7% 5.8% 4.9% 2.3%Africa 2.3 2.5 2.6 2.7 2.7 2.8 2.9 3.0 5.9% 1.6% 2.5% 3.3% 2.4%Total non-OECD 27.1 28.5 29.0 29.9 30.9 33.0 34.5 35.6 3.0% 3.5% 6.6% 4.7% 3.2%
Total Global Oil Demand 74.7 76.3 76.8 77.9 79.8 82.5 84.7 86.6 1.5% 2.4% 3.4% 2.7% 2.2%Oil Suplly, million bpdNon-OPEC 44.7 45.9 46.9 48.2 49.0 50.0 51.0 51.8 2.8% 1.7% 2.1% 2.0% 1.5%OPEC Crude 26.6 27.9 27.0 25.1 26.8 28.7 29.5 30.0 -7.0% 6.8% 6.9% 2.9% 1.7%Total Global Supply 74.1 76.7 77.0 76.8 79.7 83.0 85.2 86.6 -0.3% 3.8% 4.1% 2.7% 1.6%
Smith Barney Tanker Supply-Demand Model
14
Inte
rtan
ko A
then
s T
anke
r E
ven
t
Ap
ril
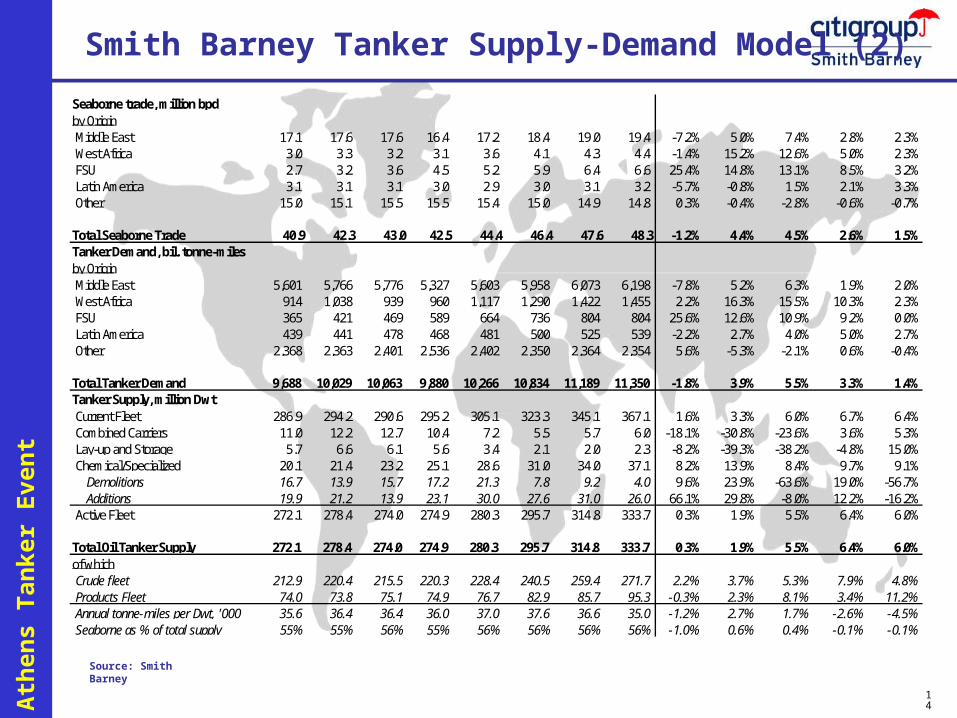
2005 Smith Barney Tanker Supply-Demand Model (2)
Source: Smith Barney
Seaborne trade, million bpdby OriginMiddle East 17.1 17.6 17.6 16.4 17.2 18.4 19.0 19.4 -7.2% 5.0% 7.4% 2.8% 2.3%West Africa 3.0 3.3 3.2 3.1 3.6 4.1 4.3 4.4 -1.4% 15.2% 12.6% 5.0% 2.3%FSU 2.7 3.2 3.6 4.5 5.2 5.9 6.4 6.6 25.4% 14.8% 13.1% 8.5% 3.2%Latin America 3.1 3.1 3.1 3.0 2.9 3.0 3.1 3.2 -5.7% -0.8% 1.5% 2.1% 3.3%Other 15.0 15.1 15.5 15.5 15.4 15.0 14.9 14.8 0.3% -0.4% -2.8% -0.6% -0.7%
Total Seaborne Trade 40.9 42.3 43.0 42.5 44.4 46.4 47.6 48.3 -1.2% 4.4% 4.5% 2.6% 1.5%Tanker Demand, bil. tonne-milesby OriginMiddle East 5,601 5,766 5,776 5,327 5,603 5,958 6,073 6,198 -7.8% 5.2% 6.3% 1.9% 2.0%West Africa 914 1,038 939 960 1,117 1,290 1,422 1,455 2.2% 16.3% 15.5% 10.3% 2.3%FSU 365 421 469 589 664 736 804 804 25.6% 12.6% 10.9% 9.2% 0.0%Latin America 439 441 478 468 481 500 525 539 -2.2% 2.7% 4.0% 5.0% 2.7%Other 2,368 2,363 2,401 2,536 2,402 2,350 2,364 2,354 5.6% -5.3% -2.1% 0.6% -0.4%
Total Tanker Demand 9,688 10,029 10,063 9,880 10,266 10,834 11,189 11,350 -1.8% 3.9% 5.5% 3.3% 1.4%Tanker Supply, million DwtCurrent Fleet 286.9 294.2 290.6 295.2 305.1 323.3 345.1 367.1 1.6% 3.3% 6.0% 6.7% 6.4%Combined Carriers 11.0 12.2 12.7 10.4 7.2 5.5 5.7 6.0 -18.1% -30.8% -23.6% 3.6% 5.3%Lay-up and Storage 5.7 6.6 6.1 5.6 3.4 2.1 2.0 2.3 -8.2% -39.3% -38.2% -4.8% 15.0%Chemical/Specialized 20.1 21.4 23.2 25.1 28.6 31.0 34.0 37.1 8.2% 13.9% 8.4% 9.7% 9.1%
Demolitions 16.7 13.9 15.7 17.2 21.3 7.8 9.2 4.0 9.6% 23.9% -63.6% 19.0% -56.7%Additions 19.9 21.2 13.9 23.1 30.0 27.6 31.0 26.0 66.1% 29.8% -8.0% 12.2% -16.2%
Active Fleet 272.1 278.4 274.0 274.9 280.3 295.7 314.8 333.7 0.3% 1.9% 5.5% 6.4% 6.0%
Total Oil Tanker Supply 272.1 278.4 274.0 274.9 280.3 295.7 314.8 333.7 0.3% 1.9% 5.5% 6.4% 6.0%of whichCrude fleet 212.9 220.4 215.5 220.3 228.4 240.5 259.4 271.7 2.2% 3.7% 5.3% 7.9% 4.8%Products Fleet 74.0 73.8 75.1 74.9 76.7 82.9 85.7 95.3 -0.3% 2.3% 8.1% 3.4% 11.2%Annual tonne-miles per Dwt, '000 35.6 36.4 36.4 36.0 37.0 37.6 36.6 35.0 -1.2% 2.7% 1.7% -2.6% -4.5%Seaborne as % of total supply 55% 55% 56% 55% 56% 56% 56% 56% -1.0% 0.6% 0.4% -0.1% -0.1%

15
Inte
rtan
ko A
then
s T
anke
r E
ven
t
Ap
ril
2005 Return Model Assumptions
Useful life of 25 years, scrap price of $200/ldt, 36k ldt for VLCCs, 22k ldt for Suezmaxes, 17k ldt for Aframaxes.
Cost of debt of 6.6% (4.9% + 1.7%), 60% gearing, cost of equity as in models.
Average annual utilization of 90%, operating costs (including administrative expenses) as follows: $6,500/day for VLCCs $6,000/day for Suezmaxes $5,500/day for Aframaxes
Special survey costs of $8 million during the life of the vessel
Regular dry-docking costs of $6 million during the life of the vessel
mid-cycle rates are as follows: VLCC at $30,000/day Suezmax at $23,000/day Aframax at $21,000/day
16
Inte
rtan
ko A
then
s T
anke
r E
ven
t
Ap
ril
2005
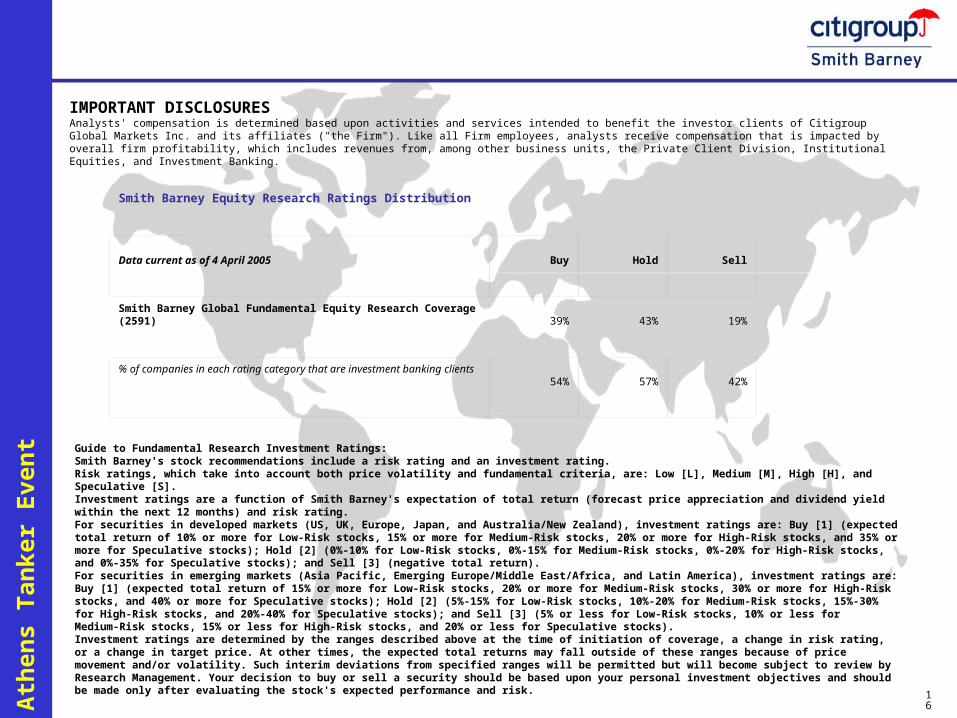
IMPORTANT DISCLOSURESAnalysts' compensation is determined based upon activities and services intended to benefit the investor clients of Citigroup Global Markets Inc. and its affiliates ("the Firm"). Like all Firm employees, analysts receive compensation that is impacted by overall firm profitability, which includes revenues from, among other business units, the Private Client Division, Institutional Equities, and Investment Banking.
Smith Barney Equity Research Ratings Distribution
Smith Barney Global Fundamental Equity Research Coverage (2591)39% 43% 19%
Data current as of 4 April 2005 Buy Hold Sell
% of companies in each rating category that are investment banking clients54% 57% 42%
Guide to Fundamental Research Investment Ratings:Smith Barney's stock recommendations include a risk rating and an investment rating.Risk ratings, which take into account both price volatility and fundamental criteria, are: Low [L], Medium [M], High [H], and Speculative [S].Investment ratings are a function of Smith Barney's expectation of total return (forecast price appreciation and dividend yield within the next 12 months) and risk rating.For securities in developed markets (US, UK, Europe, Japan, and Australia/New Zealand), investment ratings are: Buy [1] (expected total return of 10% or more for Low‑Risk stocks, 15% or more for Medium‑Risk stocks, 20% or more for High‑Risk stocks, and 35% or more for Speculative stocks); Hold [2] (0%‑10% for Low‑Risk stocks, 0%‑15% for Medium‑Risk stocks, 0%‑20% for High‑Risk stocks, and 0%‑35% for Speculative stocks); and Sell [3] (negative total return).For securities in emerging markets (Asia Pacific, Emerging Europe/Middle East/Africa, and Latin America), investment ratings are: Buy [1] (expected total return of 15% or more for Low‑Risk stocks, 20% or more for Medium‑Risk stocks, 30% or more for High‑Risk stocks, and 40% or more for Speculative stocks); Hold [2] (5%‑15% for Low‑Risk stocks, 10%‑20% for Medium‑Risk stocks, 15%‑30% for High‑Risk stocks, and 20%‑40% for Speculative stocks); and Sell [3] (5% or less for Low‑Risk stocks, 10% or less for Medium‑Risk stocks, 15% or less for High‑Risk stocks, and 20% or less for Speculative stocks).Investment ratings are determined by the ranges described above at the time of initiation of coverage, a change in risk rating, or a change in target price. At other times, the expected total returns may fall outside of these ranges because of price movement and/or volatility. Such interim deviations from specified ranges will be permitted but will become subject to review by Research Management. Your decision to buy or sell a security should be based upon your personal investment objectives and should be made only after evaluating the stock's expected performance and risk.
17
Inte
rtan
ko A
then
s T
anke
r E
ven
t
Ap
ril
2005
OTHER DISCLOSURESFor securities recommended in this report in which the Firm is not a market maker, the Firm usually provides bids and offers and may act as principal in connection with such transactions. The Firm is a regular issuer of traded financial instruments linked to securities that may have been recommended in this report. The Firm regularly trades in, and may, at any time, hold a trading position (long or short) in, the shares of the subject company(ies) discussed in this report. The Firm may engage in securities transactions in a manner inconsistent with this research report and, with respect to securities covered by this report, will buy or sell from customers on a principal basis.Securities recommended, offered, or sold by the Firm: (i) are not insured by the Federal Deposit Insurance Corporation; (ii) are not deposits or other obligations of any insured depository institution (including Citibank); and (iii) are subject to investment risks, including the possible loss of the principal amount invested. Although information has been obtained from and is based upon sources that the Firm believes to be reliable, we do not guarantee its accuracy and it may be incomplete and condensed. Note, however, that the Firm has taken all reasonable steps to determine the accuracy and completeness of the disclosures made in the Important Disclosures section of this report. All opinions, projections and estimates constitute the judgment of the author as of the date of the report and are subject to change without notice. Prices and availability of financial instruments also are subject to change without notice. If this is a fundamental research report, it is the intention of Smith Barney to provide research coverage of this/these issuer(s), including in response to news affecting this issuer, subject to applicable quiet periods and capacity constraints. This report is for informational purposes only and is not intended as an offer or solicitation for the purchase or sale of a security. Any decision to purchase securities mentioned in this research must take into account existing public information on such security or any registered prospectus.Investing in non‑U.S. securities, including ADRs, may entail certain risks. The securities of non‑U.S. issuers may not be registered with, nor be subject to the reporting requirements of the U.S. Securities and Exchange Commission. There may be limited information available on foreign securities. Foreign companies are generally not subject to uniform audit and reporting standards, practices and requirements comparable to those in the U.S. Securities of some foreign companies may be less liquid and their prices more volatile than securities of comparable U.S. companies. In addition, exchange rate movements may have an adverse effect on the value of an investment in a foreign stock and its corresponding dividend payment for U.S. investors. Net dividends to ADR investors are estimated, using withholding tax rates conventions, deemed accurate, but investors are urged to consult their tax advisor for exact dividend computations. Investors who have received this report from the Firm may be prohibited in certain states or other jurisdictions from purchasing securities mentioned in this report from the Firm. Please ask your Financial Consultant for additional details.

18
Inte
rtan
ko A
then
s T
anke
r E
ven
t
Ap
ril
2005
The UK's Financial Services Authority rules require that a firm must establish, implement and make available a policy for managing conflicts of interest arising as a result of publication or distribution of investment research. The policy applicable to Citigroup's equity research products can be found at www.citigroupgeo.com. This report may have been distributed simultaneously, in multiple formats, to the Firm's worldwide institutional and retail customers. If this report is being made available via the Smith Barney Private Client Group in the United Kingdom and Amsterdam, please note that this report is distributed in the UK by Citigroup Global Markets Ltd., a firm Authorised and regulated by the Financial Services Authority (FSA) for the conduct of Investment Business in the UK. This document is not to be construed as providing investment services in any jurisdiction where the provision of such services would be illegal. Subject to the nature and contents of this document, the investments described herein are subject to fluctuations in price and/or value and investors may get back less than originally invested. Certain high‑volatility investments can be subject to sudden and large falls in value that could equal or exceed the amount invested. Certain investments contained herein may have tax implications for private customers in the UK whereby levels and basis of taxation may be subject to change. If in doubt, investors should seek advice from a tax adviser. This material may relate to investments or services of a person outside of the UK or to other matters which are not regulated by the Financial Services Authority and further details as to where this may be the case are available upon request in respect of this material. This report may not be distributed to private clients in Germany. This report is distributed in Germany by Citigroup Global Markets Deutschland AG & Co. KGaA, regulated by Bundesanstalt fuer Finanzdienstleistungsaufsicht (BaFin). If this publication is being made available in certain provinces of Canada by Citigroup Global Markets (Canada) Inc. ("CGM Canada"), CGM Canada has approved this publication. If this report was prepared by Smith Barney and distributed in Japan by Nikko Citigroup Ltd., it is being so distributed under license. This report is made available in Australia to wholesale clients through Citigroup Global Markets Australia Pty Ltd. (ABN 64 003 114 832 and AFSL No. 240992) and to retail clients through Smith Barney Citigroup Australia Pty Ltd. (ABN 19 009 145 555 and AFSL No. 240813), Participants of the ASX Group. This advice has been prepared without taking account of the objectives, financial situation or needs of any particular investor. Accordingly, investors should, before acting on the advice, consider the appropriateness of the advice, having regard to their objectives, financial situation and needs. In New Zealand this report is made available through Citigroup Global Markets New Zealand Ltd., a member firm of the New Zealand Stock Exchange. Citigroup Global Markets (Pty) Ltd. is incorporated in the Republic of South Africa (company registration number 2000/025866/07) and its registered office is at 145 West Street, Sandton, Johannesburg 2196. The investments and services contained herein are not available to private customers in South Africa. If this report is made available in Hong Kong by, or on behalf of, Citigroup Global Markets Asia Ltd., it is attributable to Citigroup Global Markets Asia Ltd., Citibank Tower, Citibank Plaza, 3 Garden Road, Hong Kong. If this report is made available in Hong Kong by The Citigroup Private Bank to its clients, it is attributable to Citibank N.A., Citibank Tower, Citibank Plaza, 3 Garden Road, Hong Kong. This publication is made available in Singapore through Citigroup Global Markets Singapore Pte. Ltd., a Capital Markets Services Licence holder.© 2005 Citigroup Global Markets Inc. Member SIPC. Smith Barney is a division and service mark of Citigroup Global Markets Inc. and its affiliates and is used and registered throughout the world. Citigroup and the Umbrella Device are trademarks and service marks of Citicorp or its affiliates and are used and registered throughout the world. Nikko is a registered trademark of Nikko Cordial Corporation. All rights reserved. Any unauthorized use, duplication, redistribution or disclosure is prohibited by law and will result in prosecution. The Firm accepts no liability whatsoever for the actions of third parties. The Firm makes no representations or warranties whatsoever as to the data and information provided in any third party referenced website and shall have no liability or responsibility arising out of, or in connection with, any such referenced website.ADDITIONAL INFORMATION IS AVAILABLE UPON REQUEST