1 information markets & decision makers yiling chen anthony kwasnica tracy mullen penn state...
Post on 20-Dec-2015
214 views
TRANSCRIPT
1
Information Markets & Decision Makers
Yiling ChenAnthony Kwasnica
Tracy MullenPenn State University
This research was supported by the Defense Advanced Research Projects Agency (DARPA) and the Laboratory for Economic Management and Auctions (LEMA)

2
Two Features of Information Markets
1. Information is revealed over time.– As security maturity approaches better
information becomes available.
2. Information provided by the market can be used to improve decision making.
– If the market is aggregating information, a decision maker can treat the market as a new source of information.

3
Timing v. Decisions
There is a potential tradeoff between information refinement and decision making.
– Delay is costly. Decision makers often prefer to make decisions earlier.
• It is more expensive to move resources quickly.• Low cost options can disappear.
– If delay is costly, a decision maker must decide between making a decision earlier with less accuracy but low cost and a decision later with higher accuracy but high cost.
4
This Research
We examine experimentally the interaction between decision makers and information markets when delay is costly and new information is revealed over time.– What is the optimal decision making strategy?– What do human decision makers do?
• Do decision makers make systematic errors when utilizing information market data?
– How does the information market perform with multiple decision makers?

5
Experiment Design
• Two states of the world: Good, Bad– Prior probability of Good and Bad is .5
• One state contingent asset:
100 if Good
0 if BadAvìïï=íïïî

6
Experiment Design (cont’d)
• 8 traders endowed with 5 units of the asset and cash.
• Can buy or sell in a standard asset double auction market.
• Each auction period consists of 5 discrete rounds lasting 3-4 minutes.
• 5-6 auction periods per experimental session.
7
Trading
• Traders can buy or sell units of the asset.
• Traders are given an informative signal about the likelihood of the two states.– Signal g is more likely in Good and signal b
is more likely in Bad.– Observe one new signal in each round

8
Trading
Since traders observe an additional signal at the beginning of each round, the information in the market improves over time.
Example of how information might change overtimeRound
1 2 3 4 5
g 1 2 2 3 4
b 0 0 1 1 1
Pr(G) .6 .69 .6 .69 .77
Pr(B) .4 .21 .4 .21 .23

9
Decision Making
All traders must make a decision (1 or 2)– The value of the decision depends upon
the state (Good or Bad).– There is a cost c associated with delaying
the decision (to later rounds).– Decision must be reached before
resolution of the state.

10
Decision Making
Decision 1 is preferred when the state is Good and 2 when the state is Bad.
All payoffs decrease by c for each round of delay.
Decision Payoffs
Good Bad
Round 1 2 1 2
0 550 50 50 550
1 540 40 40 540
2 530 30 30 530
3 520 20 20 520
4 510 10 10 510
5 500 0 0 500
11
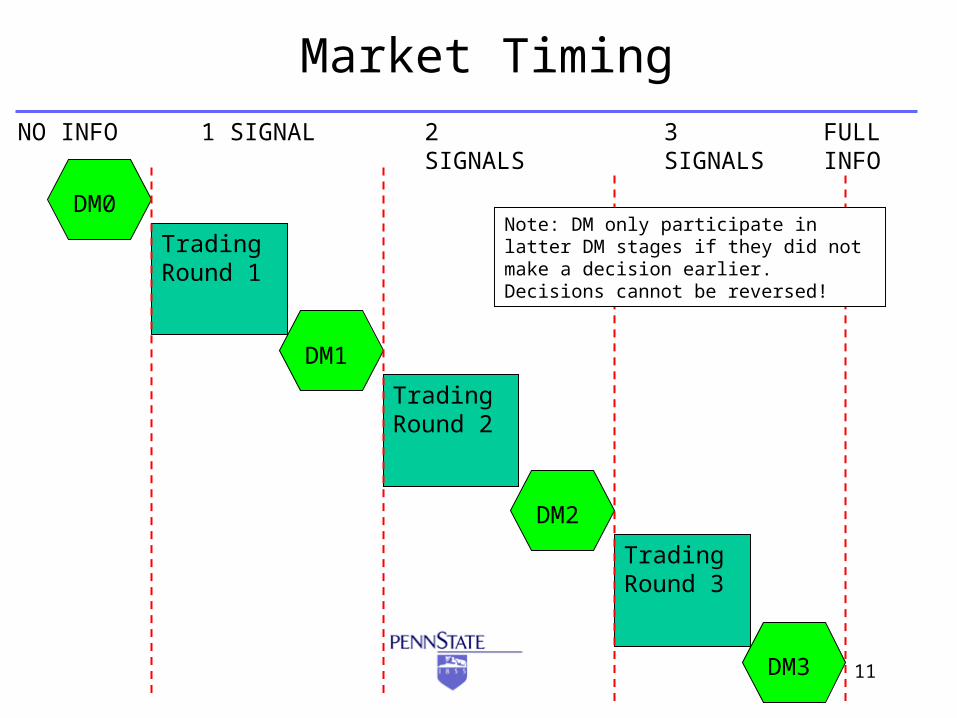
Market Timing
Trading Round 1
Trading Round 2
Trading Round 3
NO INFO 1 SIGNAL 2 SIGNALS 3 SIGNALS FULL INFO
DM0
DM1
DM2
DM3
Note: DM only participate in latter DM stages if they did not make a decision earlier. Decisions cannot be reversed!
12
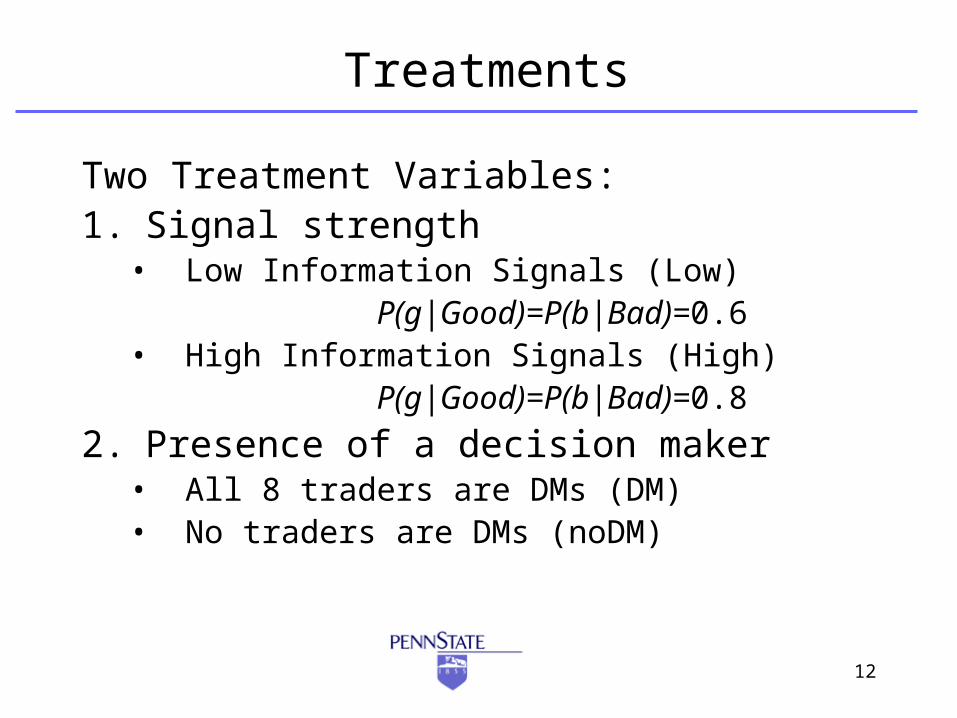
Treatments
Two Treatment Variables:1. Signal strength
• Low Information Signals (Low)P(g|Good)=P(b|Bad)=0.6
• High Information Signals (High)P(g|Good)=P(b|Bad)=0.8
2. Presence of a decision maker• All 8 traders are DMs (DM)• No traders are DMs (noDM)

13
Treatments
Decision Makers
DM noDM
SignalsLow 3 (24) 2 (16)
High 3 (24)
Sessions Completed
All sessions conducted at the LEMA lab at Penn State University.
8 traders per session for 5-6 periods
14
Market Performance Hypothesis
• The Fully Revealing Rational Expectations Equilibrium (FREE) will result in a price equal to the aggregated probability (times 100) of Good occurring given all the signals.
• Alternatives:– Private Information– Uniformed
15
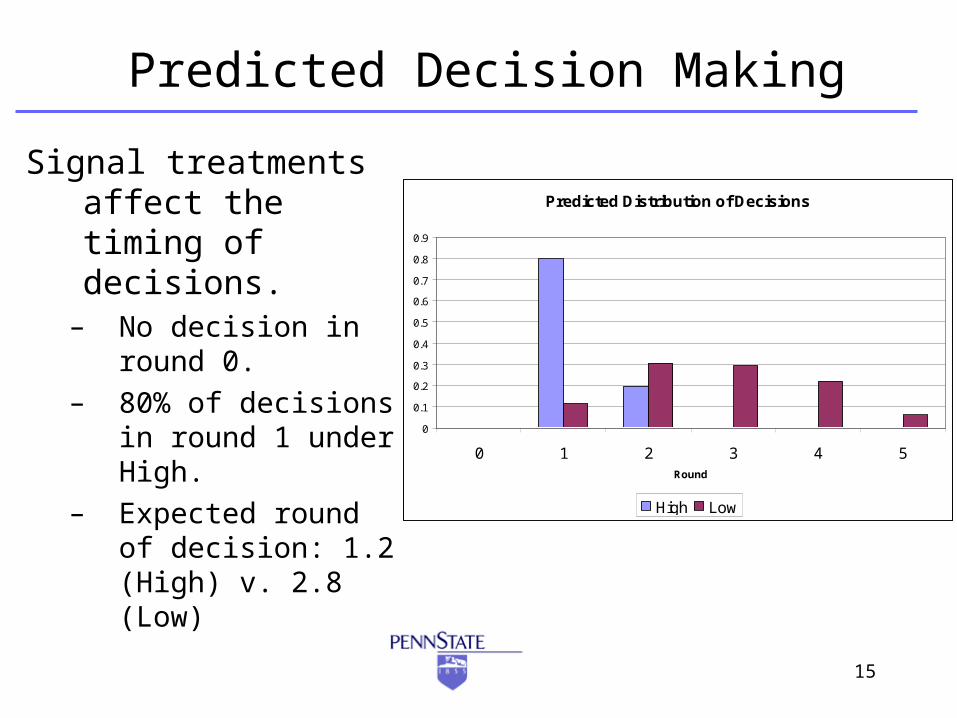
Predicted Decision Making
Signal treatments affect the timing of decisions.
– No decision in round 0.
– 80% of decisions in round 1 under High.
– Expected round of decision: 1.2 (High) v. 2.8 (Low)
Predicted Distribution of Decisions
0
0.1
0.2
0.3
0.4
0.5
0.6
0.7
0.8
0.9
0 1 2 3 4 5Round
High Low
16
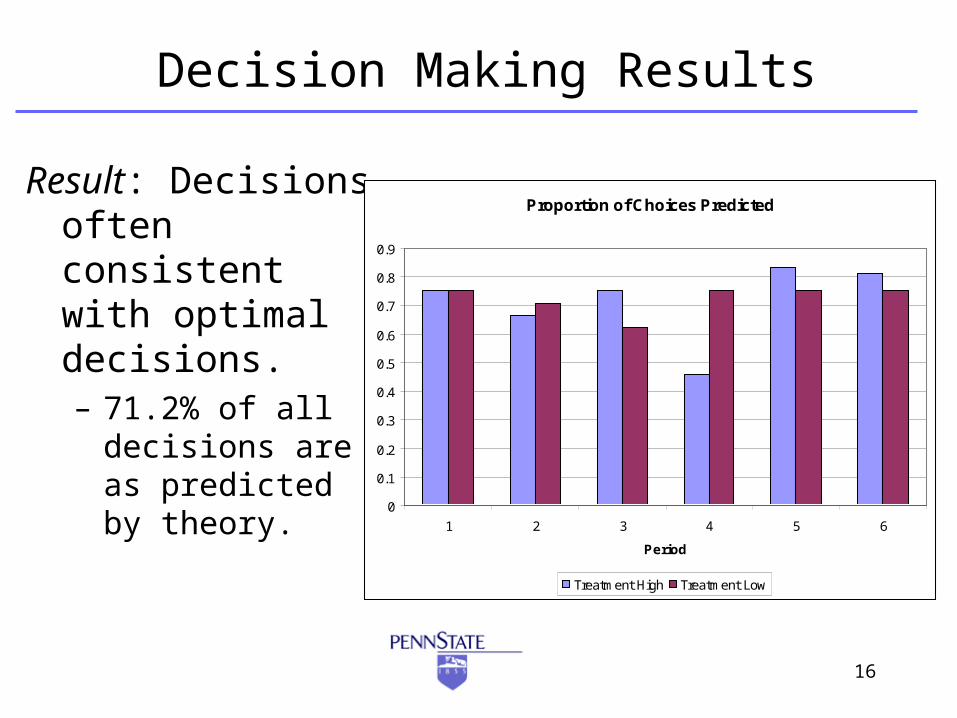
Decision Making Results
Result: Decisions often consistent with optimal decisions.– 71.2% of all
decisions are as predicted by theory.
Proportion of Choices Predicted
0
0.1
0.2
0.3
0.4
0.5
0.6
0.7
0.8
0.9
1 2 3 4 5 6
Period
Treatment High Treatment Low

17
Decision Making Results
Result: Timing of decisions is rarely consistent with optimal decisions.– 12.1% of all decisions are placed at the
time predicted.– Mean Decision Time: 2.02 (High)
1.83(Low)• Significantly different from predicted: t=5.49
(High) t=5.65 (Low)• Direction is flipped.

18
Decision Making Results
Result: Decisions are often made before any information is acquired.– 34.5% in High and
44.5% in Low– This is never
predicted by the theory!
Timing of Decisions
00.05
0.10.15
0.20.25
0.30.35
0.40.45
0.5
0 1 2 3 4 5
Round
Fre
qu
ency
High Low

19
Decision Making Results
Result: There is no evidence of learning.
• High is consistently later than predicted.
• Low is consistently earlier than predicted.
Average Distance from Predicted Time
-2.5
-2
-1.5
-1
-0.5
0
0.5
1
1.5
1 2 3 4 5 6Period
High Low

20
Market Data Example (Low)Market Pri ce v. s. Theoreti cal Pri ce
LOW SI GNALS
0
20
40
60
80
100
120
Tradi ng Peri od
Pric
e
Market Pri ce Theoreti cal Pri ce

21
Market Data Example (High)Market Pri ce v. s. Theoret i cal Pri ce
HI GH SI GNALS
0
20
40
60
80
100
120
Tradi ng Peri od
Pric
e
REE Pri ce Tradi ng Pri ce
22
Market Data Results
Result: The market does not fully aggregate information.– Average Absolute Difference from FREE price:
40.8(High) 27.9(Low).
Result: There is evidence that the market follows the information revealed.– Rd. 1 Avg. Absolute Difference: 47.6 (High)– Rd. 5 Avg. Absolute Difference: 28.2 (High)
Result: The presence of a DM does not affect market performance.
23
Explaining non-optimal decisions
Private Information: DMs ignore the market and base decisions only on their own private signals.
• Predicts no decisions in round 0.• Predicts longer waiting for decisions:
– Mean decision round: 2.50 (High) 2.94 (Low)• Still statistically significantly different than observed
means. (t=3.20 (High) t=6.44 (Low))
• Implication: Any model that predicts some incorporation of market information will predict no decisions in round 0.– Will not fit 40% of observed decisions
24
Explaining non-optimal decisions
Hedging: Since DMs are also Traders, they can hedge by taking opposite positions in the markets and decisions.– Example: A DM selects action 1 (which
pays off in the Good state) and sells all their assets (which pays off in the Bad state).
– Might explain round 0 decision making.

25
Explaining non-optimal decisions
Hedging: Classify a subject as hedging in a given period if they make decision counter to their strong (at least 5 units) buying or selling habits.
• Proportion of obs. classified as Hedging: 19.8% (High) 14.8% (Low)– Many observations do not involve
decisions in round 0. (41% and 37% in rd. 0).

26
Other Decisions
Remove all 0 round decisions and look only at those that may be consistent with the theory.
• Average decision round now later than predicted and treatment effect now closer to expected.
Avg. Decision Round: 3.09 (High) 3.30 (Low)
t=15.8 t=2.86
– Mean decision round in High treatment appears to be declining with experience.
– 80% of decisions as predicted by theory.– 20% of decision times as predicted by theory.
27
Conclusions
• Human decision makers regularly decide to ignore all potential for added information when the information is coming from a market process.
• Contingent upon making an informed decision, human decision makers generally delay too long.
• The information market prediction is not negatively affected by the presence of decision makers.

28
Next Steps
• Additional treatments to understand decision making biases.– Decisions without the market but same info.– DMs and Traders are different.
• Understanding Market Dynamics– What does the convergence process look like?– Even if decision makers to do the right thing, added
uncertainty comes from the market adjustment process.