1 impact of multiple micronutrient … st. patimah.pdf · (riskesdas 2010 & 2013) 0 10 20 30 40...
TRANSCRIPT

IMPACT OF MULTIPLE MICRONUTRIENT
SUPPLEMENTATION ON NUTRITIONAL STATUS
AND GROWTH ON FEMALE ADOLESCENT
Presented at : International & National Scientific Meeting
PERSAGI
1
Yogyakarta : 27
Nopember 2014
SITTI PATIMAH, SURYANI AS’AD, VENI HADJU
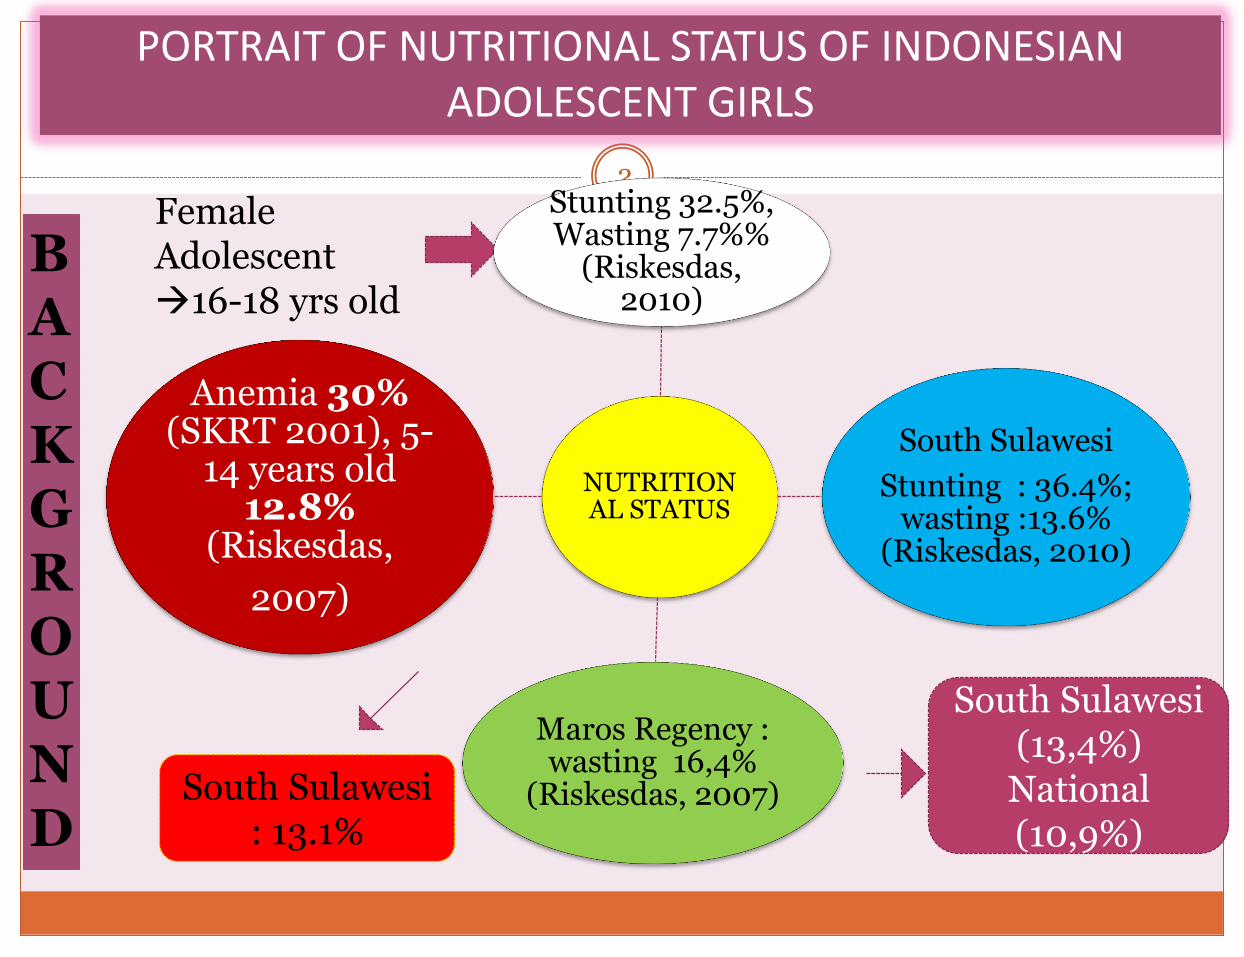
PORTRAIT OF NUTRITIONAL STATUS OF INDONESIAN ADOLESCENT GIRLS
2
South Sulawesi : 13.1%
South Sulawesi (13,4%) National (10,9%)
Female Adolescent 16-18 yrs old
NUTRITIONAL STATUS
Stunting 32.5%, Wasting 7.7%%
(Riskesdas, 2010)
South Sulawesi
Stunting : 36.4%; wasting :13.6%
(Riskesdas, 2010)
Maros Regency : wasting 16,4%
(Riskesdas, 2007)
Anemia 30% (SKRT 2001), 5-
14 years old 12.8%
(Riskesdas,
2007)
B A C K G R O U N D

FIRST AGE MARRIAGE OF FEMALE ADOLESCENT IN INDONESIA
3
0
5
10
15
20
25
30
35
40
45
2010 2013
4.8 2.6
41.9
23.9
10-14 THN 15-19 THN
First age marriage of female (RISKESDAS 2010 & 2013)
0
10
20
30
40
50
60
70
80
10-14 thn 15-19 thn
0.5
77.1
0.3
53.9
pernah hamil per 1000 perempuan kelahiran 5 tahun terakhir
Riskesdas , 2010

4
WHO, 2002; WHO, 2005
Nutritional Status of Female Adolescents Contributes to The Nutritional Status of The Community
(Parimalavalli and Sangeetha, 2011)

5
MMN SUPPLEMENTATION ON FEMALE ADOLESCENT (/WHO/UNICEF/ UNIMMAP)
GROWTH & NUTRITIONAL STATUS
(BAZ & HAZ)
?
BACKGROUND

To compare of effect MMN & IFA supplement on body weight, height, nutritional status based on BAZ-score and HAZ-score on female adolescent with anemia
6
7
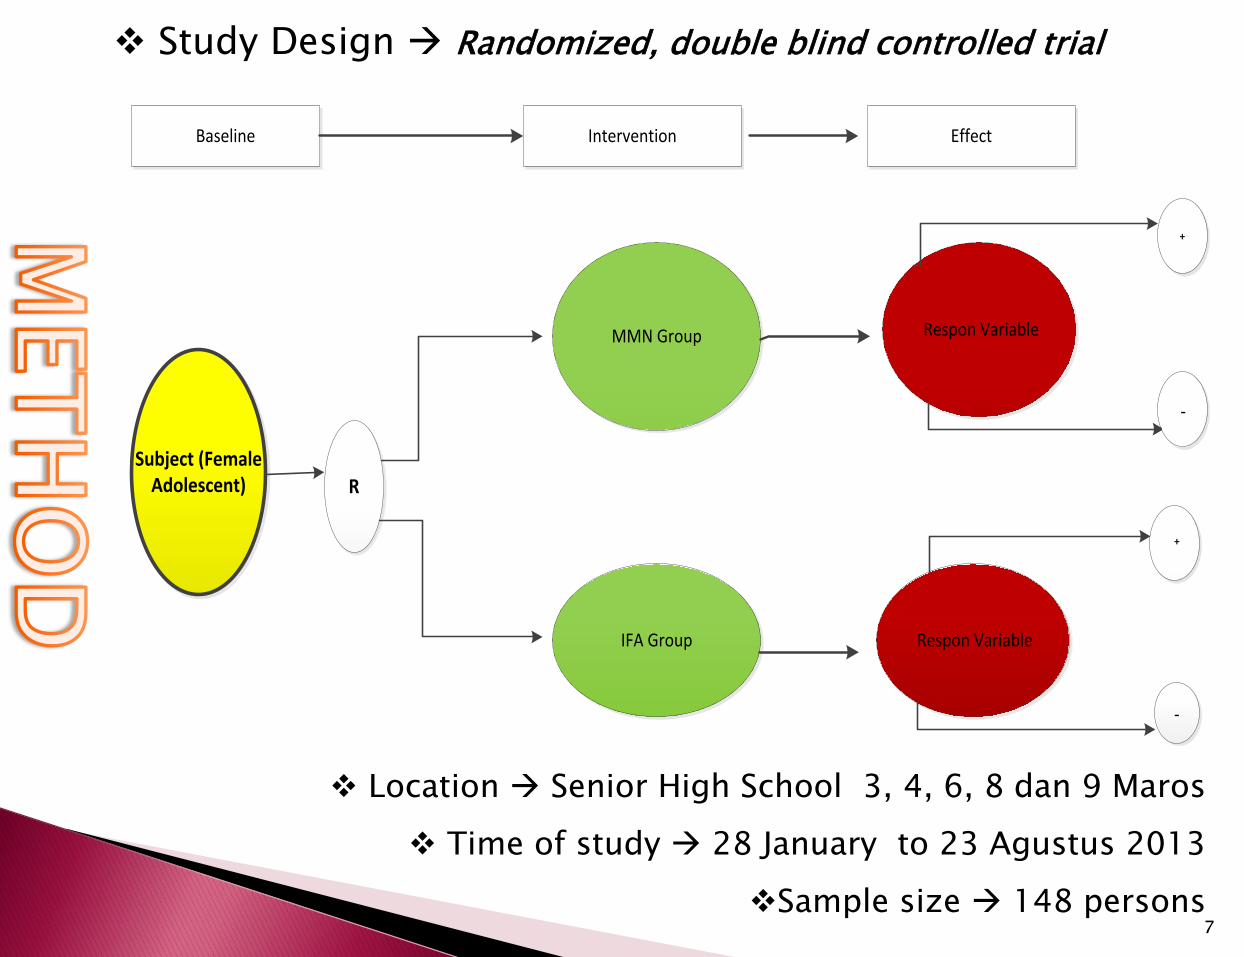
Study Design Randomized, double blind controlled trial
Location Senior High School 3, 4, 6, 8 dan 9 Maros
Time of study 28 January to 23 Agustus 2013
Sample size 148 persons
Baseline Intervention Effect
Subject (Female Adolescent) R
MMN Group
IFA Group
Respon Variable
Respon Variable
⁺
-
⁺
-

8
C O M P O S I T I O N
S U P P L E M E N T
Nutrient Dose RDA 2013
16-18 years old
Nutrient supply per a day
from each supplement
Multiple Micronutrient Supplement
Vitamin A (Retinol) 800 µg 600 RE (µg) 457.1
Vitamin D (Cholecalciferol) 200 IU (5 µg) 15 µg 2.86 µg
Vitamin E (Tocopherol) 10 mg 15 mg 5.71 mg
Vitamin B-1 (Thiamin HCL) 1.4 mg 1.1 mg 0.8 mg
Vitamin B-2 (Riboflavin) 1.4 mg 1.3 mg 0.8 mg
Niacin (Nicotinamide) 18 mg 12 mg 10.29 mg
Asam Folat 400 µg 400 µg 228.57 µg
Vitamin B-6 (Pyridoxine) 1.9 mg 1.2 mg 1.09 mg
Vitamin B-12
(Cyanocobalamin) 2.6 µg 2.4 µg 1.49 µg
Vitamin C (As. Ascorbat) 70 mg 75 mg 40 mg
Zink (zinc sulphate) 15 mg 14 mg 8.57 mg
Iron (Ferrous fumarate) 30 mg 26 mg 17.14 mg
Copper (Copper sulfate) 2 mg 890 mcg 1.14 mg
Selenium (Sodium selenite) 65 µg 30 µg 37.14 µg
Iodine (potassium iodide) 150 µg 150 µg 85.71 µg
Iron-Folic Acid Supplement
Iron (ferrous sulfat) 60 mg 26 mg 17.14 mg
Folic acid 250 µg 400 µg 71.42 µg
Table 1. The composition of the multiple micronutrients (MMN) and iron-folic acid supplement,
nutrient supply from each supplements for adolescent girls
Supplement consumption : twice weekly for 26 weeks

Quality C
ontrol & E
thic Aspect
9
POWER OF RESEARCH
Standardization of field workers by training Socialization to the principal, classroom teachers, and
guidance and counseling teacher Validation anthropometric instrument Calibration
tool Weight and height body measurements conducted by
researchers assisted the enumerators Supplements are given by the class teacher
accompanied the research team

10
The progress of the
research sample
R
E
S
U
L
T
DO 37 org (25%)
IFA = 19 org (26%); MMN =
18 org (24%)
(p = 0.78)
Number of Subjects Screened (N = 1064) persons
The number of subjects who’s Anemia
(HemoCue)
(N = 148 org)
Not fulfill inclusion & exclusion criteria = 916
RANDOMIZATION
IFA (n = 73) MMN (n = 75)
Sample 1st Mo (n = 63)
Sample 1st Mo (n = 62)
Sample 2nd Mo (n = 56)
Sample 3rd Mo ( 59 )
Sample 3rd Mo
(56)
Sample 4th Mo
(n = 57)
Sample 4th Mo (n = 55)
Baseline
4 weeks intervention DO = 9 prs
8 weeks intervention DO = 8 prs
12 weeks
intervention
Baseline
8 weeks intervention DO = 3 prs
12 weeks
intervention
Sample 5th
Mo (no = 54)
Sample 6th Mo (n = 54)
Sample 2nd Mo (n = 59)
16 weeks intervention
DO = 2 prs
Sample 5th
Mo (n = 57)
Sample 6th Mo (n = 57)
16 weeks intervention
DO = 1 prs
20 weeks intervention
20 weeks intervention DO = 1 prs
Sampel 7th Mo (n =57)
Sampel 7th Mo (n = 54)
4 weeks intervention DO = 13 prs
24 weeks intervention
24 weeks intervention
26 weeks intervention
26 weeks intervention

11
Timing DO Reasons IFA [n, %] MMN [n, %]
1st Month
Maag/Heartburn 4 (5,5) 9 (12,0)
Nausea, Vomiting 2 (2,7) -
Abdominal paint 2 (2,7) 2 (2,7)
Headache/dizziness 1 (1,4) 2 (2,7)
2nd Month
Maag/Heartburn 1 (1,4) 1 (1,3)
Nausea, Vomiting 4 (5,5) -
Headache/dizziness 2 (2,7) 2 (2,7)
Change school 1 (1,4)
4th Month Maag/Heartburn 1 (1,4) 1 (1,3)
Dizzines, Nausea, Vomiting - 1 (1,3,)
5th Month Dizzines, Nausea 1 (1,4) -
R
E
S
U
L
T
Table 1. The reason of the subject to Drop Out (DO)

12
Table 2. Sample Characteristics Before Intervention
R
E
S
U
L
T
Variable IFA n (%) MMN n (%) Total N (%) P value
Age (yo) 16,02±0,8* 16,17±0,8* 16,09±0,8* 0,201
14
15
16
17
18
6 (11,1)
20 (37,0)
22 (40,7)
6 (11,1)
0 (0,0)
2 (3,5)
21 (36,8)
27 (47,4)
5 (8,8)
2 (3,5)
8 (7,2)
41 (36,9)
49 (44,1)
11 (9,9)
2 (1,8)
menstrual age (yo) 12,98±0,9* 13,25±0,9* 13,12±0,9* 0,082
11
12
13
14
15
1 (1,9)
17 (31,5)
23 (42,6)
8 (14,8)
5 (9,3)
1 (1,8)
9 (15,8)
27 (47,4)
15 (26,3)
5 (8,8)
2 (1,8)
26 (23,4)
50 (45,0)
23 (20,7)
10 (9,0)
Pocket Money (IDR/day) 12648±8077* 10710±5654* 11653±6975* 0,312
≥ 10,000
< 10,000
35 (64,8)
19 (35,2)
36 (63,2)
21 (36,8)
71 (64,0)
40 (36,0)
Money to buy snacks (IDR/day) 6462±4546* 5271±2208* 5851±3577* 0,582
≥ 10,000
< 10,000
13 (24,1)
41 (75,9)
4 (7,0)
53 (93,0)
17 (15,3)
94 (84,7)
Weight (kg) 45,09±7,5 45,02±7,6 45,05±7,5 0,992
Height (cm) 151,3±4,7 151,7±4,9 151,5±4,8 0,671
HAZ-score -1,69±0,7 -1,59±0,7 -1,61±0,7 0,761
BAZ-score -0,52±0,9 -0,58±0,8 -0,55±0,9 0,771

13
Table 3. Family Characteristics of Respondents
R
E
S
U
L
T
Variable IFA
n (%)
MMN
n (%)
Total
N (%)
p value
Family Size (person) 5,9±2,0* 5,7±2,2* 5,8±2,1* 0,61
≤ 4
5-6
≥ 7
15 (27,8)
28 (51,9)
11 (20,4)
17 (29,8)
23 (40,4)
17 (29,8)
32 (28,8)
51 (45,9)
28 (25,2)
Education Fathers (yo) 9,6±3,9* 8,9±3,9* 9,2±3,9* 0,47
None
Unfinished primary school
Completed primary school
Unfinished secondary school
Completed secondary school
Unfinished high school
Completed high school
Diploma/Graduate
1 (1,9)
11 (20,4)
5 (9,3)
4 (7,4)
10 (18,5)
0 (0,0)
14 (25,9)
9 (16,7)
2 (3,5)
10 (17,5)
13 (22,8)
2 (3,5)
6 (10,5)
1 (1,8)
17 (29,8)
6 (10,5)
3 (2,7)
21 (18,9)
18 (16,2)
6 (5,4)
16 (14,4)
1 (0,9)
31 (27,9)
15 (13,5)
Education Mothers (yo) 8,9±4,0* 8,3±3,5* 8,6±3,8* 0,48
None
Unfinished primary school
Completed primary school
Unfinished secondary school
Completed secondary school
Unfinished high school
Completed high school
Diploma/Graduate
3 (5,6)
13 (24,1)
3 (5,6)
0 (0,0)
14 (25,9)
0 (0,0)
15 (27,8)
6 (11,1)
1 (1,8)
10 (17,5)
19 (33,3)
3 (5,3)
5 (8,8)
1 (1,8)
14 (24,6)
4 (7,0)
4 (3,6)
23 (20,7)
22 (19,8)
3 (2,7)
19 (17,1)
1 (0,9)
29 (26,1)
10 (9,0)

14
R
E
S
U
L
T
Table 4. Intake of Nutrient of Female Adolescent Before Intervention
Nutrients
Age 14-15 yo p
Value# IFA
%RDA MMN
%RDA RDA
2013 mean±SD mean±SD
Energy (kkal) 1478,0±695,8 69,6 1495,1±522,6 70,4 2125 0,561
Protein (g) 46,8±18,7 67,8 54,6±29,8 79,1 69 0,284
Vit.A (RE) 366,2±565,8 61,0 367,5±403,6 61,2 600 0,920
Vit.B1 (mg) 0,2±0,4 17,5 0,3±0,4 23,7 1,1 0,570
Vit. B2 (mg) 0,6±0,6 44,4 0,7±0,6 50,2 1,3 0,663
Vit. B3 (mg) 6,1±2,6 50,9 7,3±5,8 60,5 12 0,612
Vit. B6 (mg) 0,8±0,5 70,5 0,9±0,4 76,1 1,2 0,593
Vit. B12 (µg) 2,6±1,4 107,4 2,6±1,6 106,9 2,4 0,943
Asam Folat (µg) 97,9±49,9 24,5 103,8±52,7 26,0 400 0,645
Vit. C (mg) 33,8±84,9 52,1 14,3±21,9 22,1 65 0,602
Vit. D (mg) 7,3±5,8 48,9 7,2±5,7 47,8 15 0,896
Vit. E (mg) 4,7±3,2 31,0 4,2±2,9 27,8 15 0,544
Fe (mg) 6,2±4,6 23,8 6,5±3,8 25,1 26 0,225
Zn (mg) 4,9±2,4 30,5 5,4±2,4 33,7 16 0,243
# Mann Whitney Test

15
Nutrients
Age 16-18 yo
p Value# IFA %RDA
MMN %RDA RDA
mean±SD mean±SD
Energy (kkal) 1673,8±629,7 78,8 1496,3±630,4 70,4 2125 0,198
Protein (g) 54,3±22,9 92,1 52,6±23,9 89,1 59 0,620
Vit.A (RE) 349,4±263,8 58,2 355,3±351,3 59,2 600 0,400
Vit.B1 (mg) 0,4±0,4 35,1 0,3±0,4 27,5 1,1 0,712
Vit. B2 (mg) 0,7±0,7 54,8 0,7±0,6 51,2 1,3 0,830
Vit. B3 (mg) 7,3±3,9 60,5 7,1±5,7 59,0 12 0,333
Vit. B6 (mg) 0,8±0,5 64,5 0,8±0,5 65,6 1,2 0.689
Vit. B12 (µg) 2,6±1,7 108,4 3,3±2,9 136,5 2,4 0,473
Folic Acid (µg) 120,2±58,3 30,1 109,4±69,3 27,3 400 0,229
Vit. C (mg) 16,5±21,6 22,0 15,5±16,8 20,6 75 0,483
Vit. D (mg) 7,0±5,7 46,8 7,0±4,8 46,7 15 0,701
Vit. E (mg) 4,9±3,0 32,7 3,8±2,7 25,3 15 0,087
Fe (mg) 8,2±5,4 31,5 6,9±5,0 26,4 26 0,157
Zn (mg) 5,9±2,6 42,2 5,2±2,4 37,5 14 0,290
# Mann Whitney Test
………..continue
R
E
S
U
L
T

16
R
E
S
U
L
T
Table 5. Compliance of supplement consumption on Both Intervention
Group
Variable
BAF Group
(mean±SD)
n = 54
MMN Group
(mean±SD)
n = 57
Total
(mean±SD)
n = 111
p Value
The number of supplements
taken (seed)
(min-max)
45,56±3,7
(36 – 51)
45,9±3,7
(34 – 51)
45,8±3,7
(34 – 51) 0,6121
% supplement consumption
(min-max)
87,6±7,1
(69,2 – 98,1)
88,3±7,0
(65,4 – 98,1)
87,97±7,1
(65,4 – 98,1) 0,6121
Compliance supplements
[n,(%)] 0,8112
≥ 80% 46 (85,2) 50 (87,1) 96 (86,5)
70 – 79% 6 (11,1) 6 (10,5) 12 (10,8)
< 70% 2 (3,7) 1 (1,8) 3 (2,7)
1 mann whitney; 2 chi-square

17
Nutrient
Supplement
Contribution
/day
% from
intake
total
Mean of
micronutrien
t intake
% from
intake
total
Intake Total
(Supl+Intake)
%
RDA
RDA
2013
IFA Group
Iron (mg) 17,4 77,3 5,1 22,7 22,5 86,5 26
Folic acid (µg) 71,4 42,3 97,2 57,7 168,6 42,1 400
MMN Group
Vitamin A (RE) 457,1 51,5 429,9 48,5 887 147,8 600
Vitamin D (µg) 2,86 33,8 5,6 66,2 8,46 56,4 15
Vitamin E (mg) 5,71 55,9 4,5 44,1 10,21 68,1 15
Vitamin B-1 (mg) 0,8 65,0 0,43 35 1,23 111,8 1,1
Vitamin B-2 (mg) 0,8 57,1 0,6 42,9 1,4 107,7 1,3
Niacin (mg) 10,29 58,8 7,2 41,2 17,49 145,7 12
Vitamin B-6 (mg) 1,09 57,7 0,8 42,3 1,89 157,5 1,2
Asam Folat (µg) 228,57 65,5 120,5 34,5 349,07 87,3 400
Vitamin B-12 (µg) 1,49 34,7 2,8 65,3 4,29 178,8 2,4
Vitamin C (mg) 40 67,0 19,7 33,0 59,7 91,8 65
Zink (mg) 8,57 59,6 5,8 40,4 14,37 89,8 16
Zat besi (mg) 17,14 70,1 7,3 29,9 24,44 94,0 26
Copper (µg) 1,14 800
Selenium (µg) 37,14 30
Iodine (µg) 85,71 150
Table 6. Supplement and Intake Contribution on total intake of micronutrient per
day for age group 14-15 yo after intervention
R
E
S
U
L
T

18
Table 7. Contribution of Supplement and Intake on total intake of micronutrient
per day for age group 16-18 yo after intervention
Nutrient Supplement
Contribution/d
ay
% from
intake
total
Mean of
micronutri
ent intake
% from
intake
total
Intake Total
(Supl+Intake)
%
RDA
RDA
2013
IFA group
Fe (mg) 17,4 72,2 6,7 27,8 24,1 92,7 26
Folic acid (µg) 71,4 37,6 118,5 62,4 189.9 47,5 400
MMN Group
Vitamin A (RE) 457,1 59,3 313,8 40,7 770,9 221,7 600
Vitamin D (µg) 2,86 30,2 6,6 69,7 9,46 63,1 15
Vitamin E (mg) 5,71 64,1 3,2 35,9 8,91 59,4 15
Vitamin B-1 (mg) 0,8 66,7 0,4 33,3 1,2 109,1 1,1
Vitamin B-2 (mg) 0,8 61,5 0,5 38,5 1,3 100,0 1,3
Niacin (mg) 10,29 58,2 7,4 41,8 17,69 147,4 12
Vitamin B-6 (mg) 1,09 57,7 0,8 42,3 1,89 157,5 1,2
Asam Folat (µg) 228,57 68,4 105,7 31,6 334,27 83,6 400
Vitamin B-12 (µg) 1,49 31,1 3,3 68,9 4,79 220,4 2,4
Vitamin C (mg) 40 69,7 17,4 30,3 57,4 76,5 75
Zinc (mg) 8,57 59,6 5,8 40,4 14,37 102,6 14
Iron (mg) 17,14 73,1 6,3 26,9 23,44 90,1 26
Copper (µg) 1,14 890
Selenium (µg) 37,14 30
Iodine (µg) 85,71 150
R
E
S
U
L
T

19
Table 8 : Average on body weight, height, BAZ-Score and HAZ score
before and after intervention
Variable
Intervention Groups
p Value IFA
(mean±SD) n = 54
MMN (mean±SD)
n = 57
Total (mean±SD)
N = 111
Body weight (kg)
Baseline 45,09±7,55 45,02±7,58 45,05±7,53 0,993# (min-max) (34,70-76,00) (35,00-76,50) (34,70-76,50) Endline 45,55±7,78 45,49±7,56 45,52±7,63 0,839# (min-max) (34,85-73,80) (33,85-75,20) (33,85-75,20) Diffrence 0,46±2,1 0,47±2,3 0,47±2,2 0,918# p value 0,289* 0,226* 0,106*
Height (cm)
Baseline 151,3±4,7 151,7±4,9 151,5±4,8 0,6661 (min-max) (140,8-165,2) (140,5-164,4) (140,5-165,2)
Endline 151,8±4,8 152,3±4,9 152,1 ±4,8 0,6511 (min-max) (140,8-165,4) (142,5-165,1) (140,8-165,4) Diffrence 0,53±0,42 0,55±0,45 0,54±0,44 0,8471
p value 0,0002 0,0002 0,0002
BAZ-score
Baseline -0,52±0,98 -0,57±0,88 -0,55±0,92 0,7681 (min-max) (-1,99 -1,81) (-2,16 - 2,29) (-2,16 – 2,29) Endline -0,55±1,01 -0,60±0,89 -0,58,1 ± 0,95 0,7771 (min-max) (-2,43 -1,88) (-2,34 - 2,12) (-2,43 - 2,12) Diffrence -0,03±0,38 - 0,03±0,43 -0,03±0,41 0,9931
p value 0,6042 0,6482 0,4912
HAZ-score
Baseline -1,63±0,69 -1,59±0,73 -1,61±0,71 0,7561 (min-max) (-2,96 - 0,39) (-3,30 - 0,28) (-3,30 - 0,39) Endline -1,58±0,75 -1,55±0,73 -1,57 ± 0,74 0,8511 (min-max) (-3,05 - 0,39) (-3,05 - 0,35) (-3,05 - 0,39) Diffrence 0,05±0,21 0,03±0,07 0,04±0,15 0,5971 p value 0,0972 0,0012 0,0072
#Mann whitney; *Wilcoxon, 1T Independent Test; 2Paired T Test
R
E
S
U
L
T

20
Variable
Group
p Value IFA
(mean±SD)
MMN
(mean±SD)
Total
(mean±SD)
14-15 yo
Weight
(kg)
Baseline 44,98±7,82 46,47±9,58 45,58±8,41 0,739#
(min-max) (36,30-61,85) (35,00-67,55) (35,70-67,55)
Endline 46,32±9,03 47,48±10,22 46,78±9,33 0,739#
(min-max) (36,05-69,35) (34,60-67,95) (34,60-69,35)
Difference 1,34±2,47 1,01±2,05 1,21±2,27 0,935#
p value 0,073* 0,139* 0,016*
Height
(cm)
Baseline 151,7±5,29 151,9±5,14 151,8±5,12 0,924##
(min-max) (140,8-160,0) (144-159,9) (140,8-160,0)
Endline 152,3±5,48 152,4±5,2 152,4±5,26 0,984##
(min-max) (140,80-161,0) (144,5-160,5) (140,8-161,0)
Difference 0,65±0,51 0,49±0,42 0,59±0,47 0,407##
p value 0,001** 0,005** 0,000**
16-18 yo
Weight
(kg)
Sebelum 45,14±7,96 45,65±7,75 45,42±7,78 0,713#
(min-max) (34,70-76,00) (35,40-76,50) (34,70-76,50)
Sesudah 45,09±7,43 45,85±7,44 45,51±7,39 0,529#
(min-max) (34,85-73,80) (33,85-75,20) (33,85-75,20)
Selisih -0,05±1,9 0,20±2,3 0,09±2,1 0,697#
P value 0,690* 0,993* 0,793*
Height
(cm)
Sebelum 151,3±4,4 152,4±5,4 151,9±4,96 0,366##
(min-max) (144,0-165,2) (140,5-164,4) (140,5-165,2)
Sesudah 151,7±4,5 153,0±5,3 152,4 ±4,95 0,305##
(min-max) (144,6 -165,4) (142,5-165,1) (142,5-165,4)
Selisih 0,4±0,4 0,6±0,5 0,5±0,4 0,166##
P value 0,000** 0,000** 0,000**
*ujwilcoxon; # Mann Whitney; ** T berpasangan; ## T independent
Table 9. Anthropometric measurement subject before and after
intervention based on age group
R
E
S
U
L
T
21
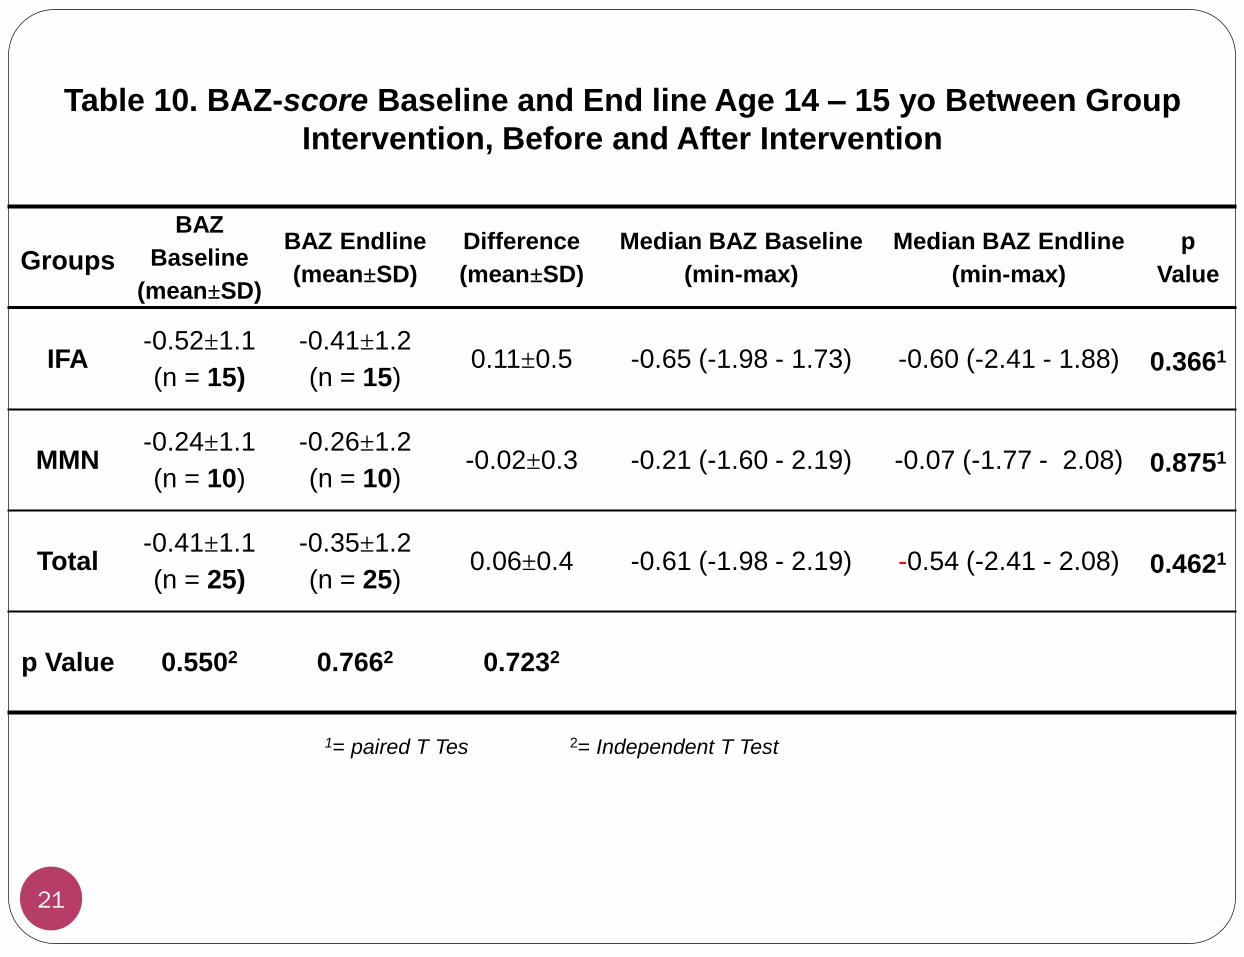
1= paired T Tes 2= Independent T Test
Groups
BAZ
Baseline
(mean±SD)
BAZ Endline
(mean±SD)
Difference
(mean±SD)
Median BAZ Baseline
(min-max)
Median BAZ Endline
(min-max)
p
Value
IFA -0.52±1.1
(n = 15)
-0.41±1.2
(n = 15) 0.11±0.5 -0.65 (-1.98 - 1.73) -0.60 (-2.41 - 1.88) 0.3661
MMN -0.24±1.1
(n = 10)
-0.26±1.2
(n = 10) -0.02±0.3 -0.21 (-1.60 - 2.19) -0.07 (-1.77 - 2.08) 0.8751
Total -0.41±1.1
(n = 25)
-0.35±1.2
(n = 25) 0.06±0.4 -0.61 (-1.98 - 2.19) -0.54 (-2.41 - 2.08) 0.4621
p Value 0.5502 0.7662 0.7232
Table 10. BAZ-score Baseline and End line Age 14 – 15 yo Between Group
Intervention, Before and After Intervention
22
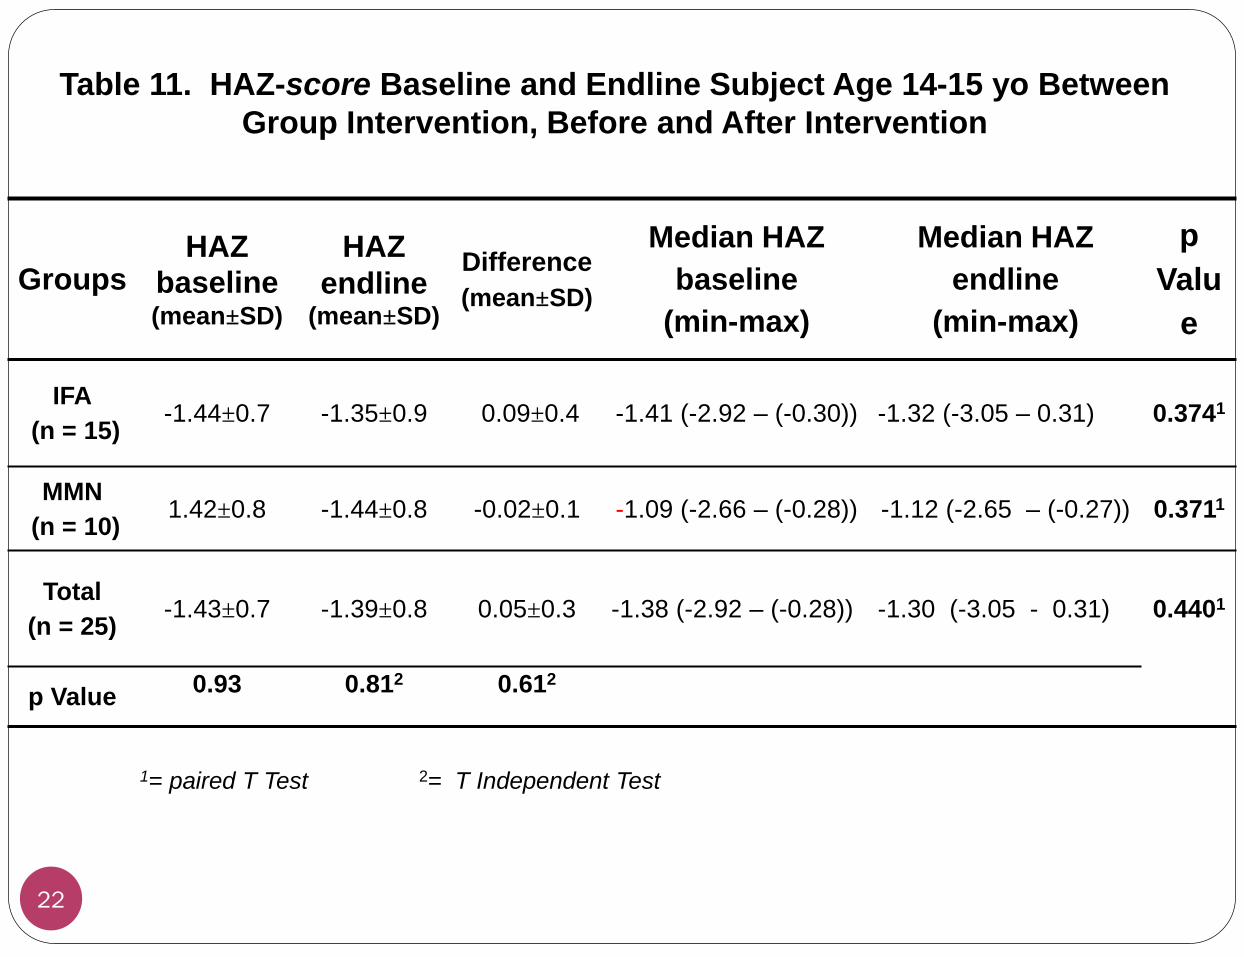
1= paired T Test 2= T Independent Test
Groups HAZ
baseline (mean±SD)
HAZ
endline (mean±SD)
Difference
(mean±SD)
Median HAZ
baseline
(min-max)
Median HAZ
endline
(min-max)
p
Valu
e
IFA
(n = 15) -1.44±0.7 -1.35±0.9 0.09±0.4 -1.41 (-2.92 – (-0.30)) -1.32 (-3.05 – 0.31) 0.3741
MMN
(n = 10) 1.42±0.8 -1.44±0.8 -0.02±0.1 -1.09 (-2.66 – (-0.28)) -1.12 (-2.65 – (-0.27)) 0.3711
Total
(n = 25) -1.43±0.7 -1.39±0.8 0.05±0.3 -1.38 (-2.92 – (-0.28)) -1.30 (-3.05 - 0.31) 0.4401
p Value 0.93 0.812 0.612
Table 11. HAZ-score Baseline and Endline Subject Age 14-15 yo Between
Group Intervention, Before and After Intervention

23
Indikator Kel. BAF Kel. MGM Total
Sebelum Sesudah Sebelum Sesudah Sebelum Sesudah
Status Gizi (IMT/U) [n, (%)] Obes 0 0 1 (10,0) 1 (10,0) 1 (4,0) 1 (4,0)
Gemuk 2 (13,3) 3 (20,0) 0 0 2 (8,0) 3 (12,0)
Kurus 0 2 (13,3) 0 0 0 2 (8,0)
Normal 13 (86,7) 10 (66,7) 9 (90,0) 9 (90,0) 22 (88,0) 19 (76,0)
Status Gizi (TB/U) [n, (%)] Sangat pendek 0 1 (6,7) 0 0 0 1 (4,0)
Pendek 3 (20,0) 2 (13,3) 3(30,0) 3(30,0) 6 (24,0) 5 (20,0)
Normal 12 (80,0) 18 (64,3) 7 (70,0) 7 (70,0) 19 (76,0) 19 (76,0)
Status Gizi (IMT/U Dan TB/U) Subyek Umur 14-15 Tahun
Sebelum dan Setelah Intervensi

24
Indikator Kel. BAF Kel. MGM Total
Sebelum Sesudah Sebelum Sesudah Sebelum Sesudah
Status Gizi (IMT/U) [n, (%)] Obes 0 0 1 (2,9) 1 (2,9) 1 (1,6) 1 (1,6)
Gemuk 2 (7,1) 2 (7,1) 0 1 (2,9) 2 (3,2) 3 (4,8)
Kurus 0 1 (3,6) 1 (2,9) 1 (2,9) 1 (1,6) 2 (3,2)
Normal 26 (92,9) 25 (89,3) 32 (94,1) 31 (91,2) 58 (93,5 56 (90,3)
Status Gizi (TB/U) [n, (%)] Sangat pendek 0 0 1 (2,9) 1 (2,9) 1 (1,6) 1 (1,6)
Pendek 11 (39,3) 10 (35,3) 8 (30,0) 6 (17,6) 19 (30,6) 16 (25,8)
Normal 17 (60,7) 18 (64,3) 25 (70,0) 27 (79,4) 42 (67,7) 45 (72,6)
Status Gizi (IMT/U dan TB/U) Subyek Umur 16-18 Tahun
Sebelum dan Setelah Intervensi

25
Nutritional Status Subject of Age 14 – 15 yo Before and After Intervention
0
20
40
60
80
Severe stunted -->stunted
Stunted --> Stunted Normal --> Normal
6.7 13.3
80
0
30
70
IFA MMN
Chi-square IFA (p=0.001); MMN (p=0.008)
Chi-square IFA (p = 0.010); MMN (p = 0,002)
0
20
40
60
80
100
Normal -->Normal
Normal -->Thinnes
Normal -->Overweight
Overweight -->Overweight
Obes --> Obes
66.7
13.3 6.7
13.3
0
90
0 0 0 10
IFA MMN

26
Groups
BAZ
Baseline
(mean±SD)
BAZ
Endline
(mean±SD)
Difference
(mean±SD)
Median BAZ
Baseline
(min-max)
Median BAZ
Endline
(min-max)
p
Value
IFA
(n = 28) -0.57±0.9 -0.66±0.9 -0.08±0.3 -0.67 (-1.88 - 1.81) -0.78 (-2.14 - 1.59) 0.2161
MMN
(n = 34) -0.59±0.9 -0.66±0.8 -0.06±0.4 -0.70 (-2.16 - 2.29) -0.66 (-2.34 - 2.12) 0.3741
Total
(n = 62) -0.58±0.9 -0.66±0.8 -0.07±0.4 -0.70 (-2.16 - 2. 29) -0.69 (-2.34 - 2.12) 0.1411
p Value 0.9402 0.9962 0.9942
Ket 1= paired T Test 2= T Independent Test
Table 12. BAZ-score Baseline and End line subject Age 16-18 yo Between
Group Intervention, Before and After Intervention

27
Groups
HAZ
Baseline
(mean±SD)
HAZ
Endline
(mean±SD
Difference
mean±SD
Median HAZ
Baseline
(min-max)
Median HAZ
Endline
(min-max)
p
Value
IFA
(n = 28) -1.71±0.7 -1.68±0.7 0.03±0.05 -1.88 (-2.79 - 0.39) -1.82 (-2.74 - 0.39) 0.0081
MMN
(n = 34) -1.53±0.8 -1.48±0.8 0.05±0.07 -1.62 (-3.30 - 0.28) -1.53 (-3.05 – 0.35) 0.0001
Total
(n = 62) -1.61±0.7 -1.57±0.7 0.04±0.06 -1.66 (-3.30 - 0.39) -1.65 (-3.05 - 0.39) 0.0001
P Value 0.3552 0.2962 0.2252
Ket 1=T Independent Test 2= paired T Test
Table 13. HAZ-score Baseline and End line Subject Age 16-18 yo Between Group,
Before and After Intervention

28
Nutritional Status Subject of Age 16 – 18 yo Before and After Intervention
0
10
20
30
40
50
60
70
80
Severe stunted -->stunted
Stunted --> Stunted Stunted --> Normal Normal --> Normal
0
35.7
3.6
60.7
2.9
17.6
5.9
73.4
IFA MMN
0
20
40
60
80
100
Normal -->Normal
Normal -->Overweight
Thinnes -->Thinnes
Overweight -->Overweight
Obes --> Obes
89.3
3.6 0
7.1 0
91.2
2.9 2.9 0 2.9
IFA MMN
Chi- square IFA ( p = 0,000); MMN (p = 0,000)
Chi- square IFA (p = 0.000) ; MMN (p = 0,000

29
D
I
S
C
U
S
S
I
O
N
Changes in Nutritional Status (BAZ-score & HAZ) 14-15 yo)
IFA MMN
Mean BAZ-score ↑ (p>0.05) Mean BAZ-score ↓
(p>0.05)
BAZ-score
o earlier menstruation age (12.80±0.7
yo) (r = 0.515; p = 0.049),
o Increased body weight by 1,34±2.47
kg (r = 0.954; p = 0.000).
oDecreased levels of IGF-1 endline by
2.34±3.15 ng/ml (r = -0.657; p =
0.039)
oNeutrofil level baseline 54.1± 9.0% (r
= -0.766, p = 0.010)
oMonosit level baseline 6.9±1.5% (r =
0.765, p = 0.010).

30
o Earlier menstruation age (12.80±0.7 yo) (r = 0.567
p = 0.028) Earlier menstruation age IGF-1 concentrations
higher stimulates the proliferation and
differentiation of cells the growth of cells
and tissues
Menstrual delay leaving less time physiological
and anatomical maturation before becoming
pregnant, because bone growth is not perfect until a
few years after menstruation
o Increase the body weight Increasing Weight: IFA> MMN group
IFA
D
I
S
C
U
S
S
I
O
N

31
o Decreased level of IGF-1
IGF-1 The main regulator of somatic
growth and cell proliferation working
through the IGF-1 receptor. o The presence of inflammatory (neutrofil & monosit)
Increased inflammatory markers decreased levels of IGF-1 through the
suppression of GH-IGF-1axis mediate
failure of linear growth and nutritional status
disorders (Prendergast et al., 2014). interaction between the immune system and
endocrine is essential maintaining a balance
(Maggio M et. al., 2013).
MMN
D
I
S
C
U
S
S
I
O
N
32
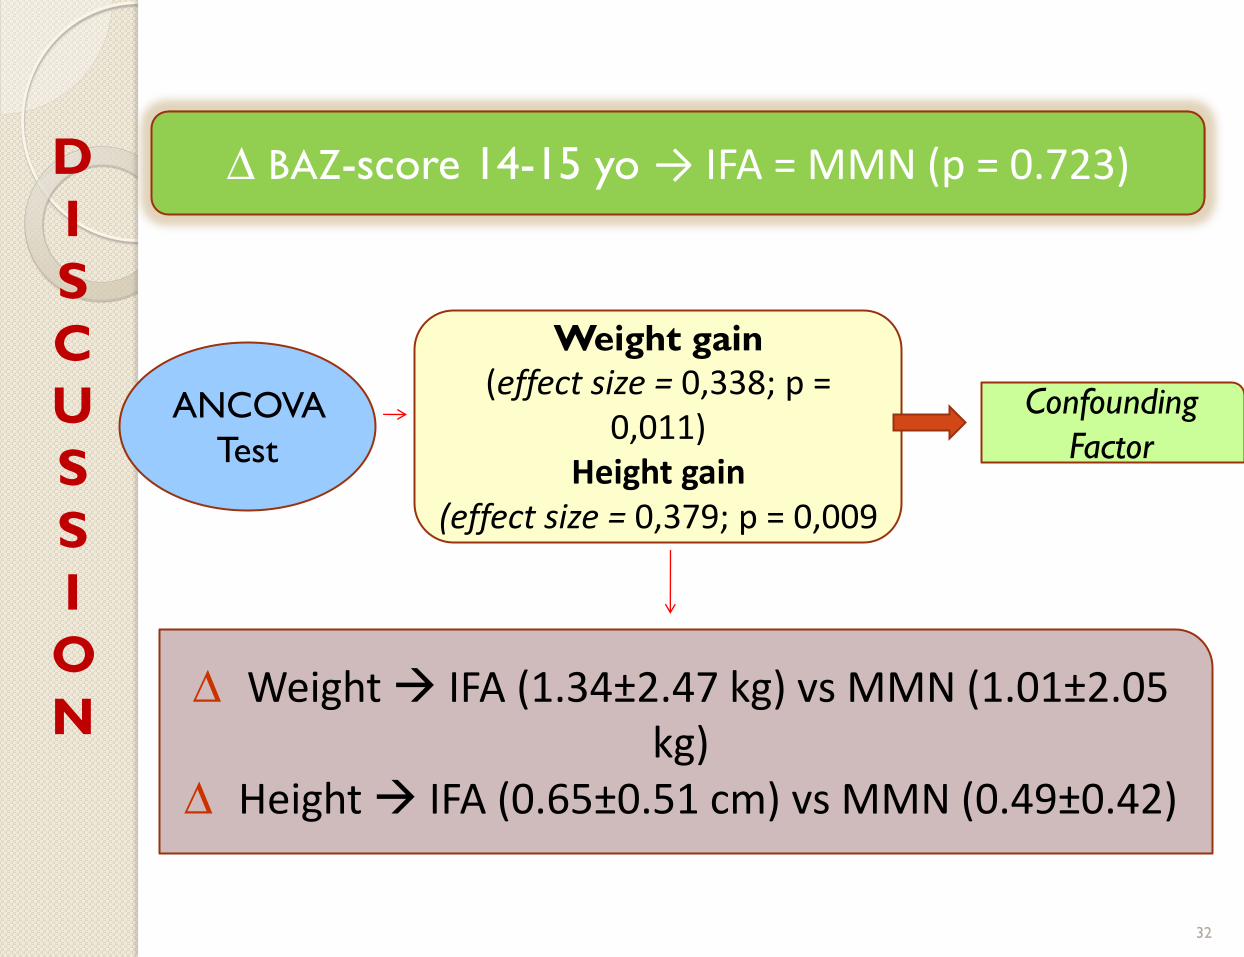
∆ BAZ-score 14-15 yo → IFA = MMN (p = 0.723)
ANCOVA
Test
Weight gain
(effect size = 0,338; p = 0,011)
Height gain (effect size = 0,379; p = 0,009
Confounding
Factor
∆ Weight IFA (1.34±2.47 kg) vs MMN (1.01±2.05 kg)
∆ Height IFA (0.65±0.51 cm) vs MMN (0.49±0.42)
D
I
S
C
U
S
S
I
O
N

33
Change of Nutritional Status (BAZ score) 16-18 yo
BAZ-score MMN IFA
BAZ Score ↓ (p>0.05)
BAZ score ↓ (p>0.05) >
Correlation Test o Thiamine intake endline
(r = 0.348; p = 0.044) o Folic acid intake endline
(r = 0.394; p = 0.021) o Monosit level endline (r
= 0.379; p = 0.020) o ∆ BW (r = 0.950; p =
0.000) o ∆ Height (r = -0.436 p =
0.010)
Correlation Test o Energy intake endline (r = -0.383; p = 0.044) o Vit. A intake endline (r = -0.510; p = 0.000) o Vit E intake endline (r = -0.441; p = 0.019) o Vit B1 intake endline (r = -0.543; p = 0.003) o Folic Acid intake endline (r = -0.579; p = 0.001) o Fosfor intake endline (r = -0.451; p = 0.016) o Fe intake endline (r = -0.379; p = 0.047) o Decreased of body weight -0.05±1.9 kg (r
= 0.970; p = 0.000)
o Increased of height 0.20±2.3 cm (r = -
0.501; p = 0.007)
D
I
S
C
U
S
S
I
O
N

34
o Energi intake endline Energy cells functional system (synthesis of cell
components) synthesis and growth Energy deficiency weight loss and tissue damage Chronic energy deficiency loss of energy
reserves and lean mass o Vit B Intake Vit. B coenzyme paired with cell enzyme control
of energy metabolism and tissue build
D
I
S
C
U
S
S
I
O
N
35
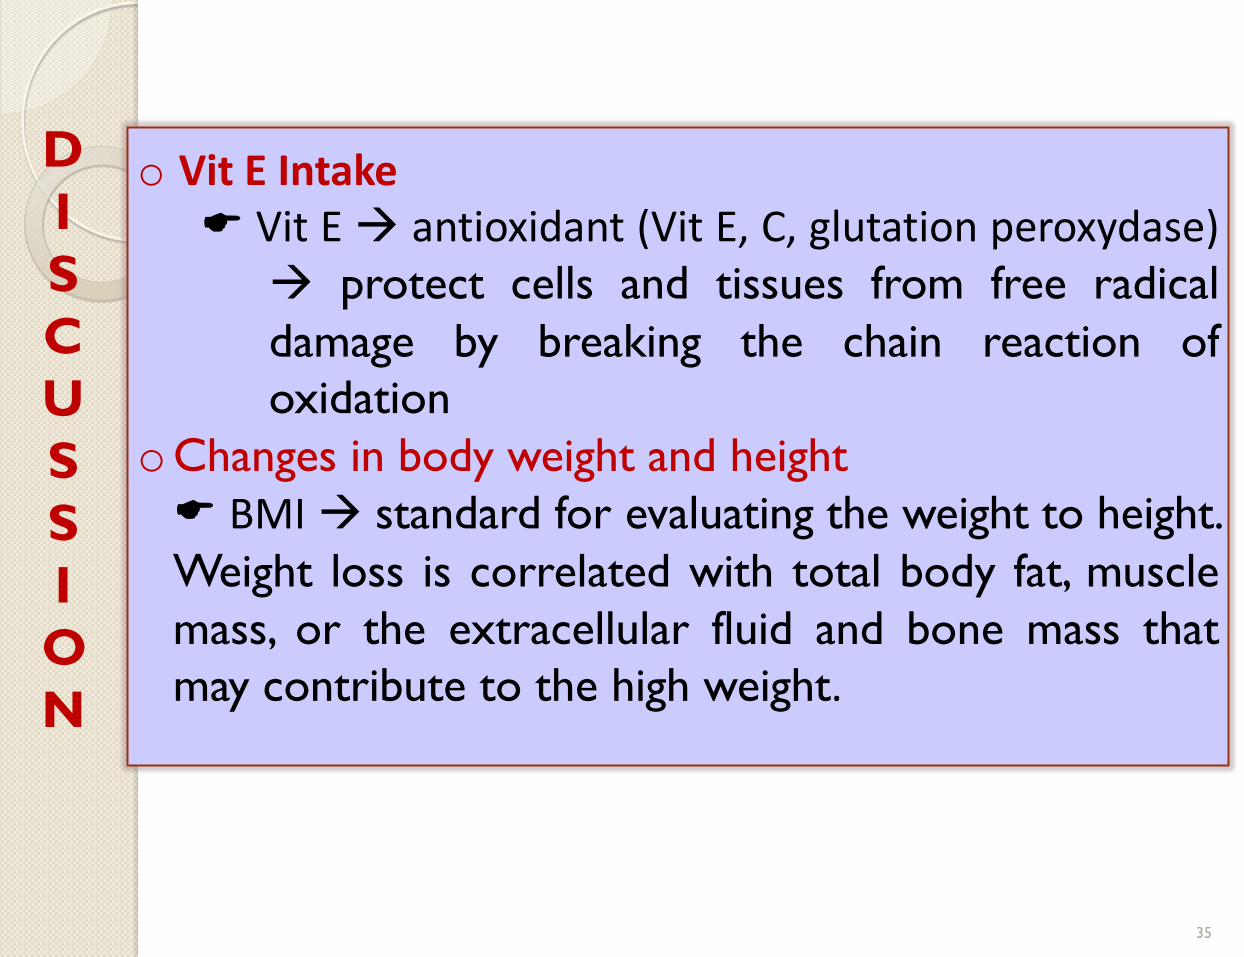
o Vit E Intake Vit E antioxidant (Vit E, C, glutation peroxydase)
protect cells and tissues from free radical
damage by breaking the chain reaction of
oxidation oChanges in body weight and height BMI standard for evaluating the weight to height.
Weight loss is correlated with total body fat, muscle
mass, or the extracellular fluid and bone mass that
may contribute to the high weight.
D
I
S
C
U
S
S
I
O
N

36
↓BAZ-score 16-18 yo → IFA = MMN (p = 0.994)
ANCOVA test
o
o∆ Body Weight (ES = 0.960; p = 0.000)
IFA (-0.05±1.9 kg) vs MMN (0.20±2.3 kg)
o ∆ Body Height (ES = 0.426; p = 0.000)
IFA (0.4±0,4 cm) vs MMN (0.6±0.5 cm)
Reduced in BAZ-score is higher in IFA groups – increasing in height lower in IFA group (0.4 ± 0.4 cm) compared to subjects in MMN group (0.6±0.5 cm), the size of body weight decreased after the intervention by 0.05 ± 1.9 kg in IFA group, otherwise, for MMN group, the size of body weight increased by 0.20±2.3 kg. Decreased in BAZ-score in both treatment groups due to the
change of body height (m2) as the denominator BAZ faster than body weight (numerator).
D
I
S
C
U
S
S
I
O
N

Based on the age of subject that obtained of same supplement :
IFA Supplement
Increased of BAZ-score in 14-15 yo VS 16-18 yo decreased
in the younger age groups in conjunction growth spurt in adolescents and increased iron requirements
MMN Supplement
impairment HAZ-score in both age groups is not due to the effect of treatment but due to other factors such as intake of various nutrients are reduced, levels of IGF-1 decreased and the presence of inflammation
37
D
I
S
C
U
S
S
I
O
N

38
Kanani et. al (2000) IFA supplementation in girls aged 14-
18 years for 3 months did not have a significant effect on BMI
change the subject FA
Systematic review of 201 studies conducted by Das et. al.
(2013) that the fortification multi micronutrient not
associated with WAZ (weight for age z-scores) and WHZ
(weight for height z-scores)
D
I
S
C
U
S
S
I
O
N

39
HAZ-score
Mean HAZ-score ↑ (p>0.05)
o Early Menstruation age (2.93±0.7 hari) (r = 0.567 p = 0.049) o Protein intake endline ↓ : 40.6±18.7 g (r = -0.536,
p = 0.040) o Increasing of body height by 0.65±0.51 cm (r =
0.970, p = 0.000)
14-15 yo
(IFA)
D
I
S
C
U
S
S
I
O
N

40
o First menstruation age
Early menstrual age IGF↑ working through the
IGF-1 receptor proliferation of bone chondrosit enhance the growth of long bones
Protein intake endline ↓ Def. energy & Protein restrict of IGF-1 synthesis
significantly causing 50% reduction of IGF-1 concentration in circulation
o Increasing of body height
Height parameter of measurement HAZ-score
Height ↑ HAZ-score
D
I
S
C
U
S
S
I
O
N

41
HAZ-score
Mean HAZ-score ↓ (p>0.05)
o
oProtein intake endline ↓ ( 50.4±22.9 g) (r = -0.845, p = 0.050) oThiamin intake endline↓ (0.4±0.2 mg) (r = -0.632, p = 0.050) o Riboflavin intake tendline ↓ (0.5±0.4 mg) (r = -0.796, p = 0.006) o Niacin intake endline ↓ (7.4±4.6 mg) (r = -0.748, p = 0.013) o Pyridoxine endline ↓ (0.8±0.7 mg) (r = -0.790, p = 0.007) o Folic acid endline ↓ (105.7±65.9 µg) (r = -0.692, p = 0.027) o Cyanocobalamine intake endline ↓ (3.3±2.7 µg) (r = -0.869, p =
0.001) o Fe intake endline ↓ (6.3±3.9 mg) (r = -0.754, p = 0.012) o Zn intake endline ↓ (5.8±5.2 mg) (r = -0.839, p = 0.002)
14-15 yo
(MMN) D
I
S
C
U
S
S
I
O
N

42
oVit B1, B2, B3, B6, asam folat & B12 intake endline ↓ B1 Coenzyme that controls energy metabolism. B1 Deficiency loss body weight B2 Coenzyme FMN & FAD metabolism energy ,
protein, carbohydrate and fat acid ATP cellular
respiration in mitochondria. B2 ↓ FMN and FAD concentrations in tissue reduced changes in the structure and function B3 synthesis of protein (histone) in the cell nucleus bound
to DNA help repair DNA strand fragments resulting from
the oxidation, radiation and environmental stressors. Def. B3 disorders of growth and nutritional status
oProtein intake endline ↓ Protein ↓ limiting the synthesis of IGF-1 concentrations
of IGF-1 and GH receptor decreases in circulating linear
growth disturbance
D
I
S
C
U
S
S
I
O
N

43
B6 plays a role in the synthesis of RNA and
DNA, coenzyme (PLP) metabolism of
proteins, fats, and glucose , nucleic acid
Def. B6 impaired growth and nutritional
status Folic Acid DNA & RNA Production in growth &
cell differenciation growth & developlment B12 co-factor metionin sintetase and
metilmalonin-KoA mutase enzyme normal
function of all cells metabolism & synthesis of nucleic acid & DNA
D
I
S
C
U
S
S
I
O
N

44
oIron Intake synthesis Hb supply/transport O2 growth of
cell & tissue. not influence growth directly through hormone
system BUT encourage growth when iron reserve depleted sickness growth failure
Def. delivery of O2 to tissue↓ & functional activity of enzyme containing iron in various tissue ↓
D
I
S
C
U
S
S
I
O
N

45
o Zinc Intake plays a role in cell proliferation through: enzyme system division & cell proliferation (DNA
polymerase, RNA polymerase ) & regulate synthesis of DNA & RNA
hormone regulation (GH & IGF-1) signaling of IGF-1 hormone induction of proliferation and division cell
zinc containing nucleoprotein gen expression of protein growth
D
I
S
C
U
S
S
I
O
N

46
∆ HAZ-score 14-15 Yo → IFA = MMN (p = 0.384)
ANCOVA Test
oFirst age of menstruation(ES : 0.457; p = 0.032)
o Protein intake endline (ES: 0.409; p =0.046)
oVit. B3 intake endline (ES : 0.402; p = 0.049)
Menstruation Age faster in IFA group (12.80 ± 0.7 yo)
vs. the MMN group (13.20 ± 1.2 yo) followed at
increase in the value of the HAZ-score Intake of protein and vitamin B3 endline higher in
MMN group vs. IFA group
D
I
S
C
U
S
S
I
O
N

47
HAZ-score
16-18 yo IFA MMN
Mean HAZ-score
↑(p<0.05 Mean HAZ-score
↑(p<0.05 <
Correlation Test
Height (r = 0.990, p =
0.000)
Family size (r = 0.380; p =
0.046)
Correlation Test
Height (r = 0.983, p =
0.000)
D
I
S
C
U
S
S
I
O
N

48
↑ HAZ-score of 16-18 yo → IFA = MMN (p = 0.225)
ANCOVA test
∆ Height (ES = 0.984; p = 0.000) IFA Group (0.4±0.4) vs MMN Group (0.6±0.5)
Family Size (ES = 0.108; p = 0.000) (IFA Group 5.96±2.0) vs MMN Group (6.09±2.3)
Female mature height attained at the age of 16 -
18 years (Lee, 2007). Lee (2007) cites the opinion of
Lindsay and Cosman (2005) linear growth of the
skeleton occurs in adolescence, - the bone is
continuously changing in size and shape in response
to pressure applied to the skeleton in a process
remodeling (Lee, 2007).
D
I
S
C
U
S
S
I
O
N

49
D
I
S
C
U
S
S
I
O
N
o Ramakrishnan et al (2004) systematic review
intervention only vitamin A or iron had no effect on the
growth of the child, but the multi-micronutrient
interventions every day increases the linear growth of
children aged <18 years
o Huy et al (2009)
multiple micronutrient supplements contribute to the
prevention of stunting
o Sivakumar et. al. (2006)
provision of healthier beverages containing multiple
micronutrients for 14 months in children aged 6-16
years in school have an impact on changes in the HAZ-
scores were significantly (p value = 0.016; power =
0.739

50
MMN supplement have better effect than IFA Supplement on linear growth (height and HAZ-scores) but not for muscle growth. So, its required effectiveness study to assess the effect of micronutrient supplementation on growth and nutritional status of girls adolescent

51