1 i. some facts on the korean economy area: 98,480 sq km slightly larger than indiana, us. mostly...
TRANSCRIPT

11
I. Some FactsI. Some Factson the Korean Economyon the Korean Economy
Area: 98,480 sq km slightly larger than Indiana, US.
Mostly hills and mountains
arable land: 17.44%
CIA – World Factbook
https://www.cia.gov/library/publications/the-world-factbook/
22
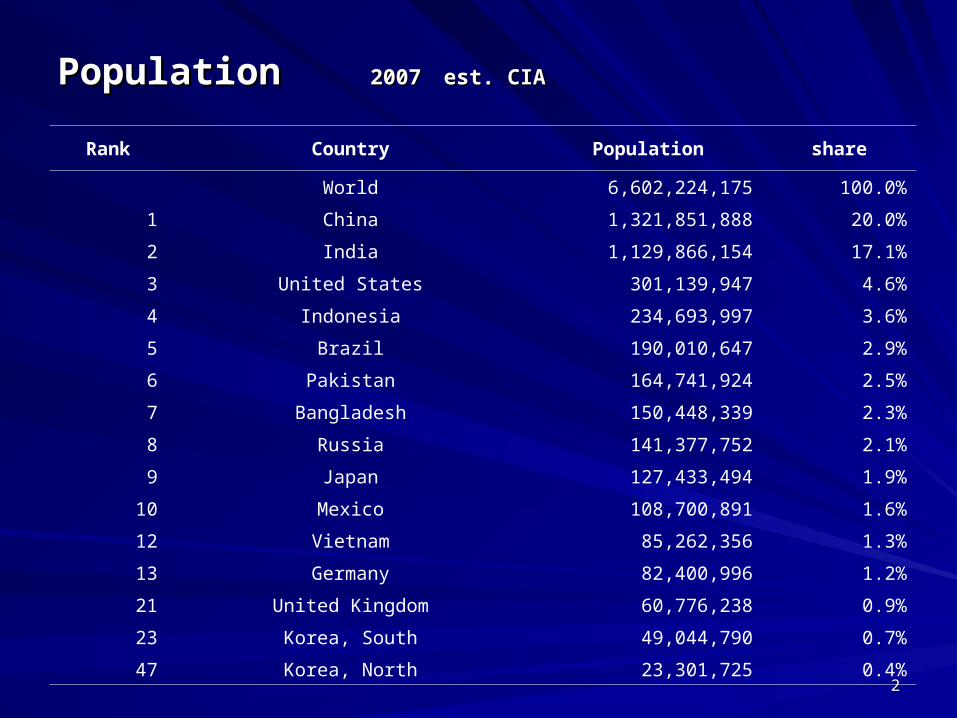
Population Population 20072007 est. CIAest. CIA
Rank Country Population share
World 6,602,224,175 100.0%
1 China 1,321,851,888 20.0%
2 India 1,129,866,154 17.1%
3 United States 301,139,947 4.6%
4 Indonesia 234,693,997 3.6%
5 Brazil 190,010,647 2.9%
6 Pakistan 164,741,924 2.5%
7 Bangladesh 150,448,339 2.3%
8 Russia 141,377,752 2.1%
9 Japan 127,433,494 1.9%
10 Mexico 108,700,891 1.6%
12 Vietnam 85,262,356 1.3%
13 Germany 82,400,996 1.2%
21 United Kingdom 60,776,238 0.9%
23 Korea, South 49,044,790 0.7%
47 Korea, North 23,301,725 0.4%

33
GDPGDP in international prices, 2006 est. CIAin international prices, 2006 est. CIA
Rank CountryGDP (purchasing power
parity)Share
World $65,950,000,000,000 100.0%
1 United States $13,130,000,000,000 19.9%
European Union $13,060,000,000,000 19.8%
2 China $10,170,000,000,000 15.4%
3 Japan $4,218,000,000,000 6.4%
4 India $4,156,000,000,000 6.3%
5 Germany $2,630,000,000,000 4.0%
6 United Kingdom $1,930,000,000,000 2.9%
7 France $1,891,000,000,000 2.9%
8 Italy $1,756,000,000,000 2.7%
9 Russia $1,746,000,000,000 2.6%
10 Brazil $1,655,000,000,000 2.5%
11 Korea, South $1,196,000,000,000 1.8%

44
ExportsExports current dollars, 2006 est. CIAcurrent dollars, 2006 est. CIA
Rank Country Exports
World $12,440,000,000,000
European Union $1,330,000,000,000
1 Germany $1,133,000,000,000
2 United States $1,024,000,000,000
3 China $974,000,000,000
4 Hong Kong $611,600,000,000
5 Japan $590,300,000,000
6 France $490,000,000,000
7 United Kingdom $468,800,000,000
8 Italy $450,100,000,000
9 Netherlands $413,800,000,000
10 Canada $405,000,000,000
11 Belgium $335,300,000,000
12 Korea, South $326,000,000,000
55
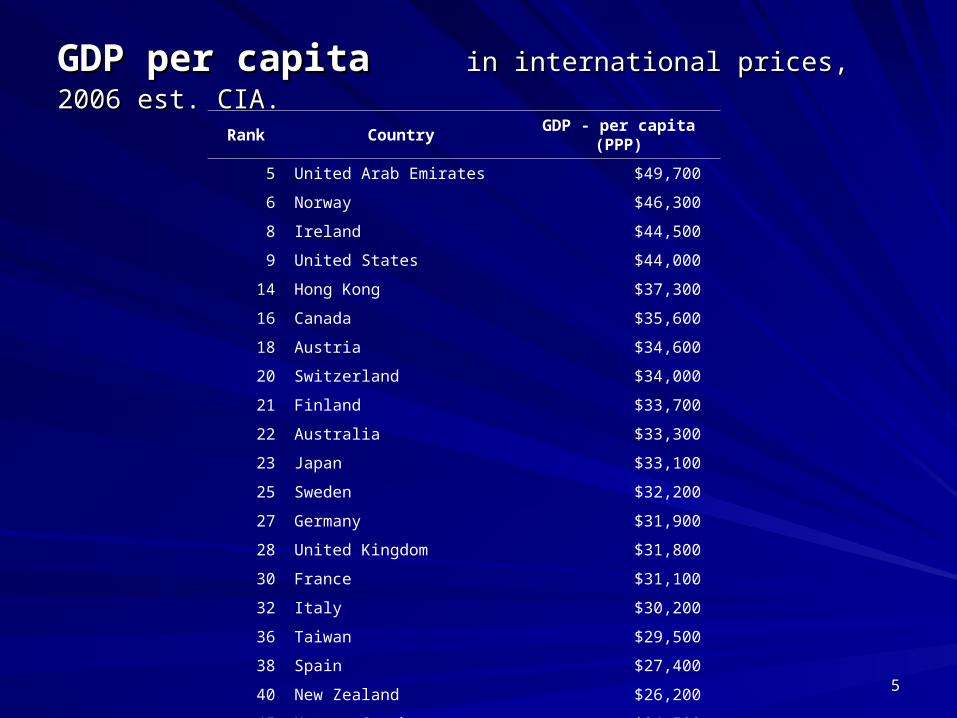
GDP per capitaGDP per capita in international prices, 2006 est. in international prices, 2006 est. CIA. CIA.
Rank CountryGDP - per capita
(PPP)
5 United Arab Emirates $49,700
6 Norway $46,300
8 Ireland $44,500
9 United States $44,000
14 Hong Kong $37,300
16 Canada $35,600
18 Austria $34,600
20 Switzerland $34,000
21 Finland $33,700
22 Australia $33,300
23 Japan $33,100
25 Sweden $32,200
27 Germany $31,900
28 United Kingdom $31,800
30 France $31,100
32 Italy $30,200
36 Taiwan $29,500
38 Spain $27,400
40 New Zealand $26,200
45 Korea, South $24,500
66
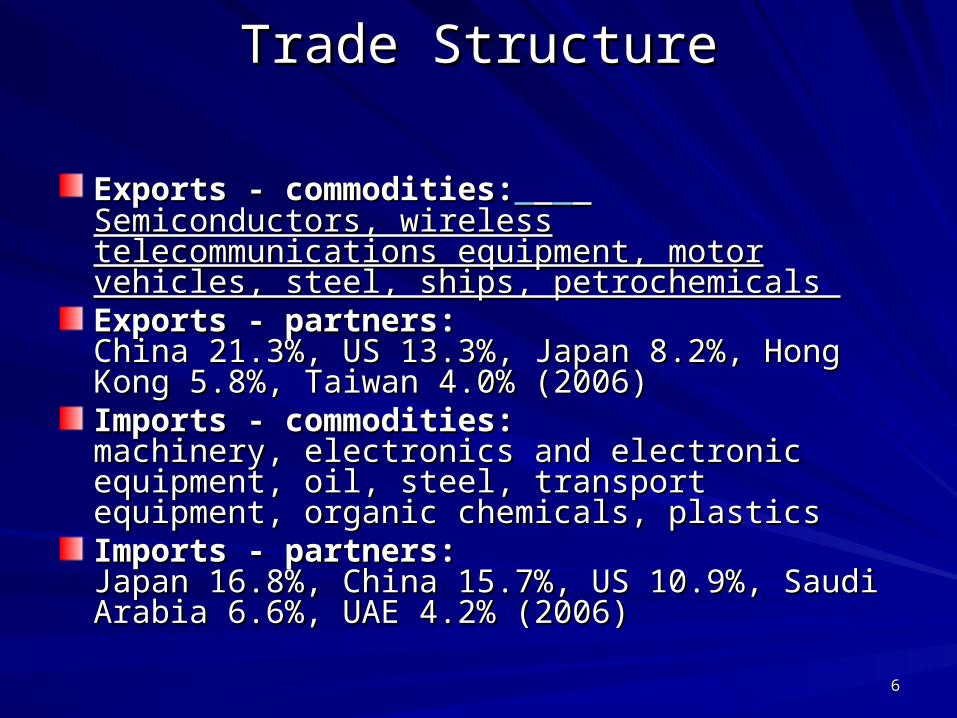
Trade StructureTrade Structure
Exports - commodities:Exports - commodities: Semiconductors, wireless telecommunications Semiconductors, wireless telecommunications equipment, motor vehicles, steel, ships, equipment, motor vehicles, steel, ships, petrochemicals petrochemicals Exports - partners:Exports - partners: China 21.3%, US 13.3%, Japan 8.2%, Hong Kong China 21.3%, US 13.3%, Japan 8.2%, Hong Kong 5.8%, Taiwan 4.0% (2006) 5.8%, Taiwan 4.0% (2006) Imports - commodities:Imports - commodities: machinery, electronics and electronic equipment, machinery, electronics and electronic equipment, oil, steel, transport equipment, organic chemicals, oil, steel, transport equipment, organic chemicals, plastics plastics Imports - partners:Imports - partners: Japan 16.8%, China 15.7%, US 10.9%, Saudi Japan 16.8%, China 15.7%, US 10.9%, Saudi Arabia 6.6%, UAE 4.2% (2006) Arabia 6.6%, UAE 4.2% (2006)

77
Composition of ExpendituresComposition of Expenditures
GDP in 2005 = 801 trillion won in current pricesGDP in 2005 = 801 trillion won in current prices
52
38
11
29
-30
53
30
14
43
-40
-60
-40
-20
0
20
40
60
C I G X M
%
1995 2005

88
Industrial Composition of Value AddedIndustrial Composition of Value Added
Agri Fish Min4%
Manufacturing29%
Elec Gas Water2%
Constuction9%
Trade Restau Hotel9%
Transport Storage Com7%
Finace Insu Real Estate Business
22%
Edu Health Social9%
Public Military6%
Other Svcs3%
Services57%

99
Fifteen Growth Miracles, 1960-2000Fifteen Growth Miracles, 1960-2000
Durlauf, S., Johnson, P., and Temple, J. (2005Durlauf, S., Johnson, P., and Temple, J. (2005 ))

1010
Fifteen Growth Disasters, 1960-2000Fifteen Growth Disasters, 1960-2000
Durlauf, S., Johnson, P., and Temple, J. (2005Durlauf, S., Johnson, P., and Temple, J. (2005 ))
1111
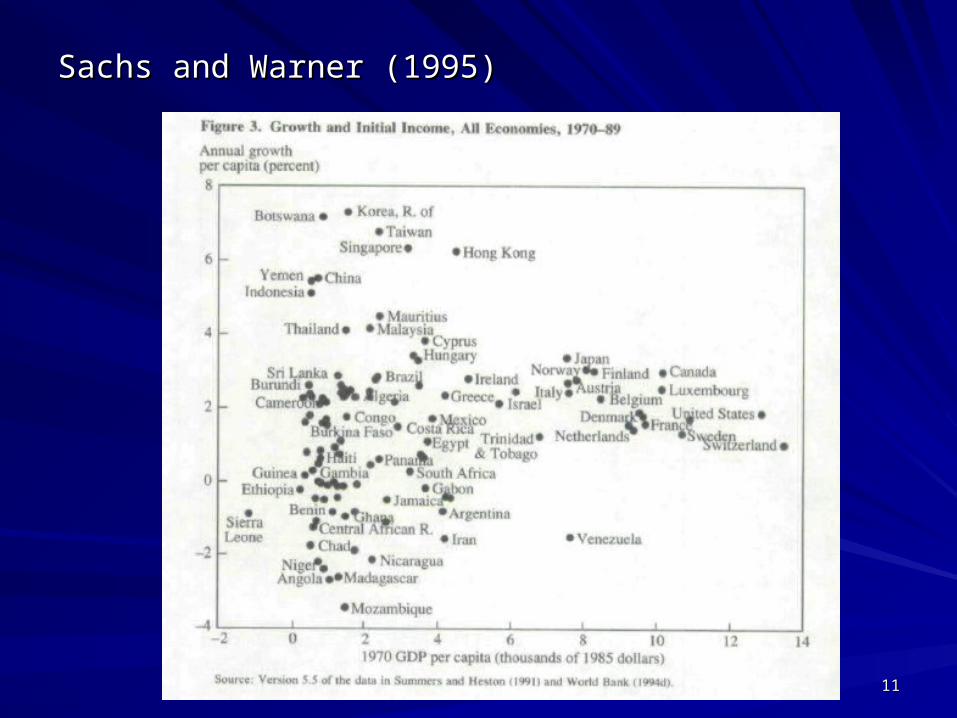
Sachs and Warner (1995)Sachs and Warner (1995)

1212
* Law of 70* Law of 70
A variable increases at the annual rate of x% .A variable increases at the annual rate of x% .How many years before it will double?How many years before it will double?
Ans. 70/xAns. 70/x
Korea 7% per annumKorea 7% per annumYear 1960 1970Year 1960 1970 19801980 1990 1990 Income 1000 2000Income 1000 2000 40004000 8000 8000
India 2% per annumIndia 2% per annumYear 1960Year 1960 1970 1970 19801980 1990 19951990 1995Income 1000Income 1000 2000 2000