1-how does the mind handle uncertainty in ambiguous figures · david publishing d . ... 1981;...
TRANSCRIPT

Psychology Research, January 2016, Vol. 6, No. 1, 1-13 doi:10.17265/2159-5542/2016.01.001
How Does the Mind Handle Uncertainty in
Ambiguous Figures? *
Manuel Moreno-Sanchez
University of Barcelona,
Barcelona, Spain
J. Antonio Aznar-Casanova
Institute for Brain, Cognition &
Behavior (IR3C), University of
Barcelona, Barcelona, Spain
Nelson Torro-Alves
Federal University of Paraíba,
Paraíba, Brazil
How does the mind select one interpretation from a bistable stimulus and how this eventually becomes conscious?
We briefly presented 17 rotations of an ambiguous figure to observers and asked them to give a quick response. We
were interested in determining how observer factors, stimulus properties and context influence the selected response.
Data analysis revealed that observers assigned probabilistically each figure rotation to a category according to an
implicit criterion of typicality or prototype. From discriminant analyses we ascertain how the standardized
coefficients change as do the testing conditions, mainly when stimulus information is lacking or confusing. Results
suggest that the proximity to the prototype expresses the uncertainty of the subject’s response and may be gradually
manipulated by the orientation of the figure. Depending on the uncertainty value, discriminant strength of the observer
and contextual factors have greater influence on responses than the physical properties of the ambiguous stimulus.
Keywords: bistable visual perception, ambiguous figures, uncertainty and information, categorization, visual
awareness
Introduction
Ambiguous figures have attracted the interest of the scientific community because they can be used to
investigate potential dissociations between stimulus-driven (sensory) and conceptually-driven (cognitive)
processes on a neural basis (Kornmeier & Bach, 2004, 2012; Leopold & Logothetis, 1999; Zeki, 2004). When
observers fixate on bistable ambiguous figures, perceptual alternations can take place, meaning that either one
or the other interpretation is selected by visual awareness (Attneave, 1971; Kornmeier & Bach, 2012; Long &
Toppino, 2004, for a review). In the four ambiguous figures shown in Figure 1, perceptual bistability implies
giving a specific meaning to a particular feature. Thus, as pointed by early research (e.g., Flügel, 1913; Boring,
1942), the perceived interpretation of the figure depends on the set of features receiving primary processing
(the focal-feature hypothesis). In this vein, a great deal of experimental work has demonstrated that eye
movements, such as saccades (Ellis & Stark, 1978; García-Pérez, 1989), are related to perceptual switching.
However, there is also strong evidence to suggest that eye movements are not required for figure reversal (Gale
*Acknowledgements: This work was funded through a grant awarded by the Spanish Ministry of Economy and Competitiveness (MINECO) to J. A. Aznar-Casanova (reference PSI2012-35194).
Manuel Moreno-Sanchez, MSSc., Department of Basic Psychology, University of Barcelona. J. Antonio Aznar-Casanova, Ph.D., Institute for Brain, Cognition & Behavior (IR3C), University of Barcelona. Nelson Torro-Alves, Ph.D., Department of Psychology, Federal University of Paraíba.
DAVID PUBLISHING
D

HOW DOES THE MIND HANDLE UNCERTAINTY IN AMBIGUOUS FIGURES?
2
& Findlay, 1983; Gregory, 1970), but rather that the direction of attention is the critical factor (Posner, 1980;
Tsal, 1994). Central cortical structures have long been invoked (e.g., Hering or Helmholtz) to explain
perceptual reversal. Ambiguous figures demonstrate the role of expectations, world-knowledge and the
direction of attention (see Long & Toppino, 2004) in relation to the perceptual interpretation of the stimulus.
One of the basic assumptions in research on perceptual switching with bistable figures is that the two
perceptual states underlying a particular conscious interpretation must be based on the internal neural activity in
the brain (Kornmeier & Bach, 2012). This activity can be either endogenously or exogenously induced.
However, the question that remains to be answered is how the observer decides upon the selected response.
Ascertaining the weight of certain factors that determine some sort of interpretation in bistable figures and
identifying the conditions under which they may occur could help to understand how the interplay between
physical properties and mental states leads to visual awareness.
Psychophysical and physiological evidence from the neural channel selectively tuned to certain properties
(e.g., spatial frequency or orientation) has been used in an attempt to explain phenomenal reversal with
ambiguous figures in terms of satiation or fatigue of low-level mechanisms, in other words, as the result of
neural adaptation (Babich & Standing, 1981; Blakemore & Campbell, 1969; De Valois, 1977; Hochberg, 1950;
Maffei, Fiorentini, & Bisti, 1973). However, if the ambiguous figure is presented briefly, neither adaptation nor
satiation processes can be prevented. Whatever the case, this passive bottom-up “neural-channel” model has
been criticized by researchers (Bruner & Leigh, 1955; Bugelski & Alampay, 1961; Rock, Hall, & Davis, 1994;
Toppino, 2003) in favour of another explanation based on more active, top-down or cognitive processes (e.g.,
learning, decision making, attention, familiarity or knowledge, expectations, etc.).
To summarize, previous studies (Bugelski & Alampay, 1961; Goolkasian, 1987; Rock & Mitchener, 1992)
have identified several factors that affect the observer’s response to ambiguous figures. These factors can be
classified into three groups: (1) observer-related factors, such as previous experience, the criterion of responses
in tests, ability to discriminate properties, etc.; (2) stimulus-related factors, such as size (i.e., spatial frequencies
selected by filtering the image), complexity, the orientation of the figure, etc. or viewing conditions; and (3) the
context in which the stimuli are inserted or the attitudes (expectations) of the observer induced by a set of
instructions capable of changing his or her mind. What is unclear is how much each factor contributes to the
observer’s response and how these factors interact with one another. Do these factors explain how the
interpretation of an ambiguous figure is selected? In short, our focus of interest here is to understand how the
mind handles the uncertainty caused by ambiguous figures and how people respond to them.
Figure 1. Four well-known ambiguous figures used in previous studies. From left to right: (1) face or mouse; (2) seal or donkey; (3) duck/rabbit (Jastrow); (4) number/letter. (Boring)
In the present study, we designed a two-alternative forced choice (2AFC) experiment in which an
ambiguous picture (duck/rabbit) was shown rotated between 45° and 225° in steps of 11.25 degrees, with
participants being asked to make categorization judgments. We hypothesized that the orientation would either
facilitate or hinder the activation of a particular category. In the experiment, we manipulated the participants’

HOW DOES THE MIND HANDLE UNCERTAINTY IN AMBIGUOUS FIGURES?
3
response criterion by two set of instructions. Based on the results of this study we show that ambiguity
perception of the duck-rabbit ambiguous figure is a categorization process determined not solely by the
stimulus but also by mental observer’s activity. Thus, prior experience, criterion for responding, demands of the
task (instructions) and expectations can modify the rule used to categorize ambiguous pictures. The conditions
in which every of these factors have more impact on the observer performance is discussed.
Method
Participants
Participants were 60 students from the University of Barcelona (44 female, 16 male), ranging in age from
18 to 27 years. They all had normal or corrected-to-normal visual acuity and provided written informed consent.
The Declaration of Helsinki tenets of 1975 (as revised in October in 2008) were followed throughout the study,
which received clearance by the Ethics Committee of the University of Barcelona.
Stimuli
The stimulus was a version of the famous duck-rabbit picture generated from an anonymous copy. This
picture is an ambiguous (bistable) stimulus that was originally drawn by Joseph Jastrow (Jastrow, 1899; but see
algo Brugger, 1999). Seventeen rotations of the duck-rabbit picture were used in the test, with the orientation
ranging from 45° to 225° in steps of 11.25° (see Figure 2).
The figures subtended a 3.43º × 2.86º visual angle (height × width) on the participants’ retina. A circle (4.76º
in radius) surrounding the figure was added to facilitate rotations. The stimuli were achromatic (black and white)
at maximum contrast. Luminance of the background was 101.4 cd/m2 and figure luminance was 0.08 cd/m2.
Apparatus
The figures were presented on a 17-inch LCD screen with a spatial resolution of 1280 × 768 pixels and a
refresh rate of 70 Hz. The experiment was conducted in a room with four individual soundproofed small
compartments. Each compartment was equipped with a PC (Intel Core i7) and a colour monitor placed on a
shelf and a chair from which students could comfortably reach the keyboard and two single-button response
boxes, one for the left and one for the right hand. The E-Prime 2.0 software was used to control stimulus
presentation and to register the responses of the participants.
Figure 2. Seventeen rotations of the duck-rabbit ambiguous picture varying from 45° to 225°in steps of 11.25° (people tend to see a rabbit in 90° and a duck in 180° rotation).
HOW DOES THE MIND HANDLE UNCERTAINTY IN AMBIGUOUS FIGURES?
4
Procedure
The experiment involved a single session and participants were tested in groups of four, each student in
one compartment. Half of the participants performed the duck detection task (Group 1) and the others the rabbit
detection task (Group 2). At the beginning of the experiment, students read specific instructions on the screen
to become familiar with the task. They were informed that in the experiment, rabbits and ducks would appear
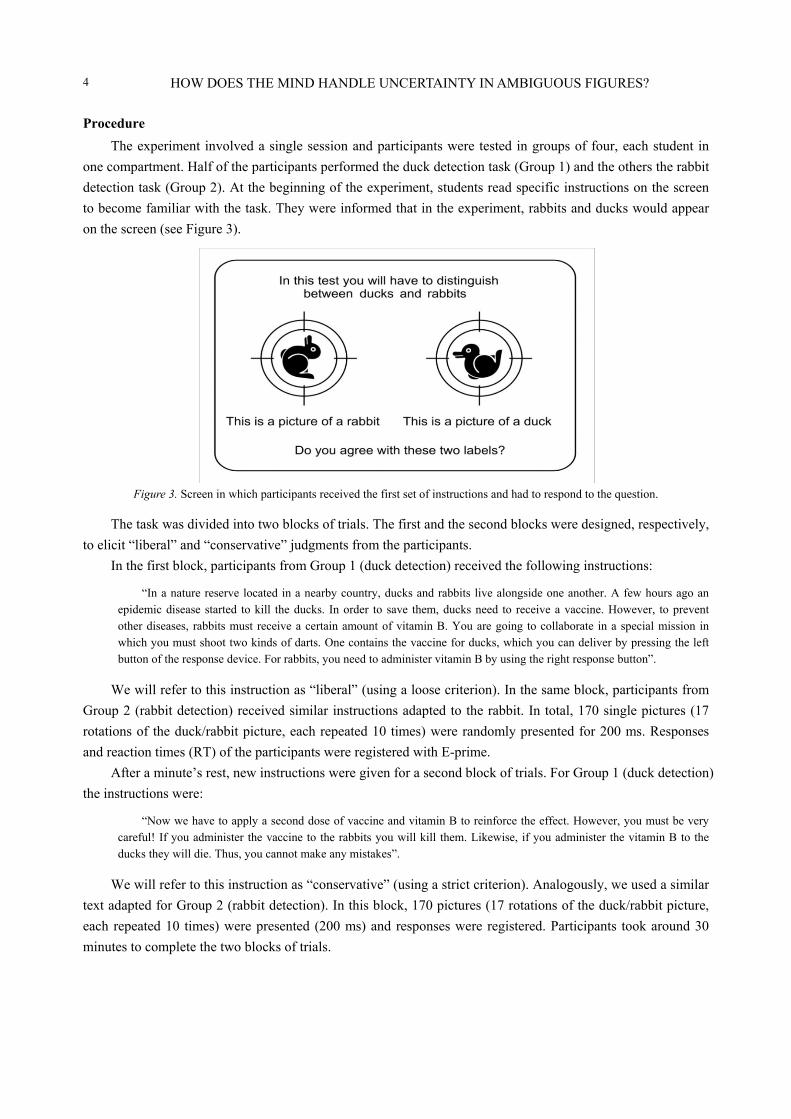
on the screen (see Figure 3).
Figure 3. Screen in which participants received the first set of instructions and had to respond to the question.
The task was divided into two blocks of trials. The first and the second blocks were designed, respectively,
to elicit “liberal” and “conservative” judgments from the participants.
In the first block, participants from Group 1 (duck detection) received the following instructions:
“In a nature reserve located in a nearby country, ducks and rabbits live alongside one another. A few hours ago an epidemic disease started to kill the ducks. In order to save them, ducks need to receive a vaccine. However, to prevent other diseases, rabbits must receive a certain amount of vitamin B. You are going to collaborate in a special mission in which you must shoot two kinds of darts. One contains the vaccine for ducks, which you can deliver by pressing the left button of the response device. For rabbits, you need to administer vitamin B by using the right response button”.
We will refer to this instruction as “liberal” (using a loose criterion). In the same block, participants from
Group 2 (rabbit detection) received similar instructions adapted to the rabbit. In total, 170 single pictures (17
rotations of the duck/rabbit picture, each repeated 10 times) were randomly presented for 200 ms. Responses
and reaction times (RT) of the participants were registered with E-prime.
After a minute’s rest, new instructions were given for a second block of trials. For Group 1 (duck detection)
the instructions were:
“Now we have to apply a second dose of vaccine and vitamin B to reinforce the effect. However, you must be very careful! If you administer the vaccine to the rabbits you will kill them. Likewise, if you administer the vitamin B to the ducks they will die. Thus, you cannot make any mistakes”.
We will refer to this instruction as “conservative” (using a strict criterion). Analogously, we used a similar
text adapted for Group 2 (rabbit detection). In this block, 170 pictures (17 rotations of the duck/rabbit picture,
each repeated 10 times) were presented (200 ms) and responses were registered. Participants took around 30
minutes to complete the two blocks of trials.

HOW DOES THE MIND HANDLE UNCERTAINTY IN AMBIGUOUS FIGURES?
5
Results
Descriptive Analysis of the Responses With Regard to Stimulus-Related Factors
We computed the proportions of duck and rabbit categorizations in the 17 rotations of each block (stated
by the instructions). Figure 4 shows the distribution of the proportions of target identifications for each criterion
and the order in which the latter were applied. These plots reveal that each interpretation of the figure (seen “as
a duck” or “as a rabbit”) has an associated probability that varies as a function of the orientation of the figure.
On the one hand, two prototypes can be clearly identified, one for each interpretation of the ambiguous figure
(rabbit or duck), and located at the peak maximum of these functions. On the other hand, each orientation of the
figure has a probability of assigning (or of perceiving) the oriented figure as one of the two interpretations.
Finally, the junction of the two distributions (one for each target figure) of the proportion of responses reveals
that the cut-off value separating them is located around 135º. Therefore, orientations near this value, the
confusion zone, delimitate where uncertainty is greater. The distribution of responses also reveals the
orientations in which the fuzzy boundaries of each prototype are located, namely 45º and 225º depending on the
stimuli. In short, according to these distributions of responses (Figure 4) at least three different zones in
uncertainty values can be defined: (1) around the prototypes (90º ± 11.25º and 180º ± 11.25º), (2) near the
extremes of the curves (45º + 11.25º and 225º - 11.25º), and (3) around the cut-off (135º ± 11.25º).
Figure 4. Distribution of the proportions of responses for each condition (set of instructions) of the ambiguous figure test as a function of the angle of rotation. Left panel: Loose-to-Strict criterion. Right panel: Strict-to-Loose criterion.
From these proportions of responses we examined the perceptual categories extending around the
prototype in the range of 90° ± 45° (i.e., between 45° and 135°), which were labelled as a “rabbit”, and around
180° ± 45° (i.e., between 135° and 225°), which were labelled as a “duck”. We adjusted the two sets of
proportions (duck and rabbit) to a Gaussian function and calculated two parameters of this model, namely the
PSE (which must be related to the acceptability and accuracy of the prototype) and S.D. or the slope of the
linearized function (which must be related to the sensitivity to discriminate).
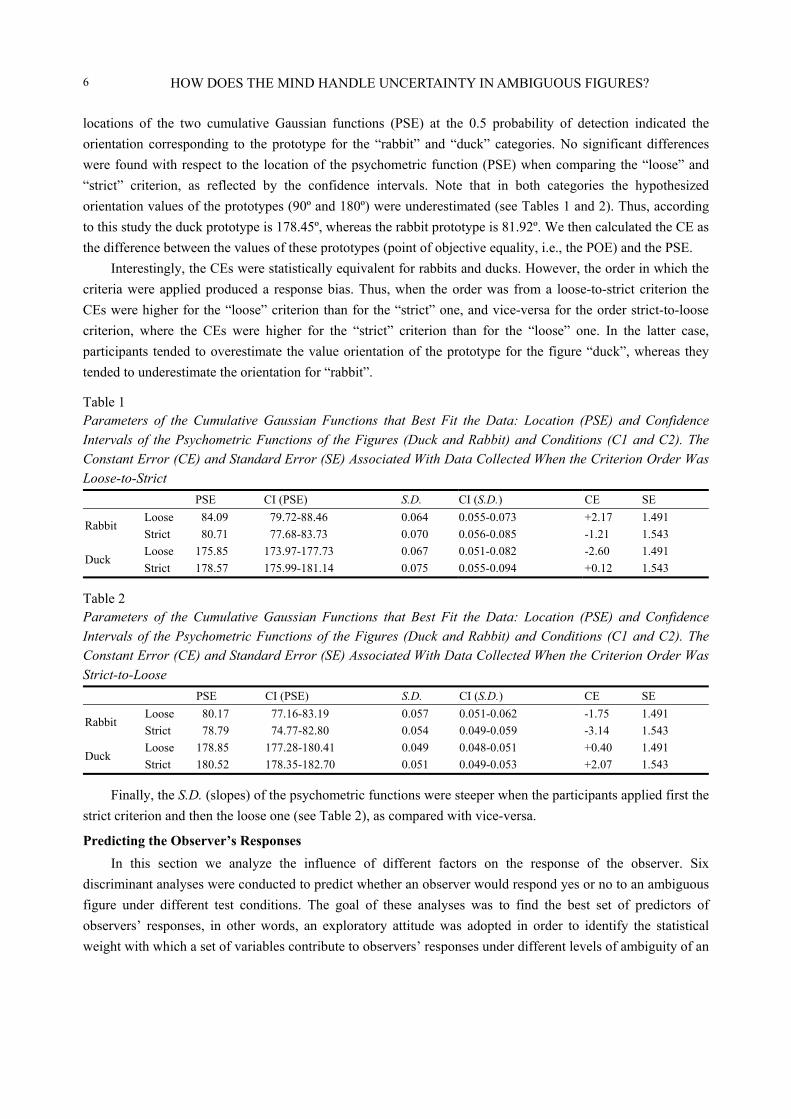
Tables 1 and 2 show the location (PSE) and S.D. of the four psychometric functions, as well as the
confidence intervals for the detection of ducks and rabbits in the two test conditions: “loose” or “strict”. The
HOW DOES THE MIND HANDLE UNCERTAINTY IN AMBIGUOUS FIGURES?
6
locations of the two cumulative Gaussian functions (PSE) at the 0.5 probability of detection indicated the
orientation corresponding to the prototype for the “rabbit” and “duck” categories. No significant differences
were found with respect to the location of the psychometric function (PSE) when comparing the “loose” and
“strict” criterion, as reflected by the confidence intervals. Note that in both categories the hypothesized
orientation values of the prototypes (90º and 180º) were underestimated (see Tables 1 and 2). Thus, according
to this study the duck prototype is 178.45º, whereas the rabbit prototype is 81.92º. We then calculated the CE as
the difference between the values of these prototypes (point of objective equality, i.e., the POE) and the PSE.
Interestingly, the CEs were statistically equivalent for rabbits and ducks. However, the order in which the
criteria were applied produced a response bias. Thus, when the order was from a loose-to-strict criterion the
CEs were higher for the “loose” criterion than for the “strict” one, and vice-versa for the order strict-to-loose
criterion, where the CEs were higher for the “strict” criterion than for the “loose” one. In the latter case,
participants tended to overestimate the value orientation of the prototype for the figure “duck”, whereas they
tended to underestimate the orientation for “rabbit”.
Table 1 Parameters of the Cumulative Gaussian Functions that Best Fit the Data: Location (PSE) and Confidence Intervals of the Psychometric Functions of the Figures (Duck and Rabbit) and Conditions (C1 and C2). The Constant Error (CE) and Standard Error (SE) Associated With Data Collected When the Criterion Order Was Loose-to-Strict
PSE CI (PSE) S.D. CI (S.D.) CE SE
Rabbit Loose 84.09 79.72-88.46 0.064 0.055-0.073 +2.17 1.491
Strict 80.71 77.68-83.73 0.070 0.056-0.085 -1.21 1.543
Duck Loose 175.85 173.97-177.73 0.067 0.051-0.082 -2.60 1.491
Strict 178.57 175.99-181.14 0.075 0.055-0.094 +0.12 1.543
Table 2 Parameters of the Cumulative Gaussian Functions that Best Fit the Data: Location (PSE) and Confidence Intervals of the Psychometric Functions of the Figures (Duck and Rabbit) and Conditions (C1 and C2). The Constant Error (CE) and Standard Error (SE) Associated With Data Collected When the Criterion Order Was Strict-to-Loose
PSE CI (PSE) S.D. CI (S.D.) CE SE
Rabbit Loose 80.17 77.16-83.19 0.057 0.051-0.062 -1.75 1.491
Strict 78.79 74.77-82.80 0.054 0.049-0.059 -3.14 1.543
Duck Loose 178.85 177.28-180.41 0.049 0.048-0.051 +0.40 1.491
Strict 180.52 178.35-182.70 0.051 0.049-0.053 +2.07 1.543
Finally, the S.D. (slopes) of the psychometric functions were steeper when the participants applied first the
strict criterion and then the loose one (see Table 2), as compared with vice-versa.
Predicting the Observer’s Responses
In this section we analyze the influence of different factors on the response of the observer. Six
discriminant analyses were conducted to predict whether an observer would respond yes or no to an ambiguous
figure under different test conditions. The goal of these analyses was to find the best set of predictors of
observers’ responses, in other words, an exploratory attitude was adopted in order to identify the statistical
weight with which a set of variables contribute to observers’ responses under different levels of ambiguity of an

HOW DOES THE MIND HANDLE UNCERTAINTY IN AMBIGUOUS FIGURES?
7
ambiguous figure. These predictor variables could be used subsequently to guide theoretical study of how the
mind handles uncertainty.
Note that the aim of this study was to determine the experimental test condition under which these factors
(observer-related, stimulus-related and context-related) were used by participants to achieve better
discrimination. Experimental conditions were defined by the target figure (duck or rabbit) and three groups of
orientations of the ambiguous figure in which the set of orientations show a good fit to a linear function. These
orientations were: (1) around the rabbit and duck prototypes (≈ 90º: 90º ± 11.25º and ≈ 180º: 180º ± 11.25º); (2)
around 45º(≈ 45: 45º+ 11.25º) and 225º(≈ 225: 225º- 11.25º); and (3) around 135º (≈ 135º: 135º ± 11.25º).
Note that uncertainty increases from the first to the last of these orientations. Predictor variables were the
“criterion” induced by the set of instructions (loose or strict), the “order” in which the instructions were given
(loose-strict or strict-loose), the “orientation” of the ambiguous stimulus, the response given to the preceding
trial (duck or rabbit) referred to as “prior response”, the slope of the linearized Gaussian function best fitting
the proportion of the observers’ responses, and “PSE”. Note, also, that the response given to the preceding trial
(“prior response”) constitutes previous experience and the set of instructions induces a “criterion” for
responding in the tests, in other words, these variables are observer-related factors. By contrast, the “orientation”
of the figure is a stimulus-related factor and the set of instructions (“criterion”) given to observers is a
contextual factor (mental set).
Table 3 Statistics of the Discriminant Analysis for all Examined Factors, According to the Different Experimental Test Conditions
Figure Orientations Box’s M (p-value) Eigen values Canonical correlation
Wilks’s λ and Prob.
Duck
≈ 90˚ & ≈ 180˚ 973.43; p < 0.001 0.466 0.564 0.682; p < 0.001
≈ 45˚ & ≈ 225˚ 506.01; p < 0.001 0.101 0.303 0.908; p < 0.001
≈ 135˚ 1620.93; p < 0.001 0.196 0.405 0.836; p < 0.001
Rabbit
≈ 90˚ & ≈ 180˚ 785.65; p < 0.001 0.962 0.700 0.510; p < 0.001
≈ 45˚ & ≈ 225˚ 157.74; p < 0.001 0.166 0.377 0.858; p < 0.001
≈ 135˚ 198.38; p < 0.001 0.209 0.416 0.827; p < 0.001
When the target figure was “duck”, Box’s M indicated that the assumption of equality of covariance
matrices was violated for all the predictors on the dependent variable. However, given the large sample this
problem was not regarded as serious. The discriminant function revealed a significant but low or moderate
association between responses and all predictors (see values of the canonical correlation and Wilks’ λ in Table
3). Interestingly, the largest value (0.564) corresponds to the set of orientations around the duck and rabbit
prototypes (≈ 90º or ≈ 180º), accounting for 32% of the between-group variability. Accordingly, the largest
Eigen value (0.466) was also observed for this set of orientations. However, closer analysis of the structure
matrix (see values in Table 4) revealed that the discriminant loading (strength) of the different predictors varied
with uncertainty, as defined by the set of orientations. Thus, for rotations around the prototype (i.e., 90º and
180º) the best discriminant factor was clearly the true orientation of the figure (0.966); smaller loadings were
obtained for the “S.D./slope” (-0.124) and the “prior response” (0.112), while “criterion”, “order of the criteria”
and PSE were poor predictors (see Figure 7 left). The cross-validated classification showed that overall 78.6%
of figures were correctly classified. For the set of orientations producing some uncertainty (i.e., ≈ 45º and ≈
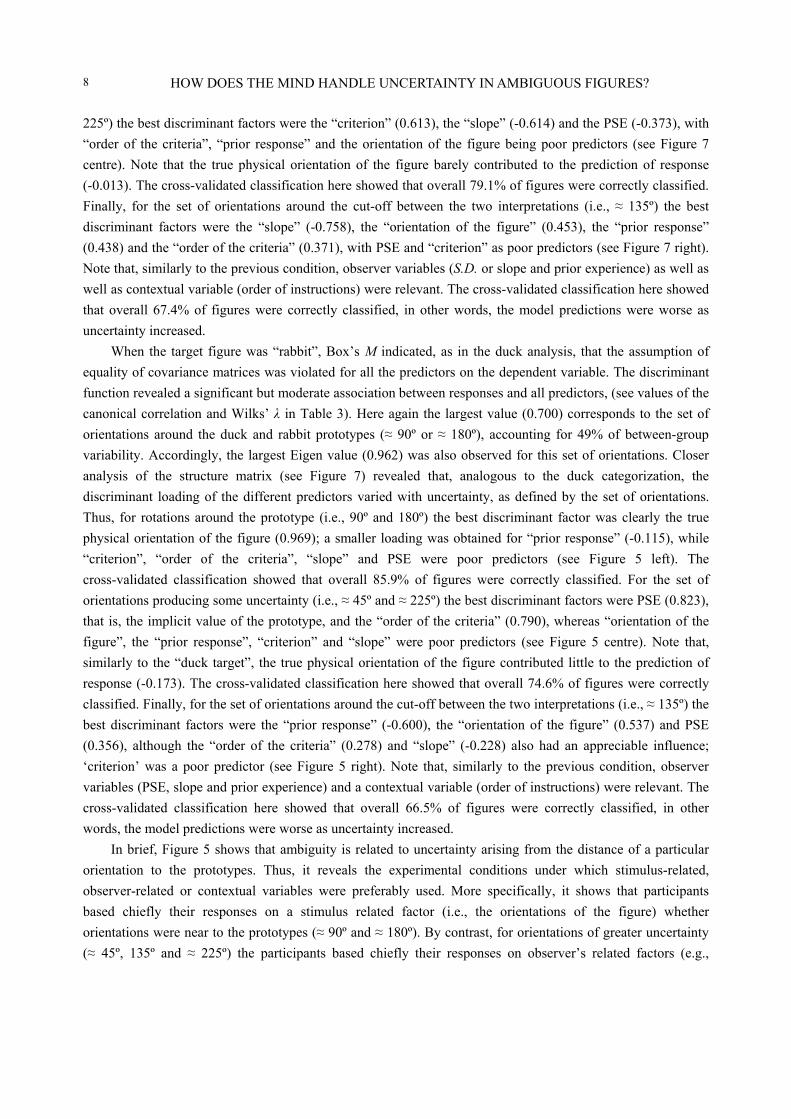
HOW DOES THE MIND HANDLE UNCERTAINTY IN AMBIGUOUS FIGURES?
8
225º) the best discriminant factors were the “criterion” (0.613), the “slope” (-0.614) and the PSE (-0.373), with
“order of the criteria”, “prior response” and the orientation of the figure being poor predictors (see Figure 7
centre). Note that the true physical orientation of the figure barely contributed to the prediction of response
(-0.013). The cross-validated classification here showed that overall 79.1% of figures were correctly classified.
Finally, for the set of orientations around the cut-off between the two interpretations (i.e., ≈ 135º) the best
discriminant factors were the “slope” (-0.758), the “orientation of the figure” (0.453), the “prior response”
(0.438) and the “order of the criteria” (0.371), with PSE and “criterion” as poor predictors (see Figure 7 right).
Note that, similarly to the previous condition, observer variables (S.D. or slope and prior experience) as well as
well as contextual variable (order of instructions) were relevant. The cross-validated classification here showed
that overall 67.4% of figures were correctly classified, in other words, the model predictions were worse as
uncertainty increased.
When the target figure was “rabbit”, Box’s M indicated, as in the duck analysis, that the assumption of
equality of covariance matrices was violated for all the predictors on the dependent variable. The discriminant
function revealed a significant but moderate association between responses and all predictors, (see values of the
canonical correlation and Wilks’ λ in Table 3). Here again the largest value (0.700) corresponds to the set of
orientations around the duck and rabbit prototypes (≈ 90º or ≈ 180º), accounting for 49% of between-group
variability. Accordingly, the largest Eigen value (0.962) was also observed for this set of orientations. Closer
analysis of the structure matrix (see Figure 7) revealed that, analogous to the duck categorization, the
discriminant loading of the different predictors varied with uncertainty, as defined by the set of orientations.
Thus, for rotations around the prototype (i.e., 90º and 180º) the best discriminant factor was clearly the true
physical orientation of the figure (0.969); a smaller loading was obtained for “prior response” (-0.115), while
“criterion”, “order of the criteria”, “slope” and PSE were poor predictors (see Figure 5 left). The
cross-validated classification showed that overall 85.9% of figures were correctly classified. For the set of
orientations producing some uncertainty (i.e., ≈ 45º and ≈ 225º) the best discriminant factors were PSE (0.823),
that is, the implicit value of the prototype, and the “order of the criteria” (0.790), whereas “orientation of the
figure”, the “prior response”, “criterion” and “slope” were poor predictors (see Figure 5 centre). Note that,
similarly to the “duck target”, the true physical orientation of the figure contributed little to the prediction of
response (-0.173). The cross-validated classification here showed that overall 74.6% of figures were correctly
classified. Finally, for the set of orientations around the cut-off between the two interpretations (i.e., ≈ 135º) the
best discriminant factors were the “prior response” (-0.600), the “orientation of the figure” (0.537) and PSE
(0.356), although the “order of the criteria” (0.278) and “slope” (-0.228) also had an appreciable influence;
‘criterion’ was a poor predictor (see Figure 5 right). Note that, similarly to the previous condition, observer
variables (PSE, slope and prior experience) and a contextual variable (order of instructions) were relevant. The
cross-validated classification here showed that overall 66.5% of figures were correctly classified, in other
words, the model predictions were worse as uncertainty increased.
In brief, Figure 5 shows that ambiguity is related to uncertainty arising from the distance of a particular
orientation to the prototypes. Thus, it reveals the experimental conditions under which stimulus-related,
observer-related or contextual variables were preferably used. More specifically, it shows that participants
based chiefly their responses on a stimulus related factor (i.e., the orientations of the figure) whether
orientations were near to the prototypes (≈ 90º and ≈ 180º). By contrast, for orientations of greater uncertainty
(≈ 45º, 135º and ≈ 225º) the participants based chiefly their responses on observer’s related factors (e.g.,

HOW DOES THE MIND HANDLE UNCERTAINTY IN AMBIGUOUS FIGURES?
9
precision, prior experience, etc.) or contextual factors (e.g., criterion of response induced by the instructions).
This analysis also reveals that there are notable differences between the two types of responses (duck or rabbit),
which are not equally likely.
Figure 5. Distribution of the discriminant loadings (structural coefficients) for the different predictors used in the discriminant analysis according to the target figure and the three set of orientations: around the prototypes (≈ 90º and 180º), orientations with high uncertainty (≈ 45º and ≈ 225º), and orientation around the cut-off between the two interpretations (≈ 135º).
Discussion
In this study, we sought to ascertain how the mind handles the uncertainty caused by ambiguous figures
and how people respond to them. In particular, we were interested in how observer-related, stimulus-related and
contextual factors contribute to the observer’s response, and in how these factors interact with one another.
Firstly, we evidenced that observers differentiated two categories, each one having a prototype linked to a
particular orientation.
Data analysis revealed that participants were significantly more accurate in their categorization judgments
when instructed to use a strict response criterion. However, this mainly occurred when they received ‘strict’
instructions first, rather than subsequent to “loose” instructions (i.e., an order effect was found).
The PSE of each psychometric function revealed that rotations corresponding to prototypes were
underestimated in all categories (duck and rabbit) and conditions (instructions). In addition, the analysis of
errors (constant error) showed that the two figures (duck and rabbit) were processed in a different way by
observers. The two interpretations (duck or rabbit) did not have the same probability distribution of the
response, having clear response biases. This response bias suggests that the direction of the bias may have to do
with the more probable orientation of the discriminant feature for each category. In other words the duck’s beak
is usually horizontally oriented, while the rabbit’s ears are usually vertically oriented (as suggested by the focal
feature hypothesis). Thus the prototype for rabbits was at 82.6° (in C1) and 80.3° (in C2), while that for ducks
was at 175.3° and 177.2° (C1 and C2, respectively).
These results show that changes in orientation elicit changes in perception (retranslation of the features).
In other words, the manipulation of a physical property (bottom-up processing) had some impact on the
decision rule or criterion (top-down processing). In conclusion, our data show a bi-directional interaction
between sensory- and cognitive-driven processes. This claim is in agreement with recent neuroimaging findings
suggesting that frontal and parietal brain regions are involved in perceptual switching (de Graaf, de Jong,
Goebel, van Ee, & Sack, 2011; Knapen, Brascamp, Pearson, Ee, & Blake, 2011; Windmann, Wehrmann,
HOW DOES THE MIND HANDLE UNCERTAINTY IN AMBIGUOUS FIGURES?
10
Calabrese, & Güntürkün, 2006). Our results also provide support for the notion that the parietal lobe is involved
in the processing of ambiguous figures. Physical rotation of figures (and also mental rotation, as shown by
Shepard & Metzler, 1971) does modify the orientation of features and can alter the interpretation of the figure.
Thus, this psychophysical approach presents evidence that is convergent with neuroscientific research showing
activity in the parietal lobe during the processing of oriented bistable stimuli (Britz, Landis, & Michel, 2009;
Kanai, Carmel, Bahrami, & Rees, 2011).
As for the cut-off values used to dichotomize (categorize) the continuum of rotations between 90º and
180º, results for the category “rabbit” showed that these values were similar (around 135°) in both conditions.
This is one of the more interesting values to study because it is the value at which an interpretation switches to
another. Therefore, factors responsible for this perceptual change could account for the perceptual alternation.
We examined this point not from a psychophysics approach but rather by using discriminant analysis.
How Stimulus Related, Observers and Context Factors Modulated Responses
Results from exploratory discriminant analysis of six conditions (the result of combining two target
figures and three set of orientations) help to clarify which variables contribute most to predicting the responses
of observers. Thus, the structural coefficients of the factors included in the model revealed the experimental
conditions under which stimulus-related, observer-related and contextual variables were preferably used.
Specifically, Tables 3 together with the box plot in Figure 5, show that the variability in participants’ responses
is small for orientations near to the prototypes (≈ 90 and ≈ 180). By contrast, variability was larger for
orientations with greater uncertainty associated (≈ 45º, 135º and ≈ 225º). This analysis also revealed that there
are notable differences between the two types of responses (duck or rabbit), as far as the discriminant loadings
are concerned.
The structural coefficients of the factors chiefly show how the discriminant loading of three kinds of
variables were related with stimulus, observer and context depending on the uncertainty value that is promoted
by the orientation. More specifically, we found that the observers’ responses differed depending on the
orientation of the ambiguous figure, varying from a minimum value (with low uncertainty) close to the
prototypes to a maximum one (with high uncertainty) in those orientations more distant from the prototypes
(i.e., ≈ 45º and ≈ 225º). Thus, in this study, ambiguity can be characterized by uncertainty measured by the
proportion of observers’ responses to the ambiguous figure, as reflected in Figure 4, locating the tails of each
distribution of responses in these orientations (45º and 225º). Note that in previous studies the typical
presentation of the duck/rabbit ambiguous figure has been 135º, precisely the location of the cut-off between
the two interpretations (categories), overriding unwittingly those orientations in which uncertainty is middle or
minimal. Furthermore, three different response biases were observed for different orientations with high
uncertainty. Thus, the 45º and 135º orientations of the figure seem to promote a bias towards the response
“rabbit”, whereas the 225º orientation seems to induce a bias in observers toward the response “duck”.
How Prior Experience Affected the Responses
The exploratory discriminant analysis also revealed some influence of the previous response (or prior
experience). Particularly, this factor had a determinant role in those cases where the figure achieved greater
uncertainty (≈ 45º, 135º and ≈ 225º). Note that it is in these orientations where the typical features of the
species (e.g., the duck’s beak or the rabbit’s ear) were not in the canonical orientation corresponding to any of
the prototype, when in order to respond to the current trial, the response to the figure presented in the previous

HOW DOES THE MIND HANDLE UNCERTAINTY IN AMBIGUOUS FIGURES?
11
trial reached a high discriminant loading. Other studies (Bugelski & Alampay, 1961; Goolkasian, 1987) have
presented observers with an unambiguous version of an ambiguous figure (e.g., the old woman/young woman)
and later showed the observers the ambiguous form. Results revealed that the most observers who have
previously seen the unambiguous picture, for instance “as an old woman”, see the ambiguous figure in the same
way. Bugelski and Alampay (1961) conducted an experiment with the rat/man ambiguous figure, and showed
one group of observers a set of animal pictures that did not include a rat. This top-down information had a
powerful impact, since the number of observers who saw the ambiguous figure as a rat increased by as much as
80% in some experimental conditions. Leeper (1935) conducted a similar experiment but provided the
top-down information in verbal form. He found that the group who heard a passage about rats before seeing the
rat/man figure saw the picture as a rat twice as often as did the control group. However, there is also strong
evidence for contextual influences on the perception of ambiguous figures (e.g., Goolkasian, 1987). Thus, it has
been reported that children tested with Jastrow’s duck/rabbit figure on Easter Sunday are more likely to see the
figure as a rabbit, whereas if they are tested on a Sunday in October they tend to see it as a duck or similar bird
(Brugger & Brugger, 1993). In addition, it is known that briefly presenting an unambiguous version of a
bistable figure prior to presenting the corresponding ambiguous figure can produce priming effects. In this
regard, our results are consistent with the findings of Long et al. (1992), who showed the effects of short, prior
presentations of an unambiguous version of an ambiguous figure (previous experience or perceptual learning)
on the response of observers.
How Instructions Influence the Response’s Criterion
With regard to the predictive power of the criterion induced by the set of instructions the structural
coefficients of the exploratory discriminant analysis revealed that this factor only has a high discriminant
loading in the set of orientations far from the prototype (≈ 45º and ≈ 225º), or in the orientation located around
the cut-off between the two interpretations (135º). By contrast, this factor had barely any influence on observers’
responses when the orientation showed a good fit to the corresponding prototype (90º or 180º). This result is in
agreement with the Parasuraman (1986) thesis that any difference in the pattern of responses between “loose” and
“strict” might be interpreted as evidence of higher-level influences on the categorization of ambiguous pictures.
Conclusion
From the results of this study we conclude that ambiguity perception of the duck-rabbit ambiguous figure
is a categorization process that is not determined simply by the stimulus and its context but also by mental
activity, i.e., we see with the mind as well as with our eyes. In sort, to solve an ambiguous figure is equivalent
to decipher a message having implicit information, which is guided by a mental model: the prototype. To this
goal the brain must create something like a cognitive equation in which a variety of information from different
sources (stimuli, observer, context, etc.) should be integrated. Our study reveals how the coefficients of such an
equation change as do the texting conditions.
References Attneave, F. (1971). Multistability in perception. Scientific American, 225(6), 62-71.
http://doi.org/10.1038/scientificamerican1271-62 Babich, S., & Standing, L. (1981). Satiation effects with reversible figures. Perceptual and Motor Skills, 52(1), 203-210.
http://doi.org/10.2466/pms.1981.52.1.203
HOW DOES THE MIND HANDLE UNCERTAINTY IN AMBIGUOUS FIGURES?
12
Blakemore, C., & Campbell, F. W. (1969). On the existence of neurones in the human visual system selectively sensitive to the orientation and size of retinal images. The Journal of Physiology, 203(1), 237–260.1.
Britz, J., Landis, T., & Michel, C. M. (2009). Right parietal brain activity precedes perceptual alternation of bistable stimuli. Cerebral Cortex, 19(1), 55-65. http://doi.org/10.1093/cercor/bhn056
Brugger, P. (1999). One hundred years of an ambiguous figure: Happy birthday, duck/rabbit. Perceptual and Motor Skills, 89(3 Pt 1), 973-977. http://doi.org/10.2466/pms.1999.89.3.973
Brugger, P., & Brugger, S. (1993). The Easter bunny in October: Is it disguised as a duck? Perceptual and Motor Skills, 76(2), 577-578. http://doi.org/10.2466/pms.1993.76.2.577
Bruner, J. S., & Leigh, A. (1955). Perceptual identification and perceptual organization. Journal of General Psychology, 53, 21-28. http://doi.org/10.1080/00221309.1955.9710133
Boring, E. G. (1942). Sensation and perception in the history of experimental psychology. New York: Appleton Century. Bugelski, B. R., & Alampay, D. A. (1961). The role of frequency in developing perceptual sets. Canadian Journal of Psychology,
15, 205-211. De Graaf, T. A., de Jong, M. C., Goebel, R., van Ee, R., & Sack, A. T. (2011). On the functional relevance of frontal cortex for
passive and voluntarily controlled bistable vision. Cerebral Cortex, 21(10), 2322-2331. http://doi.org/10.1093/cercor/bhr015 De Valois, K. K. (1977). Spatial frequency adaptation can enhance contrast sensitivity. Vision Research, 17(9), 1057-1065. Ellis, S. R., & Stark, L. (1978). Eye movements during the viewing of Necker cubes. Perception, 7(5), 575-581. Flügel, J. C. (1913). The influence of attention in illusions of reversible perspective. British Journal of Psychology, 1904-1920,
5(4), 357-397. http://doi.org/10.1111/j.2044-8295.1913.tb00070.x Gale, A. G., & Findlay, J. M. (1983). Eye movement patterns in viewing ambiguous figures. Eye movements and psychological
functions: International views, 145-168. García-Pérez, M. A. (1989). Visual inhomogeneity and eye movements in multistable perception. Perception & Psychophysics,
46(4), 397-400. http://doi.org/10.3758/BF03204995 Goolkasian, P. (1987). Ambiguous figures: Role of context and critical features. The Journal of General Psychology, 114(3),
217-228. Goolkasian, P., & Woodberry, C. (2010). Priming effects with ambiguous figures. Attention, Perception, & Psychophysics, 72(1),
168-178. http://doi.org/10.3758/APP.72.1.168 Gregory, R. L. (1970). The intelligent eye. New York: McGraw-Hill. Hochberg, J. E. (1950). Figure-ground reversal as a function of visual satiation. Journal of Experimental Psychology, 40(5), 682. Jastrow, J. (1899). The mind’s eye. Popular Science Monthly, 299-312. Kanai, R., Carmel, D., Bahrami, B., & Rees, G. (2011). Structural and functional fractionation of right superior parietal cortex in
bistable perception. Current Biology, 21(3), R106-R107. http://doi.org/10.1016/j.cub.2010.12.009 Knapen, T., Brascamp, J., Pearson, J., Ee, R. van, & Blake, R. (2011). The role of frontal and parietal brain areas in bistable
perception. The Journal of Neuroscience, 31(28), 10293-10301. http://doi.org/10.1523/JNEUROSCI.1727-11.2011 Kornmeier, J., & Bach, M. (2004). Early neural activity in Necker-cube reversal: Evidence for low-level processing of a gestalt
phenomenon. Psychophysiology, 41(1), 1-8. http://doi.org/10.1046/j.1469-8986.2003.00126.x Kornmeier, J., & Bach, M. (2012). Ambiguous figures—What happens in the brain when perception changes but not the stimulus.
Frontiers in Human Neuroscience, 6, 51. http://doi.org/10.3389/fnhum.2012.00051 Leeper, R. (1935). A study of a neglected portion of the field of learning—The development of sensory organization. The
Pedagogical Seminary and Journal of Genetic Psychology, 46(1), 41-75. http://doi.org/10.1080/08856559.1935.10533144 Leopold, D. A., & Logothetis, N. K. (1999). Multistable phenomena: Changing views in perception. Trends in Cognitive Sciences,
3(7), 254-264. Long, G. M., & Toppino, T. C. (2004). Enduring interest in perceptual ambiguity: Alternating views of reversible figures.
Psychological Bulletin, 130(5), 748-768. http://doi.org/10.1037/0033-2909.130.5.748 Long, G. M., Toppino, T. C., & Mondin, G. W. (1992). Prime time: Fatigue and set effects in the perception of reversible figures.
Perception & Psychophysics, 52(6), 609-616. http://doi.org/10.3758/BF03211697 Maffei, L., Fiorentini, A., & Bisti, S. (1973). Neural correlate of perceptual adaptation to gratings. Science (New York, N.Y.),
182(4116), 1036-1038. Mathes, B., Strüber, D., Stadler, M. A., & Basar-Eroglu, C. (2006). Voluntary control of Necker cube reversals modulates
the EEG delta- and gamma-band response. Neuroscience Letters, 402(1-2), 145-149. http://doi.org/10.1016/j.neulet.2006.03.063

HOW DOES THE MIND HANDLE UNCERTAINTY IN AMBIGUOUS FIGURES?
13
Parasuraman, R. (1986). Vigilance, monitoring, and search. In K. R. Boff, L. Kaufman, & J. P. Thomas (Orgs.), Handbook of perception and human performance, Vol. 2: Cognitive processes and performance (pp. 1-39). Oxford, England: John Wiley & Sons.
Posner, M. I. (1980). Orienting of attention. The Quarterly Journal of Experimental Psychology, 32(1), 3-25. Rock, I., Hall, S., & Davis, J. (1994). Why do ambiguous figures reverse? Acta Psychologica, 87(1), 33-59. Rock, I., & Mitchener, K. (1992). Further evidence of failure of reversal of ambiguous figures by uninformed subjects. Perception,
21(1), 39-45. Shepard, R. N., & Metzler, J. (1971). Mental rotation of three-dimensional objects. Science (New York, N.Y.), 171(3972),
701-703. Toppino, T. C. (2003). Reversible-figure perception: Mechanisms of intentional control. Perception & Psychophysics, 65(8),
1285-1295. Toppino, T. C., & Long, G. M. (2005). Top-down and bottom-up processes in the perception of reversible figures: Toward a
hybrid model. In N. Ohta, C. M. MacLeod, & B. Uttl (Orgs.), Dynamic Cognitive Processes (pp. 37-58). Springer Tokyo. Tsal, Y. (1994). Effects of attention on perception of features and figural organisation. Perception, 23(4), 441-452. Windmann, S., Wehrmann, M., Calabrese, P., & Güntürkün, O. (2006). Role of the prefrontal cortex in attentional control over
bistable vision. Journal of Cognitive Neuroscience, 18(3), 456-471. http://doi.org/10.1162/089892906775990570 Zeki, S. (2004). The neurology of ambiguity. Consciousness and Cognition, 13(1), 173-196.
http://doi.org/10.1016/j.concog.2003.10.003