1 high-throughput manufacturing of size-tuned … · 13 medicines research unit ... 90 favorably...
TRANSCRIPT
Title: High-throughput manufacturing of size-tuned liposomes by a new microfluidics method using 1
enhanced statistical tools for characterization. 2
Authors: Elisabeth Kastner#, Randip Kaur#, Deborah Lowry, Behfar Moghaddam, Alexander Wilkinson, 3
Yvonne Perrie* 4
5
Medicines Research Unit, School of Life and Health Sciences, Aston University, Birmingham, UK, B4 7ET. 6
#These authors contributed equally to this work. 7
8
9
10
11
*Correspondence: Professor Yvonne Perrie 12
Medicines Research Unit 13
School of Life and Health Sciences 14
Aston University, Birmingham, UK. B4 7ET. 15
Tel: +44 (0) 121 204 3991 16
Fax: +44 (0) 121 359 0733 17
E-mail: [email protected] 18
19
20
Keywords: Liposomes, microfluidics, Design of Experiment, high-throughput manufacturing, DNA delivery 21
22
23
24

2
Abstract 25
Microfluidics has recently emerged as a new method of manufacturing liposomes, which allows for 26
reproducible mixing in miliseconds on the nanoliter scale. Here we investigate microfluidics-based 27
manufacturing of liposomes. The aim of these studies was to assess the parameters in a microfluidic 28
process by varying the total flow rate (TFR) and the flow rate ratio (FRR) of the solvent and aqueous phases. 29
Design of Experiment and multivariate data analysis were used for increased process understanding and 30
development of predictive and correlative models. High FRR lead to the bottom-up synthesis of liposomes, 31
with a strong correlation with vesicle size, demonstrating the ability to in-process control liposomes size; 32
the resulting liposome size correlated with the FRR in the microfluidics process, with liposomes of 50 nm 33
being reproducibly manufactured. Furthermore, we demonstrate the potential of a high throughput 34
manufacturing of liposomes using microfluidics with a four-fold increase in the volumetric flow rate, 35
maintaining liposome characteristics. The efficacy of these liposomes was demonstrated in transfection 36
studies and was modelled using predictive modelling. Mathematical modelling identified FRR as the key 37
variable in the microfluidic process, with the highest impact on liposome size, polydispersity and transfection 38
efficiency. This study demonstrates microfluidics as a robust and high-throughput method for the scalable 39
and highly reproducible manufacture of size-controlled liposomes. Furthermore, the application of 40
statistically based process control increases understanding and allows for the generation of a design-space 41
for controlled particle characteristics. 42

3
1.Introduction 43
Liposomes are well established as delivery systems and immunological adjuvants and there are a wide 44
range of methods employed in their production. For example, multilamellar vesicles (MLV) can be formed 45
by the dispersion of a dried lipid film and small unilamellar vesicles (SUV) can then be produced by 46
sonication (Lapinski et al., 2007; Maulucci et al., 2005), extrusion (de Paula Rigoletto et al., 2012; Olson et 47
al., 1979), or high-pressure homogenization (Barnadas-Rodriguez and Sabes, 2001; Pupo et al., 2005). 48
However, sonication may lead to sample contamination by metallic residues from the probe tip, lipid 49
degradation and lack of scalability (Wagner and Vorauer-Uhl, 2011). Homogenization techniques, shear or 50
pressure induced size reduction, circumvent protein or lipid degradation and are frequently used to reduce 51
the size and lamellarity of MLV (Wagner and Vorauer-Uhl, 2011). Maintenance of constant temperatures 52
throughout these processes can be difficult, with restrictions to relatively small working volumes and 53
quantities; however, continuous and heat controlled homogenization techniques have been developed to 54
help overcome some of these problems (Riaz, 1996; Wagner and Vorauer-Uhl, 2011). 55
56
As an alternative to these methods, microfluidics is a relatively new area of liposome synthesis, where the 57
small dimensions in a micromixer allow for fast mixing, dominated by diffusion or convection (Whitesides, 58
2006). Microfluidics refers to fluid handling methods in a controlled volume, typically below millimeter 59
scales, which allows for implementation of the mixing process into planar chips (Squires and Quake, 2005). 60
The application of microfluidics for liposome synthesis in novel lab-on-a-chip based devices dramatically 61
reduces time for sample preparation as well as costs associated with experimental work and may 62
additionally be fully software controlled to aid process robustness and reproducibility (van Swaay, 2013). 63
Various micromixers have been designed and applied for the manufacturing of liposomes based on different 64
channel layouts (Pradhan et al., 2008) including flow focusing (Davies et al., 2012; Jahn et al., 2004), 65
droplet based (Teh et al., 2008), and T- or Y- shaped mixers (Kurakazu and Takeuchi, 2010). In this study, 66
a staggered herringbone micromixer (SHM) (Stroock et al., 2002) which induces chaotic advection, is used. 67
The chaotic advection mixing profile allows for stretching and folding of fluid streams over the channels 68
cross-sectional area, increasing mass transfer together with the herringbone type structures on the channel 69
floor (Stroock et al., 2002). Here, a SHM was used together with the automated mixing platform 70
NanoAssemblr™ (Precision NanoSystems, Inc.). This system enables rapid, reproducible and scalable 71
manufacture of homogeneous next-generation nanoparticles and liposomes (Belliveau et al., 2012; 72
Zhigaltsev et al., 2012). Lipid dissolved in solvent is pumped into one inlet and aqueous buffer into the other 73
inlet of the microfluidic mixing cartridge (Figure 1). It has been suggested that a nanoprecipitation reaction 74
results in the formation of nanoparticles (Karnik et al., 2008; Zhigaltsev et al., 2012). This reaction takes 75
place at the interface of the solvent and aqueous streams. Liposome formation is based on polarity 76
alterations throughout the chamber and an increase in the surface area of the fluid interface occurs, as the 77
fluids are folded over on top of each other aided by the channel design and grooves on the channel floor 78
(Figure 1, small). The rate of polarity increase and the subsequent following the formation of liposomes is 79

4
user-controlled by alterations in flow rates of the separate streams as well the ratios of aqueous to solvent 80
stream as demonstrated for liposomes (Bally et al., 2012; Zhigaltsev et al., 2012) and polymeric 81
nanoparticles (Bally et al., 2012). Furthermore, the option of parallelization of the mixing cartridges allows 82
for scalability as a high throughput method (Belliveau et al., 2012). 83
84
The development and optimization of new processes and methods can be a time consuming task, 85
especially when applying the traditional one-factor-at-a-time (OFAT) method, where only one factor is 86
optimized while all other factors remain constant. Adopting this approach may also result in the optimum 87
process or formulation being overlooked as well as possible factor-interactions (Montgomery et al., 1997). 88
An alternative approach is to adopt Design of Experiments (DoE), a statistical optimization method, 89
favorably used in pharmaceutical and biopharmaceutical process development and optimization 90
(Lawrence, 2008; Singh et al., 2011; Vandervoort and Ludwig, 2002). DoE is a systematic approach of 91
creating structured experiments, measuring or detecting the effect of changes to a pre-defined response. 92
Product quality, as well as process understanding is maximized with a minimal number of experiments 93
performed. In DoE, the factors are defined as the variables in a process and selected responses define the 94
properties of the system that is investigated. Factors are the tools used for manipulation of the system, 95
which following influence the responses. The aim is to connect the variation in the factors to the resulting 96
responses, and link the information using a mathematical model. DoE does not only investigate statistical 97
significant factors involved in a process (main effects), it also identifies interactions between factors and 98
respective influence on the desired output variable (Eriksson, 2008; Mandenius and Brundin, 2008). A 99
second statistical tool, multivariate data analysis (MVDA), allows for the analysis of more than one statistical 100
variable at a time by reducing dimensionality in a data set by its transformation (Wold et al., 2001a; Wold 101
et al., 2001b). MVDA is used for identifying patterns and relationships between several variables 102
simultaneously (Eriksson, 2006). It predicts the effect of changing one variable to other variables and is 103
applied for data analysis, data mining, classification (e.g. cluster analysis or outlier detection), regression 104
analysis and predictive modeling, frequently used in pharmaceutical and biopharmaceutical processes 105
(Eriksson, 2006; Pasqualoto et al., 2007; Rathore et al., 2011). Both tools, DoE and MVDA, are statistical-106
based, process understanding and optimization tools that build and describe knowledge around a specific 107
application, which ultimately supports the development of confidence and enhanced understanding, as well 108
as robustness of a process. 109
This present study first investigated microfluidics as a new method for manufacturing of cationic liposomes 110
using the NanoAssemblr™. To achieve this 1,2-dioleoyl-sn-glycero-3-phosphoethanolamine (DOPE) and 111
1,2-dioleoyl-3-trimethylammonium-propane (DOTAP) were used to formulate liposomes. This combination 112
of the fusogenic lipid DOPE with the cationic lipid DOTAP, is a frequently used composition due to its high 113
in vitro transfection efficiency and optimal immune response (McNeil et al., 2010; Liu and Huang, 2002) 114

5
and was therefore chosen to allow correlation of the systems produced via this new production method with 115
previous studies. 116
117
2. Materials and Methods 118
2.1 Materials 119
1,2-dioleoyl-sn-glycero-3-phsphoethanolamine (DOPE) and 1,2-dioleoyl-3-trimethylammonium-propane 120
(DOTAP) were purchased from Avanti Polar Lipids, Inc. (Alabaster, AL) (purity >99%). Ethanol and 121
chloroform (all HPLC grade) were purchased from Fisher Scientific (Leicestershire, UK). LipofectinTM 122
reagent was obtained from Invitrogen Life Technologies and the luciferase assay kit and CellTiter 96® 123
AQueous One Solution Cell Proliferation Assay were both obtained from Promega (Madison, WI). Serum 124
free and antibiotic free medium (opti-MEM), Dulbecco’s modified Eagles medium (DMEM), L-125
glutamine/Penicillin-Streptomycin and foetal bovine serum (FBS) were purchased from Gibco-Invitrogen 126
Ltd (Paisley, UK) (all cell culture grade). gWizTM Luciferase was obtained from Genovac GmbH, Germany. 127
COS-7 cells (GMP grade) were purchased from European collection of cell cultures (ECACC), a Health 128
Protection Agency Culture Collection (Salisbury, UK). 129
130
2.2 Micromixer 131
The micromixer was obtained from Precision NanoSystems Inc., with molded channels of 200 µm in width 132
and 79 µm in height with herringbone features of 50 x 31 µm in poly(dimethylsiloxane). Connections of 133
disposable 1mL syringes to the two inlet streams to the chip was done by fluid connectors. Liposome 134
formulations using the micromixer were performed on a benchtop NanoAssemblr™ instrument 135
(NanoAssemblr™, Precision NanoSystems Inc.). The two inlet streams comprised lipids dissolved in 136
ethanol and aqueous buffer (Tris, 10mM, pH 7.4), syringe pumps allowed for controlling the flow rates 137
and the flow ratios between the two inlet streams. 138
139
2.3 Liposome Preparation 140
DOPE and DOTAP (8:8 μMoles) were dissolved in ethanol. Here, an equal molar lipid ratio was used, a 141
standard ratio in cationic liposome-DNA transfection studies as reported previously (Felgner et al., 1994; 142
Moghaddam et al., 2011). The ethanol-lipid solution was injected into the first inlet and an aqueous buffer 143
(Tris 10 mM; pH 7.4) into the second inlet of the microfluidic mixer (Figure 1). During initial studies, the TFR 144
of aqueous buffer and lipid phase were varied from 0.5 mL/min to 2 mL/min and the FRR of the solvent and 145
aqueous phases was varied from 1:1 to 1:5. Values of TFR and FRR were extrapolated from previous 146
reported nanoprecipitation methods using a SHM design with a channel diameter of 200 μm (Zhigaltsev et 147
al., 2012) as well as based on preliminary screening prior to this work. The resulting aqueous dispersions 148
of liposome formulations, as formed by the mixing of the two adjacent streams, were collected from the 149

6
outlet stream and subsequently dialysed over night against Tris buffer (10 mM; pH 7.4) to remove any 150
residual solvent. 151
152
2.4 Liposome Characterisation 153
The dynamic light scattering (DLS) technique was used to report the intensity mean diameter (z-average) 154
and the polydispersity of all liposome formulations (Malvern Zetasizer Nano-ZS (Malvern Instruments, 155
Worcs., UK)). The measurements of vesicle size and polydispersity were carried out at 25 ˚C in Tris buffer 156
(1/10 dilution; 1 mM, pH 7.4). Liposome zeta potential was measured in Tris buffer (1 mM, pH 7.4) using 157
the Malvern Zetasizer Nano-ZS (Malvern Instruments, Worcs., UK). All measurements were undertaken in 158
triplicates. 159
160
2.5 HPLC 161
Lipid quantification of the liposome formulations was carried out using an Agilient 1200 series HPLC 162
connected to an SEDEX 90 evaporative light scattering detector (ELSD). A Phenomenex® Luna 5 μ C18 163
(2) 100A 150 x 4.6 mm column was used. An isocratic flow method was employed with 85% methanol and 164
15% 0.1% TFA water at a flow rate of 1 mL/min. The ELSD temperature was set at 52oC. The total run time 165
was 20 minutes. 166
167
2.6 DNA lipoplex preparation for in vitro transfection 168
To perform in vitro studies, lipoplexes was prepared by diluting 17.5 μl of SUV solution (16 μmoles) to 0.35 169
ml with Opti-MEM, and then incubated for 40 minutes at room temperature. After incubation, 0.35 ml of 170
Opti-MEM containing 3.5 μg plasmid DNA was added, mixed with liposome solution and incubated again 171
for a further 15 min at room temperature. The resultant lipoplex mixture was then diluted to a final volume 172
of 3.5 ml with Opti-MEM. The lipid/DNA charge ratio for in vitro study was +1.7/1. 173
174
2.7 In Vitro Transfection of COS-7 Cells 175
African green monkey kidney cells (COS-7 cells) were cultured at 37 °C under 5% CO2 in Delbecco’s 176
modified Eagles medium (DMEM). Medium was supplemented with 4 mM L-glutamine, 10% (v/v) foetal 177
bovine serum (FBS), penicillin (100 μg/ml) and streptomycin (100 μg/ml). 24 hours prior to transfection, the 178
COS-7 cells were plated at a cell concentration of 1 × 10⁵ cells/mL in 1 mL of medium in a 12-well plate 179
and were incubated overnight. Cells were washed with 1 mL of opti-MEM before lipoplexes were added to 180
the cells. 1 mL of the SUV-DNA solution (0.0078 μmole total lipid content containing 1 μg plasmid DNA) 181
was added to each well. Each transfection was performed in triplicate. After 5 hours of incubation time at 182
37 °C in 5% CO2, the medium was replaced with growth medium (DMEM) containing 10% FBS and the 183
cells were incubated for further 48 hours. The transfection efficiency of each formulation was measured by 184
determination of the percentage of luciferase activity in each sample to the control. In this study this value 185
is reported as luciferase activity (%) and Lipofectin was the control transfection reagent. 186

7
187
2.8 Cytotoxicity Study 188
Lipoplex formulations used in the cytotoxicity study were same as described above. COS-7 cells were 189
transferred on a 96-well plate and incubated for 24 hours at 37 °C in DMEM medium. 20 μL of MTS reagent 190
(CellTiter 96® AQueous One Solution Cell Proliferation Assay) was added to each well. The MTS reagent 191
is bioreduced by the cells into a red formazan product, which indicates the presence of metabolically active 192
cells. After 4 hours incubation at 37 °C, in a 5% humid CO2 atmosphere, the quantity of produced formazan 193
was measured on microplate reader (Thermo Scientific Molecular Spectrum plate reader) at A490, with the 194
absorbance reading being directly proportional to the number of living cells in the medium. In this study, 195
cell viability was calculated and expressed as a percentage to the positive control (i.e., cells and medium). 196
197
2.9 Statistical analysis 198
All experiments were performed in triplicates with calculation of means and standard deviations. Statistical 199
significance was determined by a one-way analysis of variance (ANOVA) on all data, and determined to 200
0.05 confidence intervals (p<0.05). 201
202
2.10 Design of experiments 203
The significance of the factors TFR (0.5 to 2 mL/min) and FRR (1:1 to 1:5) on liposome size, polydispersity 204
and transfection efficiency were investigated in a Design of experiments (DoE) study (MODDE version 10.0, 205
Umetrics). We used multiple linear regressions (MLR), which fits one response at a time, based on the 206
assumption that the responses are independent. A quadratic response surface model (RSM) was 207
performed. The collected data was used to estimate the coefficients of the model and assess for statistical 208
significance. The sum of squares of the residuals was minimized in the model. The aim was to obtain small 209
variation for the coefficients and minimize the prediction errors, which was achieved with least square 210
regression analysis. Prediction plots (response surfaces) were used for model interpretation and 211
assessment of optimal regions in the model prediction. Models were validated by analysis of variance 212
(ANOVA), which identified the goodness of fit and prediction (R2 and Q2) and the significance of each factor 213
in the model. Regression model significance test identified the validity of a model by dividing the mean 214
squares of the regression by the mean square of the residual, which allowed for determination of the 215
probability value p. With p< 0.05, the model determined was good. Lack of fit (LOF) test was performed to 216
investigate the model error and the replicate error. A model showed no lack of fit when a sufficiently small 217
model error and a good data fit were obtained, indicated by a p-value larger than the critical reference 0.05. 218
219
2.11 Multivariate Data Analysis 220
Principal Component Analysis (PCA) and Partial Least Square (PLS) regression analysis was performed 221
(SIMCA version 13.0, Umetrics) in order to analyse more than one variable at a time. The relationship 222
between the variables TFR and FRR and the responses (liposome size, polydispersity and transfection 223

8
efficacy) was displayed in a loading plot, using all experimentally obtained raw data in this study. Weights 224
were selected to maximize the correlation. For interpretation, a line from a selected variable was drawn 225
though the origin and X- and Y-variables were projected on the line. Variables opposite to each other were 226
determined as negatively correlated, positive correlation was determined with variables adjacent to each 227
other. 228
229
3. Results and Discussion 230
3.1 Liposome manufacturing by microfluidics – vesicle size can be in-process controlled. 231
Liposomes consisting of 1,2-dioleoyl-3-trimethylammonium-propane (DOTAP) and 1,2-dioleoyl-sn-glycero-232
3-phosphoethanolamine (DOPE) were formulated using the microfluidics method with a SHM design. In 233
this study, the aim was to optimise parameters to control particle size by varying the TFR from 0.5 mL/min 234
to 2 mL/min and varying the FRR of the solvent/aqueous phases from 1:1 to 1:5. It can be seen from Figure 235
2A that as the aqueous/ethanol FRR was increased, a reduction in liposome size was detected. However, 236
increasing the TFR from 0.5 mL/min to 2 mL/min did not significantly affect the vesicle size for the FRR of 237
1:1, 1:3 and 1:5 (Fig 2A). Liposomes formed at 1:5 solvent/ aqueous formulation were smaller in size and 238
around 50 - 75 nm compared to the 1:1 solvent/aqueous formulation (175 – 200 nm; Figure 2A). The FRR 239
strongly affects the polarity increase throughout the chamber as well as the final solvent concentration. At 240
higher FRR (1:5), the final solvent concentration is reduced, thus reducing the production of larger 241
liposomes due to particle fusion and lipid exchange (Ostwald ripening) after complete mixing is achieved. 242
Previous work using hydrodynamic flow-focusing techniques have also reported the decrease in liposome 243
size with the increase in FRR (Jahn et al., 2010; Zook and Vreeland, 2010), in agreement with results in 244
this study. The zeta potential of the liposomes formed using this method was maintained despite alterations 245
in flow rates and ratios with the liposomes had a positive zeta potential of around 45 - 60 mV (Figure 2B). 246
This is in agreement with data previously reported for DOPE:DOTAP prepared by the lipid-hydration method 247
following sonication (McNeil et al., 2010). Furthermore, homogenous suspensions were quickly achieved 248
using the microfluidics method as the polydispersity was around 0.2 to 0.5 (Figure 2C); the increase in FRR 249
had the highest impact on resulting PDI. 250
Overall, vesicle size was shown to be in-process controlled through the aqueous/ethanol flow rate ratio. 251
The TFR was shown to have no significant effect on the liposome size, zeta potential and polydispersity 252
indicating the potential of the microfluidics system to work at higher volumetric flow rates and higher 253
production outputs, which represents a key advantage of the microfluidics-based manufacturing of 254
liposomes. 255
256
3.2 Lipid content quantification by ELSD 257
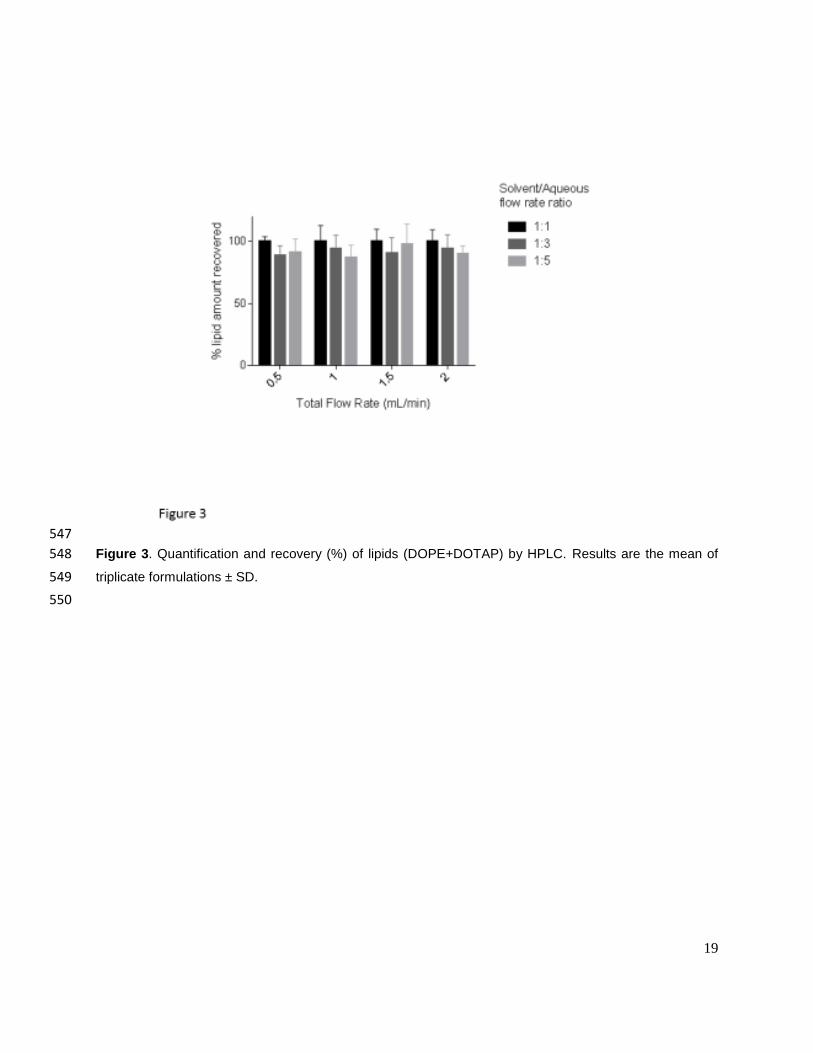
To investigate the lipid recovery of formulations manufactured at different TFR and FRR in the 258
NanoAssemblr™, we quantified the lipids in the liposome formulations. Lipid composition is usually 259

9
quantified via high performance liquid chromatography after extraction of the lipids in an organic phase. 260
Here, we used an evaporative light scattering detector (ELSD); a mass analyzer that allows for 261
quantification of lipids based on light scattering. We quantified the lipid content (DOPE and DOTAP) in each 262
formulation separately and related to it the initial lipid amount present in the solvent stock. The liposome 263
formulations were prepared in the NanoAssemblr™ at flow rates from 0.5 mL/min to 2 mL/min and FRR of 264
1:1, 1:3 and 1:5 (solvent: aqueous ratio). Lipid recovery was above 87% for all formulations, with no 265
significant differences (p>0.05) within all experiments (Figure 3). This suggests that lipid content remains 266
independent of flow rates and flow ratios in the NanoAssemblr™ and confirms the suitability of the 267
microfluidics method for producing small liposomes with high lipid recovery. 268
269
270
3.3 Biological activity of liposomal systems - In Vitro Transfection efficiency 271
To consider the efficacy of the liposome systems prepared using microfluidics, their ability as transfection 272
agents was tested using a standard in vitro assay. The commercially available LipofectinTM was used as a 273
control since it has been extensively used to transfect a wide variety of cells (Fortunati et al., 1996; Malone 274
et al., 1989) and a plasmid containing the luciferase gene (gWiz™ Luciferase) was used. The transfection 275
efficiency of each formulation was determined by measuring the percentage of luciferase activity in each 276
sample to the control (Lipofectin™) reported as luciferase activity (%) (Figure 4A). Whilst in general the 277
liposomes prepared at a solvent/aqueous flow rate of 1:3 gave the highest transfection rate, changes in the 278
total flow rate did not significantly influence the liposomes transfection activity again demonstrating this 279
method of liposome production is applicable for high-throughput production of liposomes (Figure 4A). The 280
size, charge and lipid/NDA ration have previously been shown to effect transfection efficiency (Aljaberi et 281
al., 2007; Caracciolo et al., 2007). Given that the lipids/DNA ratio, as well as the cationic zeta potential has 282
been constant in each lipoplex formulation, the resulting difference in transfection efficacy may be due to 283
differences in liposome sizes (Figure 2A) as previously investigated (McNeil et al., 2010; Esposito et al., 284
2006; Felgner et al., 1987; Kawaura et al., 1998). 285
286
The potential toxicity of these formulations was tested to verify that transfection efficacy was independent 287
of cell viability and toxicity. Overall, cell viabilities remained above 60% for all experiments performed with 288
no significant (p>0.05) difference between the formulations (Figure 4B). Neither the flow rates nor the flow 289
ratios were shown to affect the cell viability. Any gene delivery vector should ideally be of low toxicity, and 290
should additionally be easy to manufacture in a robust and reproducible process (Lui and Huang, 2003). 291
Here, the microfluidics process was shown to fulfil those requirements. 292
293
3.4 Statistical significance of the factors flow rate ratio and total flow rate – Design of Experiment 294
studies 295
10
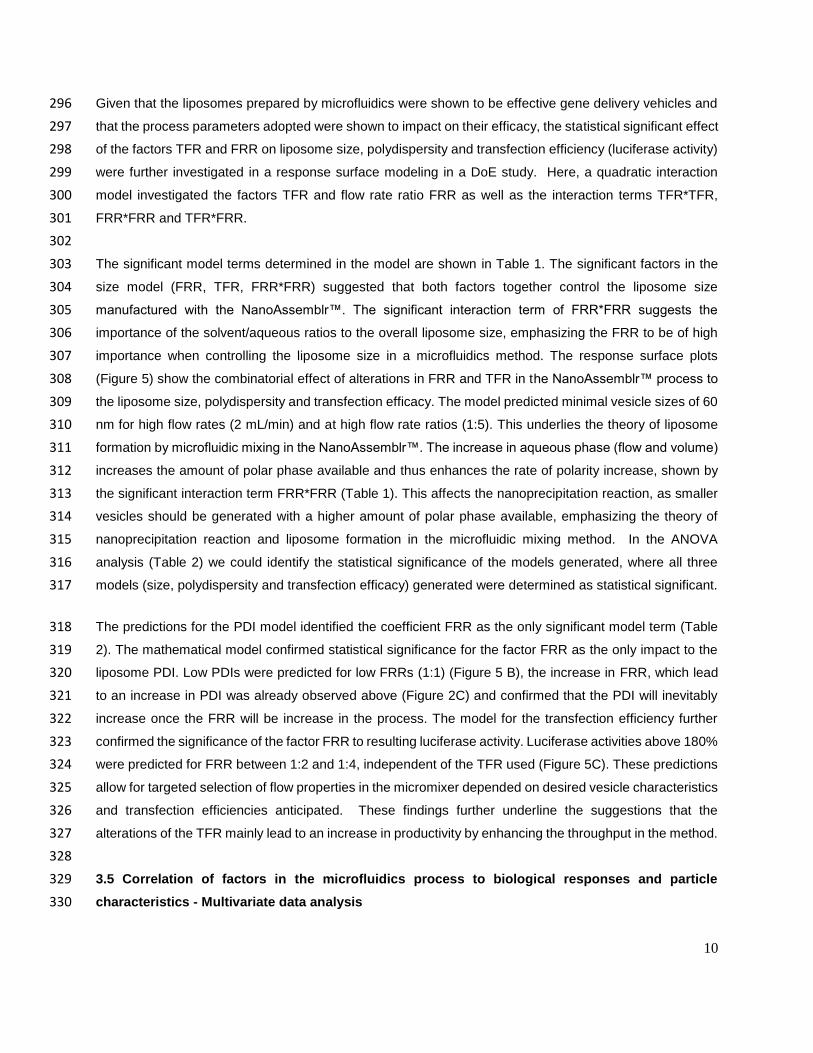
Given that the liposomes prepared by microfluidics were shown to be effective gene delivery vehicles and 296
that the process parameters adopted were shown to impact on their efficacy, the statistical significant effect 297
of the factors TFR and FRR on liposome size, polydispersity and transfection efficiency (luciferase activity) 298
were further investigated in a response surface modeling in a DoE study. Here, a quadratic interaction 299
model investigated the factors TFR and flow rate ratio FRR as well as the interaction terms TFR*TFR, 300
FRR*FRR and TFR*FRR. 301
302
The significant model terms determined in the model are shown in Table 1. The significant factors in the 303
size model (FRR, TFR, FRR*FRR) suggested that both factors together control the liposome size 304
manufactured with the NanoAssemblr™. The significant interaction term of FRR*FRR suggests the 305
importance of the solvent/aqueous ratios to the overall liposome size, emphasizing the FRR to be of high 306
importance when controlling the liposome size in a microfluidics method. The response surface plots 307
(Figure 5) show the combinatorial effect of alterations in FRR and TFR in the NanoAssemblr™ process to 308
the liposome size, polydispersity and transfection efficacy. The model predicted minimal vesicle sizes of 60 309
nm for high flow rates (2 mL/min) and at high flow rate ratios (1:5). This underlies the theory of liposome 310
formation by microfluidic mixing in the NanoAssemblr™. The increase in aqueous phase (flow and volume) 311
increases the amount of polar phase available and thus enhances the rate of polarity increase, shown by 312
the significant interaction term FRR*FRR (Table 1). This affects the nanoprecipitation reaction, as smaller 313
vesicles should be generated with a higher amount of polar phase available, emphasizing the theory of 314
nanoprecipitation reaction and liposome formation in the microfluidic mixing method. In the ANOVA 315
analysis (Table 2) we could identify the statistical significance of the models generated, where all three 316
models (size, polydispersity and transfection efficacy) generated were determined as statistical significant. 317
The predictions for the PDI model identified the coefficient FRR as the only significant model term (Table 318
2). The mathematical model confirmed statistical significance for the factor FRR as the only impact to the 319
liposome PDI. Low PDIs were predicted for low FRRs (1:1) (Figure 5 B), the increase in FRR, which lead 320
to an increase in PDI was already observed above (Figure 2C) and confirmed that the PDI will inevitably 321
increase once the FRR will be increase in the process. The model for the transfection efficiency further 322
confirmed the significance of the factor FRR to resulting luciferase activity. Luciferase activities above 180% 323
were predicted for FRR between 1:2 and 1:4, independent of the TFR used (Figure 5C). These predictions 324
allow for targeted selection of flow properties in the micromixer depended on desired vesicle characteristics 325
and transfection efficiencies anticipated. These findings further underline the suggestions that the 326
alterations of the TFR mainly lead to an increase in productivity by enhancing the throughput in the method. 327
328
3.5 Correlation of factors in the microfluidics process to biological responses and particle 329
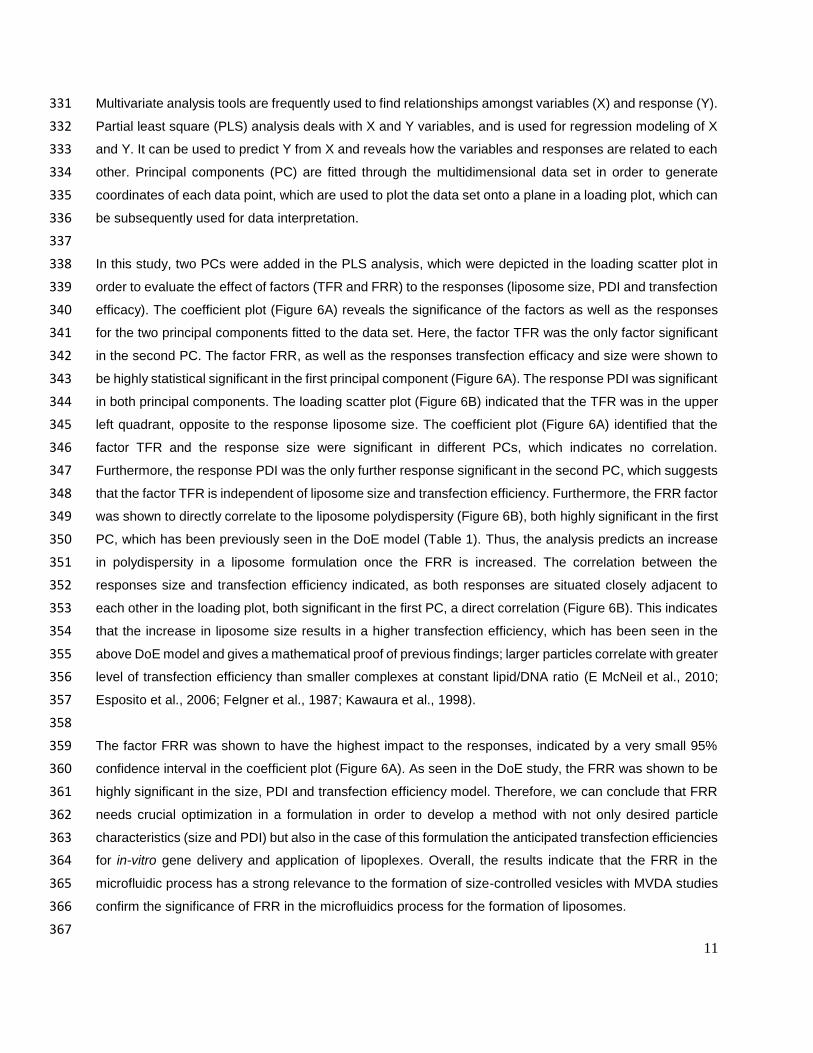
characteristics - Multivariate data analysis 330
11
Multivariate analysis tools are frequently used to find relationships amongst variables (X) and response (Y). 331
Partial least square (PLS) analysis deals with X and Y variables, and is used for regression modeling of X 332
and Y. It can be used to predict Y from X and reveals how the variables and responses are related to each 333
other. Principal components (PC) are fitted through the multidimensional data set in order to generate 334
coordinates of each data point, which are used to plot the data set onto a plane in a loading plot, which can 335
be subsequently used for data interpretation. 336
337
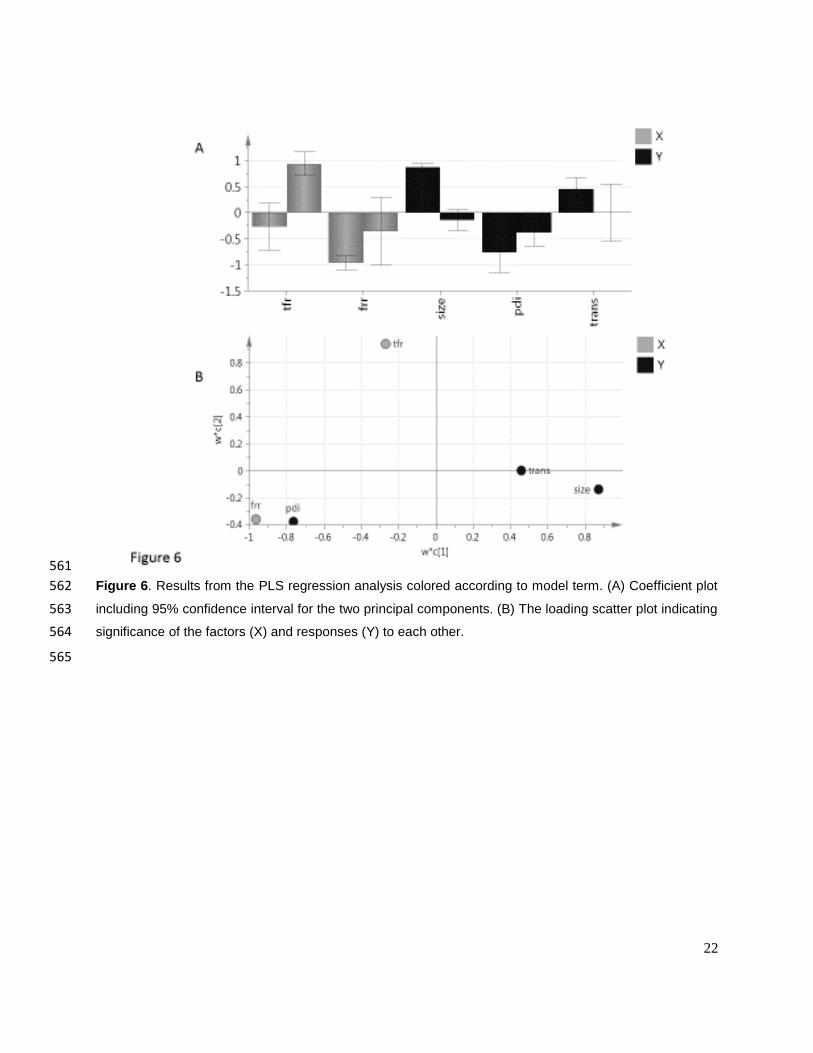
In this study, two PCs were added in the PLS analysis, which were depicted in the loading scatter plot in 338
order to evaluate the effect of factors (TFR and FRR) to the responses (liposome size, PDI and transfection 339
efficacy). The coefficient plot (Figure 6A) reveals the significance of the factors as well as the responses 340
for the two principal components fitted to the data set. Here, the factor TFR was the only factor significant 341
in the second PC. The factor FRR, as well as the responses transfection efficacy and size were shown to 342
be highly statistical significant in the first principal component (Figure 6A). The response PDI was significant 343
in both principal components. The loading scatter plot (Figure 6B) indicated that the TFR was in the upper 344
left quadrant, opposite to the response liposome size. The coefficient plot (Figure 6A) identified that the 345
factor TFR and the response size were significant in different PCs, which indicates no correlation. 346
Furthermore, the response PDI was the only further response significant in the second PC, which suggests 347
that the factor TFR is independent of liposome size and transfection efficiency. Furthermore, the FRR factor 348
was shown to directly correlate to the liposome polydispersity (Figure 6B), both highly significant in the first 349
PC, which has been previously seen in the DoE model (Table 1). Thus, the analysis predicts an increase 350
in polydispersity in a liposome formulation once the FRR is increased. The correlation between the 351
responses size and transfection efficiency indicated, as both responses are situated closely adjacent to 352
each other in the loading plot, both significant in the first PC, a direct correlation (Figure 6B). This indicates 353
that the increase in liposome size results in a higher transfection efficiency, which has been seen in the 354
above DoE model and gives a mathematical proof of previous findings; larger particles correlate with greater 355
level of transfection efficiency than smaller complexes at constant lipid/DNA ratio (E McNeil et al., 2010; 356
Esposito et al., 2006; Felgner et al., 1987; Kawaura et al., 1998). 357
358
The factor FRR was shown to have the highest impact to the responses, indicated by a very small 95% 359
confidence interval in the coefficient plot (Figure 6A). As seen in the DoE study, the FRR was shown to be 360
highly significant in the size, PDI and transfection efficiency model. Therefore, we can conclude that FRR 361
needs crucial optimization in a formulation in order to develop a method with not only desired particle 362
characteristics (size and PDI) but also in the case of this formulation the anticipated transfection efficiencies 363
for in-vitro gene delivery and application of lipoplexes. Overall, the results indicate that the FRR in the 364
microfluidic process has a strong relevance to the formation of size-controlled vesicles with MVDA studies 365
confirm the significance of FRR in the microfluidics process for the formation of liposomes. 366
367
12
The systematic application of statistical based process control and optimization requires not only fewer 368
experiments to find a local optima, it also it reveals factor interactions and can be used for process 369
simulations. Overall, it will lead to better understanding of a process, which assists in development and 370
scale-up. It is a cost-effective method providing deep understanding in a process (Singh et al., 2005). 371
Gabrielsson et al. reviewed multivariate methods in pharmaceutical applications, which range from factorial 372
designs to multivariate data analysis and regression analysis, where studies reported improved process 373
and product quality (Gabrielsson et al., 2002). Where DoE is frequently used to find local optima, PCA and 374
PLS are mainly applied to gain deeper understanding and information about a process and the effect of 375
how factors influence the responses. In this study, we have developed a statistical valid regression model, 376
which allows for prediction of liposome sizes, polydispersity and transfection efficiencies as a function of 377
variables in the microfluidics-based manufacturing method. Furthermore, the application of MVDA allowed 378
for deeper understanding of process settings that will lead to increased process control with a defined 379
product quality outcome. The combination of multivariate methods and experimental design in any 380
pharmaceutical or biopharmaceutical process development strategies is a powerful tool towards developing 381
new processes and finding optima within a defined region of factors by speeding up a developing process. 382
383
4. Conclusion 384
In this paper, we have used a microfluidics-based liposome manufacturing method and varied the process 385
parameters total flow rate and flow rate ratio to produce liposomes of defined size. Using microfluidics, 386
homogenous liposomes suspensions can be prepared in a high throughput method setup. Liposomes 387
manufactured by this method were shown to give reproducible transfection results in standard transfection 388
protocols. The application of statistical-based methods (Design of Experiments and Multivariate Data 389
Analysis) revealed the mathematical relationship and significance of the factors total flow rate and flow rate 390
ratio in the microfluidics process to the liposome size, polydispersity and transfection efficacy. We show 391
that the here applied methods and mathematical modeling tools can efficiently be used to model and predict 392
liposome size, polydispersity and transfection efficacy as a function of the variables in the microfluidics 393
method. Furthermore, the advantages of microfluidics as a bottom-up liposome manufacturing method have 394
been shown, anticipating microfluidics and associated lab-on-a-chip applications will become the choice of 395
liposome manufacturing in future. With these studies, we have demonstrated the advantages of 396
incorporating additionally statistical based methods into a development process. Application of statistical 397
based process control and optimization tools like DoE and MVDA will enhance the reproducibility in a 398
process and aid for generation of a design space. This will increase the understanding and confidence in a 399
process setting and allow for predictive and correlative comparisons between the critical process 400
parameters and their effect on desired critical quality attributes, leading to a desired and robust product 401
quality 402
403
13
Acknowledgements 404
This work was part funded by the EPSRC Centre for Innovative Manufacturing in Emergent Macromolecular 405
Therapies (E Kastner), NewTBVAC (contract no.HEALTHF3-2009-241745) (A Wilkinson), and Aston 406
University (B Moghaddam). 407
References 408
Aljaberi, A., Spelios, M., Kearns, M., Selvi, B., Savva, M., 2007. Physicochemical properties affecting 409 lipofection potency of a new series of 1, 2-dialkoylamidopropane-based cationic lipids. Colloids and 410 Surfaces B: Biointerfaces 57, 108-117. 411 Bally, F., Garg, D.K., Serra, C.A., Hoarau, Y., Anton, N., Brochon, C., Parida, D., Vandamme, T., 412 Hadziioannou, G., 2012. Improved size-tunable preparation of polymeric nanoparticles by microfluidic 413 nanoprecipitation. Polymer 53, 5045-5051. 414 Barnadas-Rodriguez, R., Sabes, M., 2001. Factors involved in the production of liposomes with a high-415 pressure homogenizer. International journal of pharmaceutics 213, 175-186. 416 Belliveau, N.M., Huft, J., Lin, P.J., Chen, S., Leung, A.K., Leaver, T.J., Wild, A.W., Lee, J.B., Taylor, R.J., Tam, 417 Y.K., 2012. Microfluidic synthesis of highly potent limit-size lipid nanoparticles for in vivo delivery of siRNA. 418 Molecular Therapy—Nucleic Acids 1, e37. 419 Caracciolo, G., Pozzi, D., Caminiti, R., Marchini, C., Montani, M., Amici, A., Amenitsch, H., 2007. 420 Transfection efficiency boost by designer multicomponent lipoplexes. Biochimica et Biophysica Acta 421 (BBA)-Biomembranes 1768, 2280-2292. 422 Davies, R.T., Kim, D., Park, J., 2012. Formation of liposomes using a 3D flow focusing microfluidic device 423 with spatially patterned wettability by corona discharge. Journal of Micromechanics and 424 Microengineering 22, 055003. 425 de Paula Rigoletto, T., Silva, C.L., Santana, M.H., Rosada, R.S., de la Torre, L.G., 2012. Effects of extrusion, 426 lipid concentration and purity on physico-chemical and biological properties of cationic liposomes for 427 gene vaccine applications. Journal of microencapsulation 29, 759-769. 428 E McNeil, S., Vangala, A., W Bramwell, V., J Hanson, P., Perrie, Y., 2010. Lipoplexes formulation and 429 optimisation: in vitro transfection studies reveal no correlation with in vivo vaccination studies. Current 430 drug delivery 7, 175-187. 431 Eriksson, L., 2006. Multi-and megavariate data analysis. MKS Umetrics AB. 432 Eriksson, L., 2008. Design of experiments: principles and applications. MKS Umetrics AB. 433 Esposito, C., Generosi, J., Mossa, G., Masotti, A., Castellano, A.C., 2006. The analysis of serum effects on 434 structure, size and toxicity of DDAB–DOPE and DC-Chol–DOPE lipoplexes contributes to explain their 435 different transfection efficiency. Colloids and Surfaces B: Biointerfaces 53, 187-192. 436 Felgner, J.H., Kumar, R., Sridhar, C., Wheeler, C.J., Tsai, Y.J., Border, R., Ramsey, P., Martin, M., Felgner, 437 P.L., 1994. Enhanced gene delivery and mechanism studies with a novel series of cationic lipid 438 formulations. Journal of Biological Chemistry 269, 2550-2561. 439 Felgner, P.L., Gadek, T.R., Holm, M., Roman, R., Chan, H.W., Wenz, M., Northrop, J.P., Ringold, G.M., 440 Danielsen, M., 1987. Lipofection: a highly efficient, lipid-mediated DNA-transfection procedure. 441 Proceedings of the National Academy of Sciences 84, 7413-7417. 442 Fortunati, E., Bout, A., Antonia Zanta, M., Valerio, D., Scarpa, M., 1996. In vitro and in vivo gene transfer 443 to pulmonary cells mediated by cationic liposomes. Biochimica et Biophysica Acta (BBA)-Gene Structure 444 and Expression 1306, 55-62. 445 Gabrielsson, J., Lindberg, N.O., Lundstedt, T., 2002. Multivariate methods in pharmaceutical applications. 446 Journal of chemometrics 16, 141-160. 447

14
Jahn, A., Stavis, S.M., Hong, J.S., Vreeland, W.N., DeVoe, D.L., Gaitan, M., 2010. Microfluidic mixing and 448 the formation of nanoscale lipid vesicles. Acs Nano 4, 2077-2087. 449 Jahn, A., Vreeland, W.N., Gaitan, M., Locascio, L.E., 2004. Controlled vesicle self-assembly in microfluidic 450 channels with hydrodynamic focusing. Journal of the American Chemical Society 126, 2674-2675. 451 Karnik, R., Gu, F., Basto, P., Cannizzaro, C., Dean, L., Kyei-Manu, W., Langer, R., Farokhzad, O.C., 2008. 452 Microfluidic platform for controlled synthesis of polymeric nanoparticles. Nano letters 8, 2906-2912. 453 Kawaura, C., Noguchi, A., Furuno, T., Nakanishi, M., 1998. Atomic force microscopy for studying gene 454 transfection mediated by cationic liposomes with a cationic cholesterol derivative. FEBS letters 421, 69-455 72. 456 Kurakazu, T., Takeuchi, S., 2010. Generation of lipid vesicles using microfluidic T-junctions with pneumatic 457 valves, Micro Electro Mechanical Systems (MEMS), 2010 IEEE 23rd International Conference on. IEEE, pp. 458 1115-1118. 459 Lapinski, M.M., Castro-Forero, A., Greiner, A.J., Ofoli, R.Y., Blanchard, G.J., 2007. Comparison of liposomes 460 formed by sonication and extrusion: rotational and translational diffusion of an embedded chromophore. 461 Langmuir : the ACS journal of surfaces and colloids 23, 11677-11683. 462 Lawrence, X.Y., 2008. Pharmaceutical quality by design: product and process development, 463 understanding, and control. Pharmaceutical Research 25, 781-791. 464 Liu, F., Huang, L., 2002. Development of non-viral vectors for systemic gene delivery. Journal of controlled 465 release 78, 259-266. 466 Lui, V.W.-Y., Huang, L., 2003. Nonviral approaches for cancer gene therapy. DRUGS AND THE 467 PHARMACEUTICAL SCIENCES 131, 279-320. 468 Malone, R.W., Felgner, P.L., Verma, I.M., 1989. Cationic liposome-mediated RNA transfection. 469 Proceedings of the National Academy of Sciences of the United States of America 86, 6077. 470 Mandenius, C.F., Brundin, A., 2008. Bioprocess optimization using design‐of‐experiments methodology. 471 Biotechnology progress 24, 1191-1203. 472 Maulucci, G., De Spirito, M., Arcovito, G., Boffi, F., Castellano, A.C., Briganti, G., 2005. Particle size 473 distribution in DMPC vesicles solutions undergoing different sonication times. Biophysical journal 88, 474 3545-3550. 475 Moghaddam, B., McNeil, S.E., Zheng, Q., Mohammed, A.R., Perrie, Y., 2011. Exploring the Correlation 476 Between Lipid Packaging in Lipoplexes and Their Transfection Efficacy. Pharmaceutics 3, 848-864. 477 Montgomery, D.C., Montgomery, D.C., Montgomery, D.C., 1997. Design and analysis of experiments. 478 Wiley New York. 479 Olson, F., Hunt, C., Szoka, F., Vail, W., Papahadjopoulos, D., 1979. Preparation of liposomes of defined size 480 distribution by extrusion through polycarbonate membranes. Biochimica et Biophysica Acta (BBA)-481 Biomembranes 557, 9-23. 482 Pasqualoto, K.F., Teófilo, R.F., Guterres, M., Pereira, F.S., Ferreira, M., 2007. A study of physicochemical 483 and biopharmaceutical properties of Amoxicillin tablets using full factorial design and PCA biplot. Analytica 484 chimica acta 595, 216-220. 485 Perrie, Y., Kastner, E., Kaur, R., Wilkinson, A., Ingham, A.J., 2013. A case-study investigating the 486 physicochemical characteristics that dictate the function of a liposomal adjuvant. Human vaccines and 487 immunotherapeutics 9, 1374-1381. 488 Pradhan, P., Guan, J., Lu, D., Wang, P.G., Lee, L.J., Lee, R.J., 2008. A facile microfluidic method for 489 production of liposomes. Anticancer research 28, 943-947. 490 Pupo, E., Padrón, A., Santana, E., Sotolongo, J., Quintana, D., Dueñas, S., Duarte, C., de la Rosa, M.C., 491 Hardy, E., 2005. Preparation of plasmid DNA-containing liposomes using a high-pressure homogenization–492 extrusion technique. Journal of controlled release 104, 379-396. 493

15
Rathore, A.S., Bhushan, N., Hadpe, S., 2011. Chemometrics applications in biotech processes: a review. 494 Biotechnology progress 27, 307-315. 495 Riaz, M., 1996. Liposomes preparation methods. Pakistan journal of pharmaceutical sciences 9, 65-77. 496 Singh, B., Kapil, R., Nandi, M., Ahuja, N., 2011. Developing oral drug delivery systems using formulation by 497 design: vital precepts, retrospect and prospects. Expert opinion on drug delivery 8, 1341-1360. 498 Singh, B., Kumar, R., Ahuja, N., 2005. Optimizing drug delivery systems using systematic" design of 499 experiments." Part I: fundamental aspects. Critical Reviews™ in Therapeutic Drug Carrier Systems 22. 500 Squires, T.M., Quake, S.R., 2005. Microfluidics: Fluid physics at the nanoliter scale. Reviews of modern 501 physics 77, 977. 502 Stroock, A.D., Dertinger, S.K., Ajdari, A., Mezić, I., Stone, H.A., Whitesides, G.M., 2002. Chaotic mixer for 503 microchannels. Science 295, 647-651. 504 Teh, S.-Y., Lin, R., Hung, L.-H., Lee, A.P., 2008. Droplet microfluidics. Lab on a Chip 8, 198-220. 505 van Swaay, D., 2013. Microfluidic methods for forming liposomes. Lab on a Chip 13, 752-767. 506 Vandervoort, J., Ludwig, A., 2002. Biocompatible stabilizers in the preparation of PLGA nanoparticles: a 507 factorial design study. International journal of pharmaceutics 238, 77-92. 508 Wagner, A., Vorauer-Uhl, K., 2011. Liposome technology for industrial purposes. Journal of drug delivery 509 2011, 591325. 510 Whitesides, G.M., 2006. The origins and the future of microfluidics. Nature 442, 368-373. 511 Wold, S., Sjöström, M., Eriksson, L., 2001a. PLS-regression: a basic tool of chemometrics. Chemometrics 512 and intelligent laboratory systems 58, 109-130. 513 Wold, S., Trygg, J., Berglund, A., Antti, H., 2001b. Some recent developments in PLS modeling. 514 Chemometrics and intelligent laboratory systems 58, 131-150. 515 Zhigaltsev, I.V., Belliveau, N., Hafez, I., Leung, A.K., Huft, J., Hansen, C., Cullis, P.R., 2012. Bottom-up design 516 and synthesis of limit size lipid nanoparticle systems with aqueous and triglyceride cores using millisecond 517 microfluidic mixing. Langmuir : the ACS journal of surfaces and colloids 28, 3633-3640. 518 Zook, J.M., Vreeland, W.N., 2010. Effects of temperature, acyl chain length, and flow-rate ratio on 519 liposome formation and size in a microfluidic hydrodynamic focusing device. Soft Matter 6, 1352-1360. 520
521
522

16
Tables 523 524 Table 1: Coefficient list for the responses size, zp and PDI. Coefficients were determined as statistically 525 significant (p< 0.05). 526 527
Response Significant coefficients
Size (nm) TFR, FRR, FRR*FRR
PDI FRR, FRR*FRR
Transfection Efficiency FRR, FRR*FRR
528 529 530 531 532 Table 2: ANOVA for the responses size, z and PDI. The p-statistics were analysed as well as the Lack-of-533 fit (LOF), together with fit power (R2) and predictive power (Q2). 534 535
ANOVA Size PDI Transfection Efficiency
Regression p 0.000 0.001 0.001
LOF p 0.255 0.973 0.585
R2 0.989 0.885 0.889
Q2 0.963 0.789 0.522
Model Significant? Yes Yes Yes
536

17
Figure legends 537
538
Figure 1: Schematic of liposome formulation process. Lipids dissolved in ethanol and an aqueous buffer 539
are injected into separate chamber inlets. Mixing takes place in the chamber (small picture), designed with 540
grooves on the channel floor to aid chaotic advection between both streams. Depicted are the critical 541
process parameters and the critical quality attributes. 542

18
543
Figure 2. Liposome characteristics. (A) Vesicle size (z-average), (B) zeta potential and (C) polydispersity 544
of DOPE:DOTAP formulations manufactured by microfluidic mixing. Results are the mean of triplicate 545
formulations ± SD. 546
19
547
Figure 3. Quantification and recovery (%) of lipids (DOPE+DOTAP) by HPLC. Results are the mean of 548
triplicate formulations ± SD. 549
550

20
551
Figure 4. (A) Comparison of transfection efficiency of cationic nanoparticles. Liposomes were complexed 552
with gWiz plasmid DNA expressing firefly luciferase. (B) Relative cell viability of nanoparticles formulated 553
with distilled water. Results denote mean ± SD, n = 3. 554
555

21
556
Figure 5. The response surface plots in the DoE study for the responses size (A), PDI (B) and transfection 557
efficacy (C) as a function of flow rate ratio and total flow rate. All three models were determined as statistical 558
significant in an ANOVA analysis. 559
560
22
561
Figure 6. Results from the PLS regression analysis colored according to model term. (A) Coefficient plot 562
including 95% confidence interval for the two principal components. (B) The loading scatter plot indicating 563
significance of the factors (X) and responses (Y) to each other. 564
565