1 hawaii strategic highway safety plan: facility design dan galanis injury prevention and control...
Post on 19-Dec-2015
213 views
TRANSCRIPT

1
Hawaii Strategic Highway Safety Plan:
FACILITY DESIGN
Dan GalanisInjury Prevention and Control Program
Hawaii Department of Health1250 Punchbowl St., Room 214
Honolulu, HI 96813Ph: 586-5943
E-mail: [email protected]

2
Overview of presentation on Facility Design
• Three main areas:– Head-on collisions– Running off the road – Crashes at intersections
• Fatal traffic crashes (FARS data)• Non-fatal traffic crashes (MVAR/DOT crash data)
– Traffic only, i.e. crashes on public roads• Excludes crashes in parking lots, driveways, military facilities,
gated sub-divisions, etc.
– Unintentional in nature• Excludes suicides, deaths of undetermined intent
– Available for fatality data only

3
Head-on collisions -- definitions
• Includes only crashes on non-junction sections of roadways– Excludes crashes in intersections or “intersection related”,
“junction area”, “off road”, etc.
• Excludes crashes involving pedestrians or bicyclists
• Includes collisions described as – “head-on”
• 69% of fatal cases, 30% of non-fatal cases– “sideswipe—opposite direction”
• 8% of fatal cases, 36% of non-fatal cases– “angle—opposite direction”
• 22% of fatal cases, 34% of non-fatal cases

4
Annual number of fatal and non-fatal head-on* traffic collisions in Hawaii, 2001-2005
(Includes only non-intersection crashes. *“Head-on” includes sideswipe and angle collisions in opposite directions.)
0
10
20
30
40
50
60
20 17
13
17 18
509
543 544
594
561
25.6
34.0
18.8
27.4 27.3
11.7 12.4 11.5 13.1 12.1
2001 2002 2003 2004 2005
percent
number
Fatal crashes (n=325) 26% head-on/opposite direction
2001 2002 2003 2004 2005
Non-fatal crashes (n=22,579) 12% head-on/opposite direction

5
Characteristics of head-on traffic crashes in Hawaii, 2001-2005

6
Running off the road -- definitions
• Excludes crashes involving pedestrians or bicyclists
• Includes only crashes on non-junction sections of roadways– Excludes crashes in intersections or “intersection related”, “junction
area”, etc.
• Fatal crashes (FARS) include crashes due to “failure to keep in proper lane”– 64% of those described as ROR, including all 64 from 2004-2005
• Non-fatal crashes includes crashes due to… – “Overturned/ran off roadway” (Harmful Action section)
• non collision: 35% of ROR– “Collision w/ object” (Harmful Action section)—not other vehicle:
• Guardrail (7%), island/raised median (8%), embankment/wall (9%), utility pole (9%), etc.---total: 53% of ROR
– Vehicle collision “Off-Roadway” (Location of Harmful Event section):• 9% of ROR
7
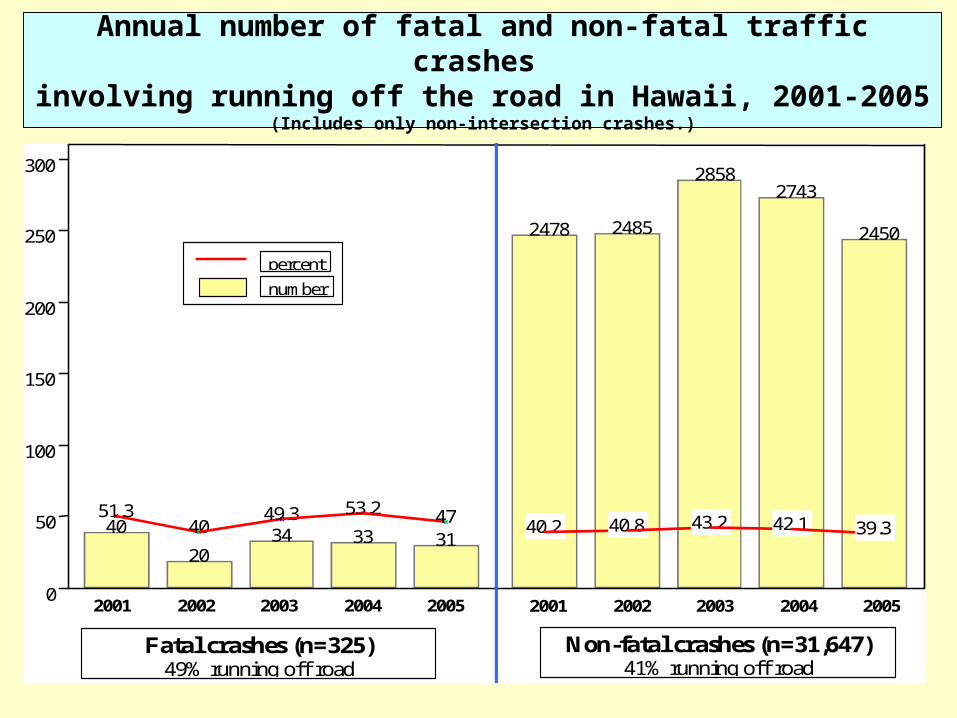
Annual number of fatal and non-fatal traffic crashes involving running off the road in Hawaii, 2001-2005
(Includes only non-intersection crashes.)
0
50
100
150
200
250
300
40
20 34 33 31
2478 2485
2858 2743
2450
51.3 40
49.3 53.2 47 40.2 40.8 43.2 42.1 39.3
2001 2002 2003 2004 2005
percent
number
Fatal crashes (n=325) 49% running off road
2001 2002 2003 2004 2005
Non-fatal crashes (n=31,647) 41% running off road

8
Characteristics of crashes related to running off the road in Hawaii, 2001-2005

9
Crashes at intersections -- definitions
• Includes crashes at intersections and those coded as “intersection related” (FARS) and “intersection area” (DOT)– Excludes crashes in driveways, alleys,
entrance/exit ramp, etc
• Priority sequence: pedestrians > bicyclists > motorcyclists > occupants– E.g. motorcyclist hitting a pedestrian pedestrian
crash

10
Distribution (number and percent) of fatal and non-fatal traffic crashes in intersections in Hawaii, 2001-2005
25%
50%
75%
100%
33.3
6.5
24.8
35.3
6.1 4.4 6.1
83.4
ped. (n=51)
Fatal crashes (total=153)
bicy. (10)
mcycle. (38)
occup. (54)
ped. (1,064)
Non-fatal crashes (total=17,346)
bicy. (757)
mcycle. (1,059)
occup. (14,466)

11
Annual number of fatal and non-fatal traffic crashes in intersections in Hawaii, 2001-2005
0
10
20
30
40
8
16
5
10
12
2 1 1
3 3 4
7
5
9
13
8
14 13
12
7
3178
2951 3094
287
2373 22
38
24
34 35
3759
3506 3681
3459
2941
2001 2002 2003 2004 2005 2001 2002 2003 2004 2005
Fatal crashes (total=153) Non-fatal crashes (17,346)
pedestrian bicyclist motorcyclist/moped occupant total

12
Characteristics of vehicle crashes at intersections in Hawaii, 2001-2005

13
Characteristics of pedestrian/bicyclist crashes at intersections in Hawaii, 2001-2005

14
Fatal traffic crashes in Hawaii, by type of crash and posted speed limit, 2001-2005
10%
20%
30%
40%
50%
21.7
33.6
21.5 19.9
3.2
46.2
33.8
11
4.8 4.1
31
48.3
17.2
3.4
28
34.4
18.8
15.5
3.3
30 to 35
10 to 25
55 +
mph
40 to 50
unk. 30 to 35
10 to 25
55 +
mph
40 to 50
unk. 30 to 35
10 to 25
55 +
mph
40 to 50
unk. 30 to 35
10 to 25
55 +
mph
40 to 50
unk.
vehicle crashes 72% of total
pedestrian 24%
bicyclist 5%
total 611 crashes

15
Fatal traffic crashes in Hawaii, by type of crash and traffic way flow, 2001-2005
20%
40%
60%
80%
12.6 11.9
72.5
3 5.5
15.9
73.8
4.8 3.4
24.1
69
3.4
divide w/
barrier
divide w/o
barrier
un- divided
other/ unk.
vehicle crashes 72% of total
pedestrian 24%
bicyclist 5%
divide w/
barrier
divide w/o
barrier
un- divided
other/ unk.
divide w/
barrier
divide w/o
barrier
un- divided
other/ unk.

16
Fatal traffic crashes in Hawaii, by type of crash and roadway function class, 2001-2005
10%
20%
30%
40%
50%
35.9
8
3
33.6
10.5 7.8
1.1
15.9
4.1 0.7
49
19.3
10.3
0.7
24.1
3.4
51.7
13.8
6.9
rura
l ar
teri
al
rura
l co
llec
tor
rura
l lo
cal
road
urba
n co
llec
tor
urba
n ar
teri
al
urba
n lo
cal
road
othe
r/un
know
n
rura
l ar
teri
al
rura
l co
llec
tor
rura
l lo
cal
road
urba
n co
llec
tor
urba
n ar
teri
al
urba
n lo
cal
road
othe
r/un
know
n
rura
l ar
teri
al
rura
l co
llec
tor
rura
l lo
cal
road
urba
n co
llec
tor
urba
n ar
teri
al
urba
n lo
cal
road
othe
r/un
know
n
vehicle crashes (72%) pedestrian (24%) bicyclist (5%)

17
Fatal traffic crashes in Hawaii, by type of crash and relation to roadway junction, 2001-2005
20%
40%
60%
80%
14.6
6.4
74.4
4.6
10.3
24.8
63.4
1.4
24.1
10.3
65.5
inter- section
inter- section related
non- junction
other/ unk.
inter- section
inter- section related
non- junction
other/ unk.
inter- section
inter- section related
non- junction
vehicle crashes 72% of total
pedestrian 24%
bicyclist 5%