1. growth of real gdp and business cycles learning objectives 1.define real gross domestic product...
TRANSCRIPT


1. GROWTH OF REAL GDP AND BUSINESS CYCLES
Learning Objectives1. Define real gross domestic product and explain how its
calculation avoids both double-counting and the effects of changes in the price level.
2. Identify the phases of a business cycle.3. Relate business cycles to the overall long-run trend in real GDP in
the United States.

1. GROWTH OF REAL GDP AND BUSINESS CYCLES
• The Business cycle is the economy’s pattern of expansion, then contraction, then expansion again.
• Nominal GDP is the total value of final goods and services for a particular period valued in terms of prices for that period.
• Real GDP is the total value of all final goods and services produced during a particular year or period, adjusted to eliminate the effects of changes in prices.

1.1 Phases of the Business Cycle
• An expansion is a sustained period in which real GDP is rising.• A recession is a sustained period in which real GDP is falling.• A peak is the point of the business cycle at which an
expansion ends and a recession begins.• A trough is the point of the business cycle at which a
recession ends and an expansion begins.

Phases of the Business Cycle

1.2 Business Cycles and the Growth of Real GDP in the United States

2 PRICE LEVEL CHANGES
Learning Objectives1. Define inflation and deflation, explain how their
rates are determined, and articulate why price-level changes matter.
2. Explain what a price index is and outline the general steps in computing a price index.
3. Describe and compare different price indexes.4. Explain how to convert nominal values to real
values and explain why it is useful to make this calculation.
5. Discuss the biases that may arise from price indexes that employ fixed market baskets of goods and services.

2 PRICE LEVEL CHANGES
• Inflation is an increase in the average level of prices.
– Redistributes wealth– Creates uncertainty reduces lending– hurts lenders and benefits borrowers
• Deflation is a decrease in the average level of prices.
– Redistributes wealth– Creates uncertainty– hurts borrowers and benefits lenders
• Hyperinflation is an inflation rate in excess of 200% per year.
• Disinflation is a decrease in the level of inflation. e.g. inflation fell from 5% to just 3%.

2.1 Why Do We Care?

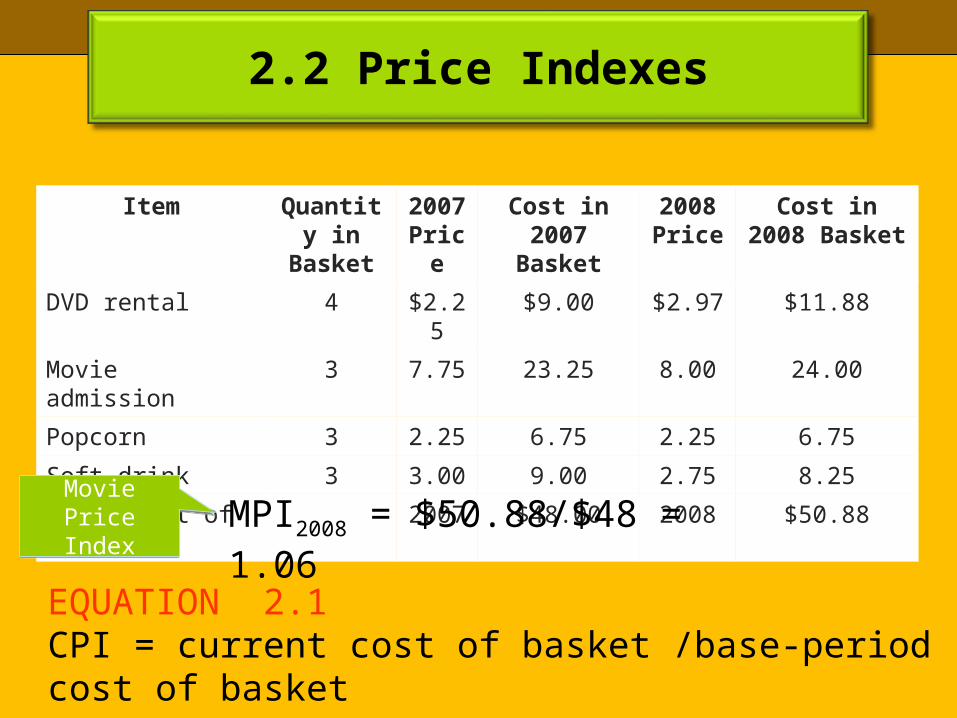
2.2 Price Indexes
• A price index is a number whose movement reflects movement in the average level of prices.
• A base period is a time period against which costs of the market basket in other periods will be compared in computing a price index.
• The consumer price index (CPI) is a price index whose movement reflects changes in the prices of goods and services typically purchased by consumers.
2.2 Price Indexes
Item Quantity in Basket
2007 Price
Cost in 2007 Basket
2008 Price
Cost in 2008 Basket
DVD rental 4 $2.25 $9.00 $2.97 $11.88
Movie admission 3 7.75 23.25 8.00 24.00
Popcorn 3 2.25 6.75 2.25 6.75
Soft drink 3 3.00 9.00 2.75 8.25
Total cost of basket 2007 $48.00 2008 $50.88
MPI2008 = $50.88/$48 = 1.06
EQUATION 2.1CPI = current cost of basket /base-period cost of basket
Movie Price Index
Movie Price Index

2.2 Price Indexes
EQUATION 2.3Implicit price deflator = nominal GDP/real GDP
• The implicit price deflator is a price index for all final goods and services produced; it is the ratio of nominal GDP to real GDP.
• The personal consumption expenditures price index is a price index that includes durable goods, nondurable goods, and services and is provided along with estimates for prices of each component of consumption spending.

2.3 Computing the Rate of Inflation or Deflation
EQUATION 2.4
index of valueinitial
indexin changepercent deflation or inflation of Rate
6% .06 1.0
1.0-1.06 2008in rateinflation Movie

2.4 Computing Real Values Using Price Indexes
EQUATION 2.5
tat timeindex price
X X of valueReal t
t
• The real value is a value expressed in units of constant purchasing power (adjusts for inflation).
• The nominal value is a value expressed in dollars of the current period.

2.4 Computing Real Values Using Price Indexes
• Are price indexes accurate measures of price-level changes?
– Components of market basket are fixed.– New goods are excluded.– Quality changes may not be accounted for.– Indexes do not account for changes consumers
make in terms of where they shop.
Sources of Bias 1997 Estimate 2006 Estimate
Substitution 0.4 0.4
New products and quality change 0.6 0.3
Switching to new outlets 0.1 0.1
Total 1.1 0.8
Plausible range 0.8-1.6 ------

3. UNEMPLOYMENT
Learning Objectives1. Explain how unemployment is measured in the
United States.2. Define three different types of unemployment.3. Define and illustrate graphically what is meant
by the natural level of employment. Relate the natural level of employment to the natural rate of unemployment.

3.1 Measuring Unemployment
• The labor force is the total number of people (age 16 and over) working or unemployed.
• The unemployment rate is the % of the labor force that is unemployed.
Is person working?Is person working?
YesYes
The unemployment rate in August 2008 was 6.5 percent:Unemployment rate = 10,080/(10,080+144,958) = 0.065 = 6.5 percent
Employed 144,958
Employed 144,958
Is person looking and available for
work?
Is person looking and available for
work?
Unemployed 10,080
Unemployed 10,080
Not inlabor force
79,038
Not inlabor force
79,038
NoNo
YesYes
NoNo

3.2 Types of Unemployment
• The natural level of employment is the employment level at which the quantity of labor demanded equals the quantity supplied.
• The natural rate of unemployment is the rate of unemployment consistent with the natural level of employment.
• Frictional unemployment occurs because it takes time for employers and workers to find each other.
• Structural unemployment results from a mismatch between worker qualifications and the characteristics employers require.
• Cyclical unemployment is the excess of the unemployment that exists at the natural level of employment.

we
Le
S1
D1
The Natural Level of Employment
Natural Level of Employment
Natural Level of Employment

Unemployment Rate,1960-2008