1. galaxyintegratedlightmodels 1.1 ...jlc/ay219_spring2010/galaxy_integrated... · the lick indices...
TRANSCRIPT

– 1 –
1. Galaxy Integrated Light Models
1.1. Models of Integrated Light of Galaxies
Models of galactic evolution including chemical evolution can be used to predict the
continuous spectrum and absorption lines from the stellar population, and emission lines
from the gaseous ISM as a function of assumed star formation history, IMF, age, and,
with less importance (at least for massive galaxies), the time dependence of mass loss via
galactic winds. Inputs also include evolutionary tracks (function of stellar mass, age, and
metallicity, as well as mass loss history), nucleosynthesis yields (ranging from just studying
some total metallicity to following each element individually). See the earlier discussion of
chemical evolution models, both analytical and numerical, as well as the semi-analytical
models which combine these factors with a cosmological hierarchical formation scenario.
The earliest models assumed a single age, single metallicity population. Broad band
colors were the first things attempted as they were easiest to calculate. Only isochrones
and a transformation from Teff , log(g), and metallicity to colors was needed. The
transformations were usually validated using globular cluster stars, as these clusters usually
have constant [Fe/H] and age. These models were applied to GCs and to elliptical galaxies.
A key early paper was Aaronson, Cohen, Mould & Malkan (1978, apj, 223, 824).
The major arguements with early models were how to include the post-He flash stages
of stellar evolution which are generally not included in most isochrones. They were added by
hand, matched to observations of Galactic AGB and HBs. Another problem was the limited
range of [Fe/H] for the Galactic GCs. Calibration at solar and super-solar metallicity is
very difficult as the well studied GCs have [Fe/H] < −0.6 dex; only those buried in the
Galactic bulge, with severe reddening and membership problems, have higher metallicity.
These issues are still of concern if one is interested in relatively new spectral regions which

– 2 –
have not yet been fully explored.
The desire to examine galaxies in more detail, but still without the necessity for
high S/N high quality spectra, led to the definition of systems of relatively narrow-band
indice (FWHM ∼ 30 to 100 A), the most popular of which are known as the Lick indices.
There are about 20 defined indices arising from features between 4000 and 6000 A of
(predominantly) Fe, Mg, CN, CH, and Balmer lines. The key metallicity index is Mgb,
measuring the strength of the Mg triplet at 5170 A. This is among the strongest features in
the optical spectrum longer than 4000 A for late type stars, the others being the G band of
CH at 4300 A and a few Fe I lines.
The first attempts were in papers by Faber and Trager, with early good calibration
efforts by Guy Worthey (1994, AJ, 128, 2826), and see earlier references from that paper.
The Lick indices were a series of bandpasses centered on the obvious strong absorption
features with adjacent “continuum” bandpasses, and so in effect represent an equivalent
width for strong absorption features. This system has a relatively good and reproducible
calibration, and was used extensively by Faber and her grad students, and hence became
popular. The indices are calibrated to a set of standard stars defined in the early papers.
The metallicity dependence was originally calibrated using “response functions” in lieu of
full spectral syntheses. Problems arise because the original calibration was with respect to
observations made with a particular spectrograph in use at the Lick 3-m telescope, and
because the calibration stars do not span the full range of stellar parameters that one might
need to construct the integrated light.
When used for galaxies, corrections as a function of velocity dispersion are required,
because a higher σv smoothes out the spectrum, reducing the apparent strength of a
spectral feature. These are calculated empirically from observations of stars.
The basic concept is to try to find single indices or combinations of a small number

– 3 –
of indices that are sensitive to one of the desired parameters (the age or metallicity
characteristic of a stellar population) with minimal sensitivity to the other parameters. Of
course in real life there are a lot of degeneracies, and determining a unique solution given
less than perfect data...
The next improvement was to add the α/Fe ratio, again a mean for the population.
Since there are Lick indices which are primarily dominated by features of Fe and those
responding primarily to Mg, which is an α element, some combination of indices should do
this. These were initially calibrated using GC stars and some old calculations by Thomas,
Maraston & Bender (2003, MNRAS, 343, 379 ) and independently by Lee & Worthy (2005,
ApJS, 160, 176). But a problem was that the calibration stars do not uniformly cover the
range of α/Fe over the full range of stellar parameters. A better calibration using model
atmospheres and spectral synthesis by Korn, Thomas & Maraston (2005, A&A, 438, 685)
followed. These models were applied to refine the ages of elliptical galaxies deduced from
the Lick indices by Thomas & Maraston (2003, A&A, 401, 429). The metallicities are not
affected much by considering α/Fe as well, but the ages for galaxies and globular clusters
using some α-enhanced models reached as high as 15 Gyr. The problem appears to lie in
the isochrones adopted for the calculations.
The Balmer lines, which have the strongest age sensitivity, are tricky. It was at that
time quite hard to get them right (i.e. the atomic physics that went into calculating the line
profile was not fully developed) as discussed by Thomas, Maraston & Korn (2004, MNRAS,
351, L19). Even today they still give problems; Poole, Worthey, Lee & Serven (2010,
AJ2010, arXiv:0905.2407) discuss the Hβ anonomaly (Hβ is predicted too weak compared
to the observations, which leads to deduced ages come higher than 15 Gyr for many GCs.
They suggest it is not the horizontal branch nor blue straglers (both of which are often
suggested as culprits, as they might contribute extra hot flux in the blue which may not be

– 4 –
included appropriately in the models), but rather flaring M giants which fill in Hβ.
Lee, Worthey, Dotter et al (2009, ApJ, 694, 902) carried this type of exercise to an
(unnecessary) extreme, evaluating the sensitivity of the standard Lick indices to variations
in the abundance of many elements, adjusting one element at a time, synthesizing the
spectrum, then integrating for the indices.
Lick indices are used mostly for extragalactic GCs and occasionally for nearby galaxies.
There are more sophisticated techniques these days, but when you have low S/N spectra,
they are as good as anything else more sophisticated. A recent example is the study of
GCs in NGC 5128, an elliptical galaxy involved in a recent merger, by Woodley, Harris,
Puzia et al, 2009, ApJ, in press (arXiv:0911.0955). These are 3 hour exposures per each
multi-slit field taken with GMOS/Gemini, with a total sample of 176 clusters. Keck could
do somewhat better, but not enough so that Lick indices can be applied much beyond the
local universe. A similar recent study for 232 quiescent galaxies in the Shapley Supercluster
Smith, Lucey & Hudson, (2010, arXiv:0908.2990) uses slightly different indices, but the
same general approach, to characterize the metallicity, luminosity , age, α/Fe relationships.

– 5 –
Fig. 1.— Figs. 1 of Korn, Thomas & Maraston (2005).

– 6 –
Fig. 2.— Figs. 2 of Korn, Thomas & Maraston (2005).

– 7 –
Fig. 3.— The key Lick index Mgb versus the the first ten of the other 20 Lick indices.
Solid lines represent models calculated by Thomas, Maraston & Bender with age fixed at
12 Gyr, constant α/Fe, and for −2.25 < [Z/H ] < 0.7 dex. Three values of α/Fe (0.0, 0.3,
and 0.5 dex) are shown. The dotted lines are SSP models computed earlier by the same
group with a fixed α/Fe. Filled square = globular clusters, open square = Galactic bulge,
small dots = giant elliptical galaxies. This is Fig. 2a of Thomas, Maraston & Bender (2003,
MNRAS, 343, 379).

– 8 –
Fig. 4.— The key Lick index Mgb versus the the last ten of the other 20 Lick indices. See
the caption of the previous figure for details. This is Fig. 2b of Thomas, Maraston & Bender
(2003, MNRAS, 343, 379).

– 9 –
Fig. 5.— Fig. 3a of Korn, Thomas & Maraston (2005).

– 10 –
Fig. 6.— Fig. 3b of Korn, Thomas & Maraston (2005).

– 11 –
Fig. 7.— The key Lick index Mgb divided by the weighted average of selected FeI Lick
indices. The figure shows that the Mgb index depends on both Mg/H (recall that Mg is an
α-element) and on [Fe/H] as well due to the presence of strong Fe I lines within the bandpass
of the Mgb index, with a smaller dependence on age. Fig. 4 of Thomas, Maraston & Bender
(2003, MNRAS, 343, 379).

– 12 –
Fig. 8.— A demonstration that the combination of Lick indices which they define as [MgFe]’
does not depend on α/Fe, but only on Fe/H (and mean age). This is Fig. 7 of Thomas,
Maraston & Bender (2003, MNRAS, 343, 379).

– 13 –
Fig. 9.— The key Lick index Mgb vs <Fe> for SSP models of age 3, 5, 10, and 15 Gyr
and metallicities [Z/H] 0.0, 0.35, and 0.67 dex. The dashed and solid lines include the α-
enhancement only in the absorption lines (dashed lines), or in both that and the stellar
evolutionary tracks used (solid lines). The dotted lines are those for α/Fe at the Solar value.
Grey circles are data for early-type galaxies. This figure, which is Fig. 1 of Thomas &
Maraston (2003, A&A, 401, 429), shows the impact of alpha-enhanced stellar evolutionary
tracks on the determination of ages of elliptical galaxies. Note the degeneracies in key
parameters as indicated by the arrows and overlapping model tracks.

– 14 –
Fig. 10.— The same as the previous figure but now for the key Lick index Mgb versus Hβ.
Fig. 2 of Thomas & Maraston (2003, A&A, 401, 429) showing the impact of alpha-enhanced
stellar evolutionary tracks on the ages of elliptical galaxies

– 15 –
Fig. 11.— Fig. 1 of Thomas, Maraston & Korn (2004, MNRAS, 351, L19) shows the α/Fe
independent index [MgFe]’ vs two indices for each of the Balmer lines Hγ and Hδ to explore
the sensitivity of Balmer line indices to α/Fe. For a fixed age of 12 Gyr, they find find that
Hδ and Hγ are more sensitive to metallicity than Hβ, which should be expected, as they are
bluer, where there are more metallic lines, and the higher Balmer lines are weaker, hence
more easily overcome by the adjacent metallic lines.

– 16 –
Fig. 12.— Fig. 2 of Thomas, Maraston & Korn (2004, MNRAS, 351, L19) shows two
definitions of Lick indices for each of the Balmer lines Hβ and Hγ as functions of the α/Fe
independent index [MgFe]’. Solid lines are α-enhanced; dotted lines have the Solar ratio.
Ages 3, 5, 10 and 15 Gyr, and metallicities [Z/H] of −0.33, 0.0, 0.35, and 0.67 dex are shown.
Filled circles are data for elliptical galaxies. Hβ has the best sensitivity to age of any of the
Lick indices.

– 17 –
Fig. 13.— Fig. 7 of Woodley, Harris, Puzia et al, 2009, ApJ, in press (arXiv:0911.0955)
a study of GCs in the merger galaxy NGC 5128 (red circles), with blue squares denoting
Galactic GCs.. These are diagnostic plots for various combinations of Lick indices. SSP
models are shown for the grid with α/Fe Solar (red lines), except in the lower right panel,
where the Solar ratio, 2x and 3x Solar are shown (green and blue lines). The solid red lines
denote fixed ages, with the lowest line at 15 Gyr and the highest at 1 Gyr. The dashed pink
lines denote various metallicities.

– 18 –
Fig. 14.— Fig. 8 of Woodley, Harris, Puzia et al,2009, ApJ, in press (arXiv:0911.0955) a
study of GCs in the merger galaxy NGC 5128. These are diagnostic plots for Lick indices
sensitive to Ca, C and N features vs the α/Fe-independent metallicity index [MgFe]’.

– 19 –
Fig. 15.— Fig. 10 of Woodley, Harris, Puzia et al, 2009, ApJ, in press (arXiv:0911.0955) a
study of GCs in the merger galaxy NGC 5128.

– 20 –
Fig. 16.— Fig. 12 of Woodley, Harris, Puzia et al, 2009, ApJ, in press (arXiv:0911.0955)
a study of GCs in the merger galaxy NGC 5128. A comparison of the metallicity derived
from the intermediate band colors of GCs in NGC 5128 versus those derived from the SSP
models for Lick indices. Either the uncertainties in the data are larger than expected, or
is the uncertainties in conversion between a measured quantity and a metallicity are larger
than expected.

– 21 –
Fig. 17.— For Teff = 5000 K and log(g) = 2.5 dex model stellar atmospheres, the predicted
spectrum for a Solar abundance and for a Mg-enhanced compsition are divided. The
bandpasses of various broad-band filters in the popular Johnson system are shown. The
strong Mg lines produce the sharp drops between 4500 and 6000 A. This is Fig. 3 of H.C.
Lee, G. Worthey, A.Dotter et al (2009, ApJ, 694, 902)

– 22 –
Fig. 18.— Fig. 4 of H.C. Lee, G. Worthey, A.Dotter et al (2009, ApJ, 694, 902). Similar to
above, but for SSP population with an age of 5 Gyr (thick dark blue line), so the effect seen
in the previous figure is considerably reduced in amplitude. Also here Z is fixed, so as Mg is
enhanced, other heavy elements are reduced. Furthermore, the isochrone effects of changing
the composition are included, changes in Teff , luminosity, and stellar lifetimes. The two
spectra are normalized at 6000 A. The division from the previous figure for a 5000 K model
atmosphere for a single red giant is shown as the thin light blue line.

– 23 –
1.2. The Current Generation of Integrated Light Models
The current state of the art is a full spectral synthesis for each bin in luminosity along
an isochrone, then summing the number of stars in the bin, determined by the IMF and
stellar evolution, x the flux as a function of wavelength for each isochrone in the grid of
parameters being considered (parameters = age, SF history, metallicity, etc). This is a much
more computationally expensive approach as the search has to be over many more potential
models. But with modern computer speeds and storage, it is feasible and returns accurate
results providing the galaxy or GC spectrum has high enough S/N. Variables also include
the IMF, the HB characteristics, etc. There is also the issue of binaries, their frequency,
and their evolution, which most, but not all, calculations of integrated light models ignore.
Almost all calculations are still simple stellar populations (SSP) which assume a single
age and metallicity characterize the stellar population, and almost always assume scaled
Solar abundances. Most models do not attempt to couple the chemical evolution to the
SF history. There are special purpose detailed chemical evolution models for the satellites
of the Milky Way that do this which will be discussed elsewhere, but these galaxies are
close enough that both CMDs and spectra of individual stars are available. Here we are
discussing application to galaxies far beyond the Local Group, for which only integrated
light spectra can be obtained.
Integrated light spectra for galaxies including an assumed small set of star formation
histories characteristic of galaxy types from elliptical to late spirals were generated by
B. Poggianti (see, e.g. Poggianti, 1997, A&A Supplements, 122, 399). She calculated the
broad band colors from U to K for SF histories that represented galaxies from ellipticals to
spirals. These were widely applied to imaging surveys of galaxies in the field and in clusters.
The early models of Vazdekis (1999, Astrophys. Space Sci., 276, 921) were also widely used.
Today there are large online libraries of flux-calibrated observed stellar spectra at

– 24 –
varying dispersions (see, for example, the ELODIE library, http://atlas.obs-hp.fr/elodie,
Moultaka, Ilovaisky, Prugniel & Soubiran, 2004, PASP, 116, 693) or the MILES library
(Medium Res. Isaac Newton Telescope Library of Empirical Spectra, see Sanchez-Blazquez,
Peletier, Jimenez-Vicente et al, 2006, MNRAS, 371, 703).
Libraries of stellar spectra synthesized from grids of stellar model atmospheres are also
available online, see, e.g. Munari, Sodro, Castelli & Zwitter, 2005, A&A, 442, 1127, which
were generated from the Kurucz model atmospheres and line lists. These can be used to fill
in the observed spectral libraries if a particular region of stellar parameters is missing.
Calculations of evolutionary tracks and isochrones are also easily available online. In
the US, the Yale-Yonsei tracks and isochrones (Yi et al 2001, ApJS, 136, 417) and more
recent improved versions are popular. These are more current versions of the old Yale tracks
calculated by Pierre Demarque and collaborators. Their most recent effort (Demarque et
al, 2008, arXiv:0801.0451) presents a tool for calculating synthestic CMDs for SSPs from
their isochrone grid. The Teramo isochrones were first presented in the paper A large stellar
evolution database for population synthesis studies. II. Stellar models and isochrones for an
alpha-enhanced metal distribution, by A. Pietrinferni (INAF-OA Teramo), S. Cassisi (INAF-
OA Teramo), M. Salaris (J. Moores Univ, Liverpool), F. Castelli, (INAF-OA Trieste) (2004,
ApJ, 612, 168), They are available online at http://www.te.astro.it/BASTI/index.php.
A subsequent paper gives isochrones for the special case of C, N, O, and Na abundance
anti-correlations, which are common in Galactic GCs (Pietrinferni, Cassisi, Salaris, Percival
& Ferguson, 2009, ApJ, 697, 275). The Padua and Geneva tracks are also popular,
www.iaa.csic.es/ rosa and www.iaa.csic.ed/ mcs/Sed@.
This has made full integration of the spectrum of a stellar population in detail feasible.
For current examples of what is possible see e.g. Evolutionary Stellar Population Synthesis
at High Spectral Resolution: Optical Wavelengths, Coelho, Bruzual, Charlot, Weiss, Barbuy

– 25 –
& Ferguson, (2005, MNRAS, 357, 945). They present SSP models with 0.3 A spectral
resolution (λ/∆λ ∼ 15, 000), covering the wavelength regime 3000 to 7000 A, with ages
from 1 to 17 Gyr and 2x, 1x, 0.5x, and 1/10 Solar metallicity using the Geneva and Padua
tracks. Their next step was to incorporate variations in α/Fe; Coelho, Bruzual, Charlot,
Weiss, Barbuy & Ferguson (2007, MNRAS, 382, 498) present high resolution synthesized
spectra of the integrated light of SSPs for Solar ratios and for α-enhancement of a factor
of 2.5 for three metallicities ([Fe/H] −0.5, 0.0, and +0.2 dex). Both the changes in spectra
features and the changes in evolutionary tracks are properly taken into account in each
case. Of course high quality spectra of galaxies or GCs are necessary to take full advantage
of the additional detail and parameters incorporated in these models.
Poggianti’s current models (see Fritz, Poggianti, Bettoni et al, 2007, A&A, 470, 137)
handle both emission and absorption line spectra, i.e. early and late type galaxies.
The most popular of these, at least in the US, for galaxies is the integrated light grid of
calculations by Bruzual & Charlot; see, e.g. Bruzual & Charlot (2003, MNRAS, 344, 1000),
who present a grid of SSP models with spectral resolution 3 A over the wavelength range
from 3200 to 9500 A. An extension to α-enhanced stellar populations is given by Coelho,
Bruzual, Charlot et al (2007, MNRAS, 382, 498). The Bruzual-Charlot grid is popular
because it covers a broad wavelength range at a spectral resolution which is reasonable for
galaxies and is readily available online. Once you have a high spectral resolution grid of
models, it is easy to synthesize various narrow band indices such as the Lick indices.
But any such calculation is only as good as the assumptions made, and recently there
has been a major squabble about the validity of the BC models in the IR. People applied
them without much checking to Spitzer photometry between 4 and 20 µ. It was only after
many papers were published claiming very high masses for high redshift Spitzer galaxies
that C. Maraston realized, from checking her own such models against those of BC, that

– 26 –
the BC models were missing a stellar component that contributes substantial light in the
IR; see Maraston, Daddi, Renzini et al, 2006, ApJ, 652, 85 using Maraston’s 2005 models
(Maraston, 2005, MNRAS, 362, 799). This was tracked down to the fact (now accepted as
a fact by all concerned) that the standard BC models omitted the upper AGB, which is
obviously crucial in the IR as such stars dominate the emitted luminosity there. Some such
models include dust; some can predict the surface brightness fluctuations due to the small
number of luminous stars as a function of disance, and other less common parameters. And,
of course, for work at high redshift, all these results, which are tabulated in the rest frame,
need to be re-integrated over frequency appropriately for comparison with the observations.
Various other grids of SSP spectral synthesis models are popular in Europe. SSP
models incorporating the MILES library of observed stellar spectra are available at
http://www.ucm.es/info/Astrof/miles/models/models.html. The PEGASE grid of models
at a relatively high spectra resolution of 10,000 but calculated over only a narrow wavelength
range (400-680 nm) is also popular in Europe, see Le Borgne, Rocaa-Volmerange, Prugniel...
2004, A&A, 425, 881 (http://www2.iap.fr/pegase/). The latest models of Vazdekis and
collaborators from April 2010 (arXiv:1004.4439) are sure to become popular.
Either SSP (single stellar population, uniform age and metallicity) models or assuming
a limited set of star formation histories and a single metallicity are almost always used when
analyzing spectra of galaxies. Given the quality of the spectra available, it is too hard to
do an unconstrained fit in both of these parameters. It is very easy to mistakenly infer that
a young population must be present if the horizontal branch characteristics, in particular
the blue HB, are not modelled correctly.
Recent advances here are tied to the large programs in Europe in preparation for the
GAIA launch, and to attempts to extend such techniques to near-IR wavelengths.
For more details, see the proceedings of IAU Symposium 241, Stellar Populations as

– 27 –
Building Blocks of Galaxies, ed A. Vazdekis & R. Peletier (2007).
A good example of what is currently possible in terms of the application of such grids
to real observed spectra of galaxies is the analysis of 27 massive ellipticals in 4 very rich
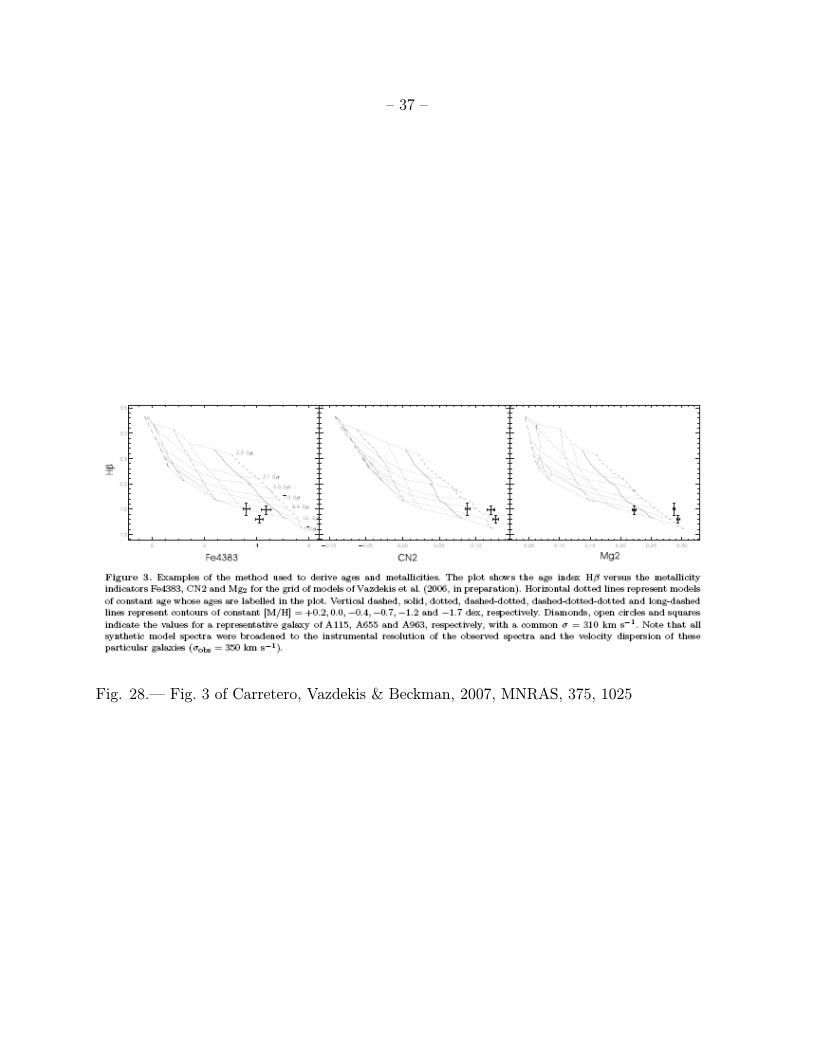
clusters of galaxies at z ∼ 0.2 (Abell 115, 655, 963, and 2111) Carretero, Vazdekis &
Beckman (2007) obtain luminosity weighted ages (i.e. a mean age), [Fe/H], and relative
abundances of CN and Mg, as well as the velocity dispersion, for each galaxy. This is
basically an index measurement on the spectra, calibrated by spectral synthesis integrated
light models. Massive ellipticals are easier than most galaxies, an old SSP is adequate, and
they have higher metallicity, hence stronger lines, than most galaxies.

– 28 –
Fig. 19.— Fig. 4 of Vazdekis, Sanchez-Blazquez etl al (2010). Left panel: Solar metallicity
SSP spectra of various ages, 0.06 to 12.6 Gyr. Right panel: fixed age of 10 Gyr with varying
[Fe/H].

– 29 –
Fig. 20.— Fig. 9 of Bruzual & Charlot (2003).

– 30 –
Fig. 21.— Fig. 10 of Bruzual & Charlot (2003).

– 31 –
Fig. 22.— Model fits (red spectra) of two galaxies from the SDSS (black sp4ectra). The
emissoin lines were removed to perform the fits. The fits were derived using the optimized
data compression algorithm of Heavens, Jimenez & Lahav (2000). (Fig. 11 of Bruzual &
Charlot 2003).
– 32 –
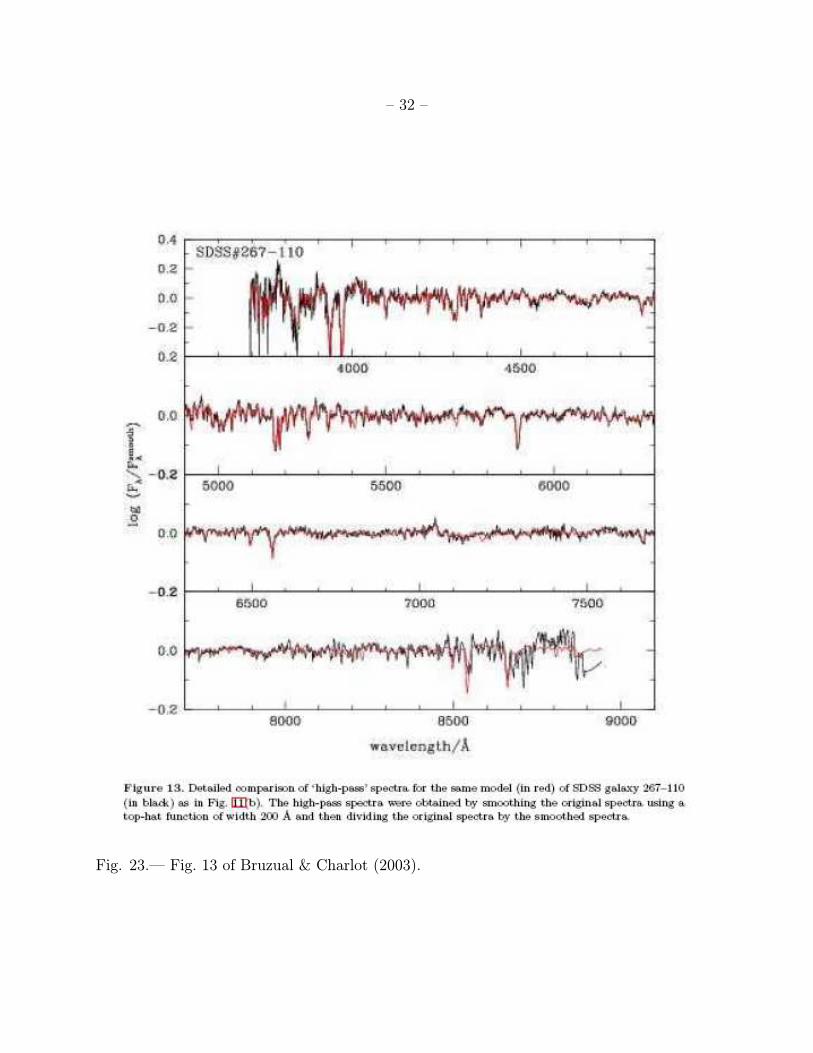
Fig. 23.— Fig. 13 of Bruzual & Charlot (2003).

– 33 –
Fig. 24.— Fig. 14 of Maraston (2005).

– 34 –
Fig. 25.— Fig. 18 of Maraston (2005).

– 35 –
Fig. 26.— Fig. 2 of Gonzalez Delgado & Cid Fernandez (2010, MNRAS, in press,
arXiv:0912.0413) The spectrum of NGC 2210, a cluster in the LMC, compared to the fit
obtained with 7 different SSP evolutionary syntheses. Right panels: observed spectrum
(black), fit (color), and residual spectra X 3. Left panel: probability distribution of t and
Z. The extinction is also fit. Note the relative strength of 3933,3968 H and K lines of Ca II
versus the Balmer lines.

– 36 –
Fig. 27.— Fig. 1 of Gonzalez Delgado & Cid Fernandez (2010, MNRAS, in press,
arXiv:0912.0413) The same for the younger LMC cluster NGC 2010. Here the Balmer lines
dominate.
– 37 –
Fig. 28.— Fig. 3 of Carretero, Vazdekis & Beckman, 2007, MNRAS, 375, 1025

– 38 –
Fig. 29.— Fig. 4 of Carretero, Vazdekis & Beckman (2007), a study of 27 massive elliptical
galaxies in 4 galaxy clusters with z ∼ 0.2. Note how much scatter there is in the derived
abundances, most of which is probably not real.

– 39 –
1.3. Detailed Abundances From Integrated Light Spectra
McWilliam & Bernstein (2008) developed this method of obtaining abundances from
integrated light spectra for GCs, where the characterization of the stellar system as a single
metallicity and age is appropriate. Only a limited range of old stellar systems of uniform
age was explored in the model grid. Colucci, Bernstein, Cameron, McWilliam & Cohen
(2009) applied this technique to HIRES spectra of a small sample of M31 GCs. This can
provide abundances for perhaps 15 elements. But the requirements for high S/N (100/pixel)
and high spectral resolution to utilize this method demanded long exposures for each object
on large telescopes; a 3 hours exposures on the core of 47 Tuc, and several hour exposures
with HIRES at Keck for the M31 GCs). This makes such techniques of limited use.
Relying on somewhat lower spectral dispersion, Evan Kirby has developed techniques
for the analysis of moderate spectra of single stars and applied this to Deimos multi-slit
spectra of satellites of the Milky Way, concentrating on dSph galaxies, which at least have
somewhat constrained SF histories from HST imaging. From this type of data he can derive
[Fe/H], and the ratios of Mg, Si, Ca and Ti (the key α-elements) to Fe for large samples of
stars with modest accuracy.

– 40 –
Fig. 30.— Fig. 5 of McWilliam & Bernstein (2008).

– 41 –
Fig. 31.— Fig. 3 of McWilliam & Bernstein (2008).

– 42 –
Fig. 32.— Fig. 4 of McWilliam & Bernstein (2008).

– 43 –
Fig. 33.— Fig. 8 of Kirby, Guhathakurta, Bolte et al (2010).

– 44 –
Fig. 34.— Fig. 10 of Kirby, Guhathakurta, Bolte et al (2010). Multi-element abundances
from moderate resolution multi-object Deimos/Keck slitmasks in Sculptor (black dots), with
the point sizes smaller when the abundance uncertainties are large. Red points denote
Galactic globular clusters measured in the same way.

– 45 –
Suggested student projects:
Explore the impact of including binaries on integrated light colors and spectra of a simple
stellar population.