1 further topics in supply and demand chapters 5 & 7
TRANSCRIPT

1
Further Topics in Supply and Demand
Chapters 5 & 7
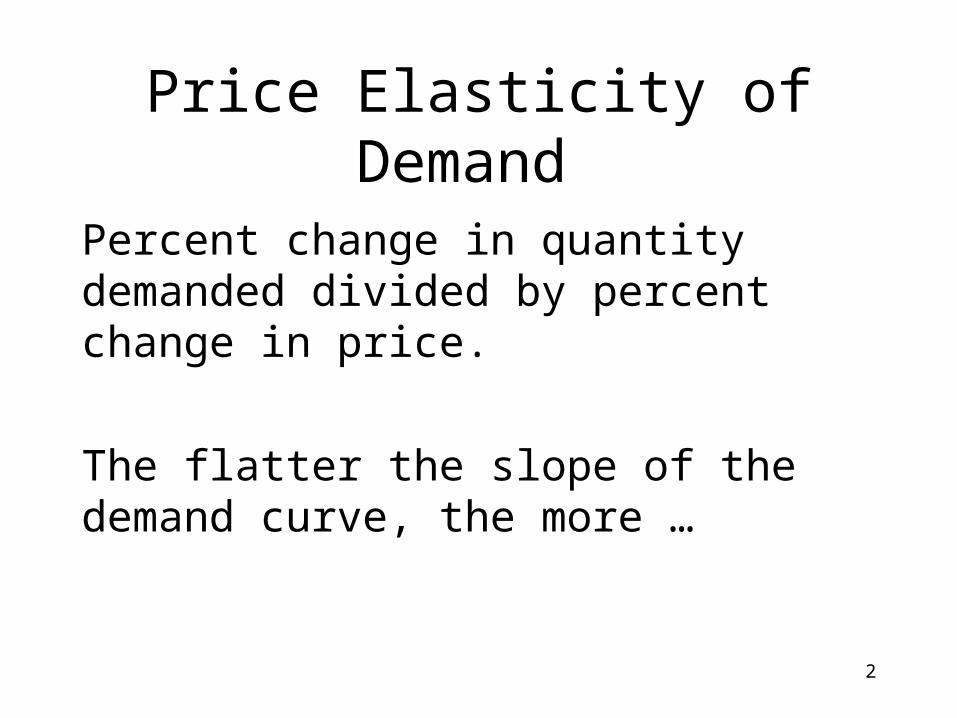
Price Elasticity of Demand
Percent change in quantity demanded divided by percent change in price.
The flatter the slope of the demand curve, the more …
2

Price Elasticity of Supply
Same idea.
3

4
Mid-Point Formula forPrice Elasticity

Figure 1 The Price Elasticity of Demand
Copyright©2003 Southwestern/Thomson Learning
(a) Perfectly Inelastic Demand: Elasticity Equals 0
$5
4
Quantity
Demand
1000
1. Anincreasein price . . .
2. . . . leaves the quantity demanded unchanged.
Price

Figure 1 The Price Elasticity of Demand
(b) Inelastic Demand: Elasticity Is Less Than 1
Quantity0
$5
90
Demand1. A 22%increasein price . . .
Price
2. . . . leads to an 11% decrease in quantity demanded.
4
100

Figure 1 The Price Elasticity of Demand
Copyright©2003 Southwestern/Thomson Learning
2. . . . leads to a 22% decrease in quantity demanded.
(c) Unit Elastic Demand: Elasticity Equals 1
Quantity
4
1000
Price
$5
80
1. A 22%increasein price . . .
Demand

Figure 1 The Price Elasticity of Demand
(d) Elastic Demand: Elasticity Is Greater Than 1
Demand
Quantity
4
1000
Price
$5
50
1. A 22%increasein price . . .
2. . . . leads to a 67% decrease in quantity demanded.

Classification of elasticity measures
Absolute value < 1, INELASTIC
Absoute value > 1, ELASTIC
Absolute value = 1, UNIT ELASTIC
9

10
Computing the Price Elasticity of Demand
Elastic or inelastic?
$5
4Demand
Quantity1000 50
-3percent 22-percent 67
5.00)/2(4.005.00)-(4.00
50)/2(10050)-(100
ED
Price

Factors Affecting Elasticity of Demand
• Availability of close substitutes
• Necessities versus luxuries
• Definition of the market
• Time horizon
11

12

13

14
Revenue
PQ

Figure 2 Total Revenue
Copyright©2003 Southwestern/Thomson Learning
Demand
Quantity
Q
P
0
Price
P × Q = $400(revenue)
$4
100

Figure 3 How Total Revenue Changes When Price Changes: Inelastic Demand
Copyright©2003 Southwestern/Thomson Learning
Demand
Quantity0
Price
Revenue = $100
Quantity0
Price
Revenue = $240
Demand$1
100
$3
80
An Increase in price from $1 to $3 …
… leads to an Increase in total revenue from $100 to $240

Figure 4 How Total Revenue Changes When Price Changes: Elastic Demand
Copyright©2003 Southwestern/Thomson Learning
Demand
Quantity0
Price
Revenue = $200
$4
50
Demand
Quantity0
Price
Revenue = $100
$5
20
An Increase in price from $4 to $5 …
… leads to an decrease in total revenue from $200 to $100

18
Other Elasticity Measures
1. Elasticity of supply

19
Other Elasticity Measures
2. Cross-price elasticity
Negative for complements
Positive for substitutes

20
Other Elasticity Measures
3. Income elasticity

21
Income elasticity
Positive for normal goods
Negative for inferior goods

22
Applications of Elasticity

23
Bumper Crops

24
OPEC & Oil Prices

25
Demand is said to be inelastic if thea. quantity demanded changes proportionately
more than the price.b. quantity demanded changes proportionately
less than the price.c. price changes proportionately more than
income.d. quantity demanded changes proportionately
the same as the price.

26
Consumers, Producers, and the Efficiency of Markets
Chapter 7

27
Economic Welfare
Welfare of buyers: consumer surplus.Welfare of suppliers: producer surplus.What price and quantity in a market
maximizes the sum of the two?That’s the efficient allocation.

28
Consumer Surplus

Table 1 Four Possible Buyers’ Willingness to Pay
Copyright©2004 South-Western

30
The Demand Schedule and the Demand Curve

Figure 1 The Demand Schedule and the Demand Curve
Copyright©2003 Southwestern/Thomson Learning
Price ofAlbum
0 Quantity ofAlbums
Demand
1 2 3 4
$100 John’s willingness to pay
80 Paul’s willingness to pay
70 George’s willingness to pay
50 Ringo’s willingness to pay

Figure 2 Measuring Consumer Surplus with the Demand Curve
Copyright©2003 Southwestern/Thomson Learning
(a) Price = $80
Price ofAlbum
50
70
80
0
$100
Demand
1 2 3 4 Quantity ofAlbums
John’s consumer surplus ($20)

Figure 2 Measuring Consumer Surplus with the Demand Curve
Copyright©2003 Southwestern/Thomson Learning
(b) Price = $70Price of
Album
50
70
80
0
$100
Demand
1 2 3 4
Totalconsumersurplus ($40)
Quantity ofAlbums
John’s consumer surplus ($30)
Paul’s consumersurplus ($10)
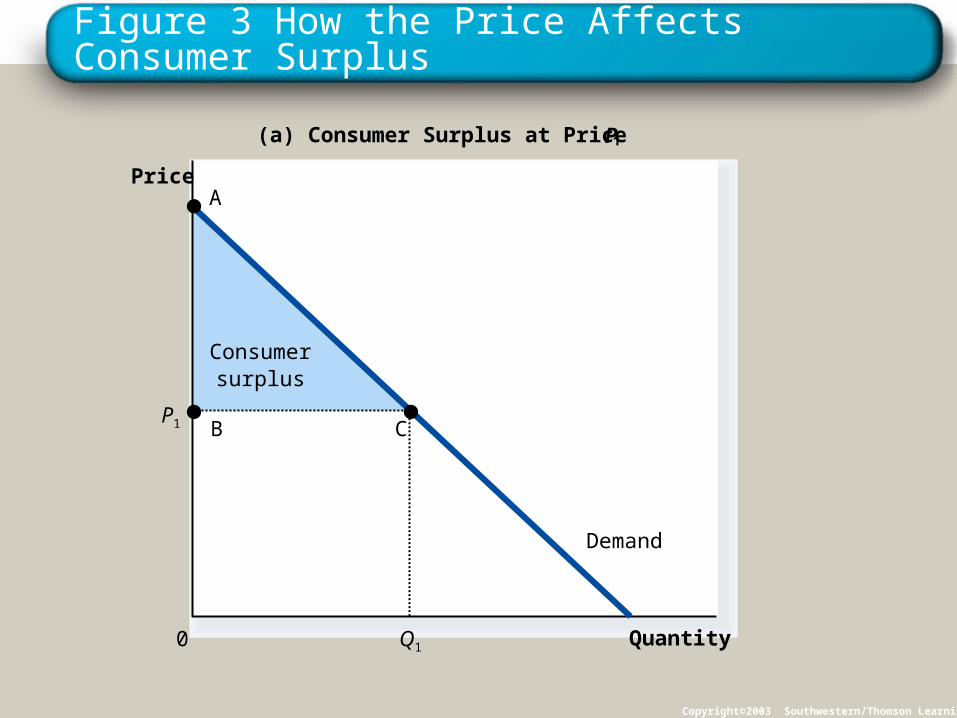
Figure 3 How the Price Affects Consumer Surplus
Copyright©2003 Southwestern/Thomson Learning
Consumersurplus
Quantity
(a) Consumer Surplus at Price P
Price
0
Demand
P1
Q1
B
A
C
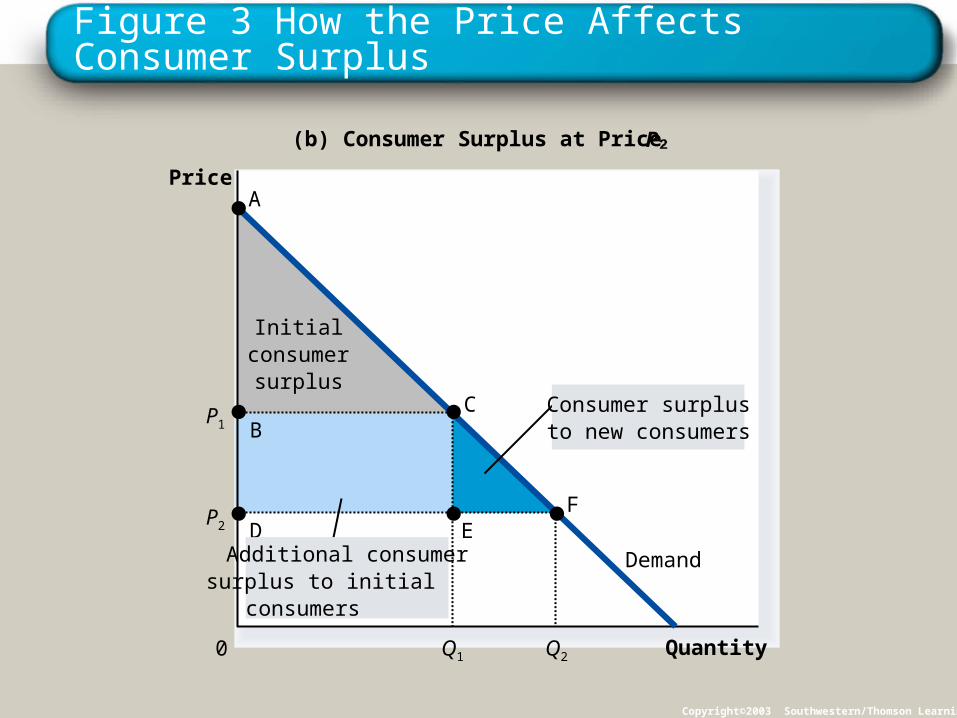
Figure 3 How the Price Affects Consumer Surplus
Copyright©2003 Southwestern/Thomson Learning
Initialconsumer
surplus
Quantity
(b) Consumer Surplus at Price P
Price
0
Demand
A
BC
D EF
P1
Q1
P2
Q2
Consumer surplusto new consumers
Additional consumersurplus to initial consumers
36
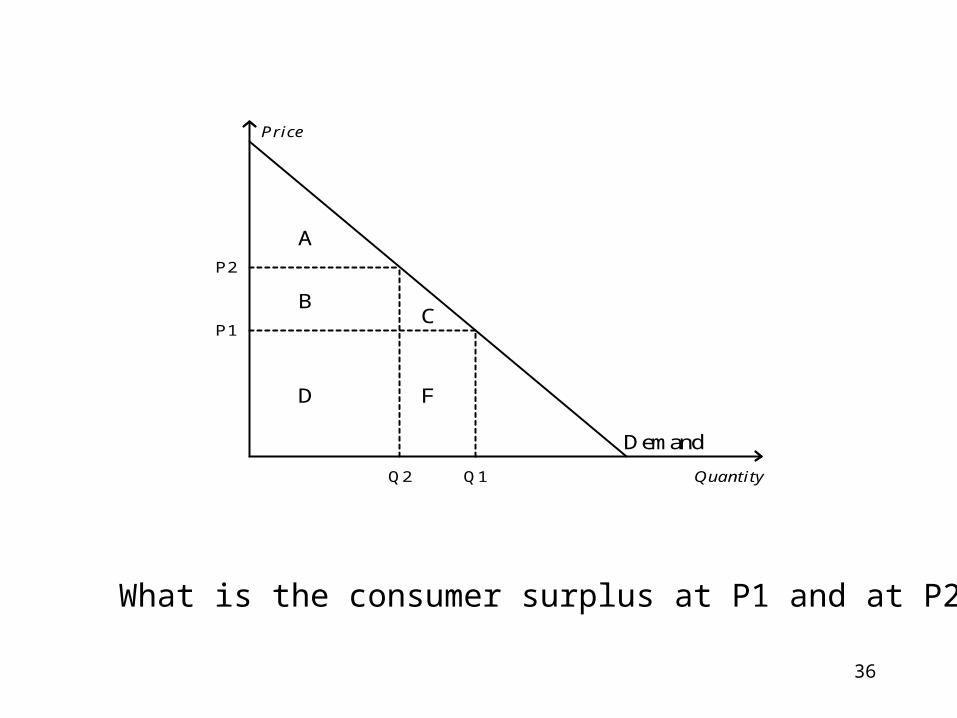
P2
P1
Q2 Q1
Demand
A
BC
D F
Quantity
Price
What is the consumer surplus at P1 and at P2?

37
Producer Surplus

Table 2 The Costs of Four Possible Sellers
Copyright©2004 South-Western

39
The Supply Schedule and the Supply Curve

Figure 4 The Supply Schedule and the Supply Curve

Figure 5 Measuring Producer Surplus with the Supply Curve
Copyright©2003 Southwestern/Thomson Learning
Quantity ofHouses Painted
Price ofHouse
Painting
500
800
$900
0
600
1 2 3 4
(a) Price = $600
Supply
Grandma’s producersurplus ($100)

Figure 5 Measuring Producer Surplus with the Supply Curve
Copyright©2003 Southwestern/Thomson Learning
Quantity ofHouses Painted
Price ofHouse
Painting
500
800
$900
0
600
1 2 3 4
(b) Price = $800
Georgia’s producersurplus ($200)
Totalproducersurplus ($500)
Grandma’s producersurplus ($300)
Supply

Figure 6 How the Price Affects Producer Surplus
Copyright©2003 Southwestern/Thomson Learning
Producersurplus
Quantity
(a) Producer Surplus at Price P
Price
0
Supply
B
A
C
Q1
P1

Figure 6 How the Price Affects Producer Surplus
Copyright©2003 Southwestern/Thomson Learning
Quantity
(b) Producer Surplus at Price P
Price
0
P1B
C
Supply
A
Initialproducersurplus
Q1
P2
Q2
Producer surplusto new producers
Additional producersurplus to initialproducers
D EF

45

46
When the market for a good is in equilibrium,a. consumer surplus will equal producer
surplus.b. the total value created for consumers will
equal the total cost of production for business firms.c. all units valued more highly than the
opportunity cost of production will be supplied.d. all units that have value will be produced,
regardless of their cost of production.

47
Market Efficiency

What happens to CS and PS if price is different from the equilibrium price?
Copyright©2003 Southwestern/Thomson Learning
Producersurplus
Consumersurplus
Price
0 Quantity
Equilibriumprice
Equilibriumquantity
Supply
Demand
A
C
B
D
E

49
Efficiency
The property of resource allocation of maximizing the total surplus received by all members of society.
Total surplus = CS + PS
= (value to buyers – amount paid by buyers)
+ (amount received by sellers – cost to sellers)
= value to buyers – cost to sellers

50
Efficiency Equity

51
If Harry only pays $25,000 to purchase a new car even though he would have been willing to pay as much as $35,000 for the car, this indicates thata.Harry is an irrational consumer.b.The seller earned a $10,000 profit on the sale of the car.c.Harry reaped $10,000 of consumer surplus from thetransaction.d. The seller received $10,000 worth of producer surplus on the transaction.