1 fpi changing mindsets the future of employee benefits given nhi/nss 20 june 2012 presented by...
TRANSCRIPT

1
FPI Changing Mindsets
The Future of Employee Benefits given NHI/NSS
20 June 2012
Presented by
Andre Jacobs, CFP®

2

Public Sector Private sector
Poor service delivery Expensive services
Poor recordkeeping Improved health outcomes
Worsening health outcomes in terms of millennium development goals
8,3 million people covered
Poor governance Members on private medical schemes fund 78% of the public health budget
Wastage Over servicing?•MRI - 10,1 (11/30)•CT Scans - 18,2 (9/30)•C sections -62%
Poor health outcomes Inconsistent pricing
Accounts not paid Protected against setting prices
Systemic monopoly
3
Public and Private Sector

4
NHI – Bird’s Eye View
5
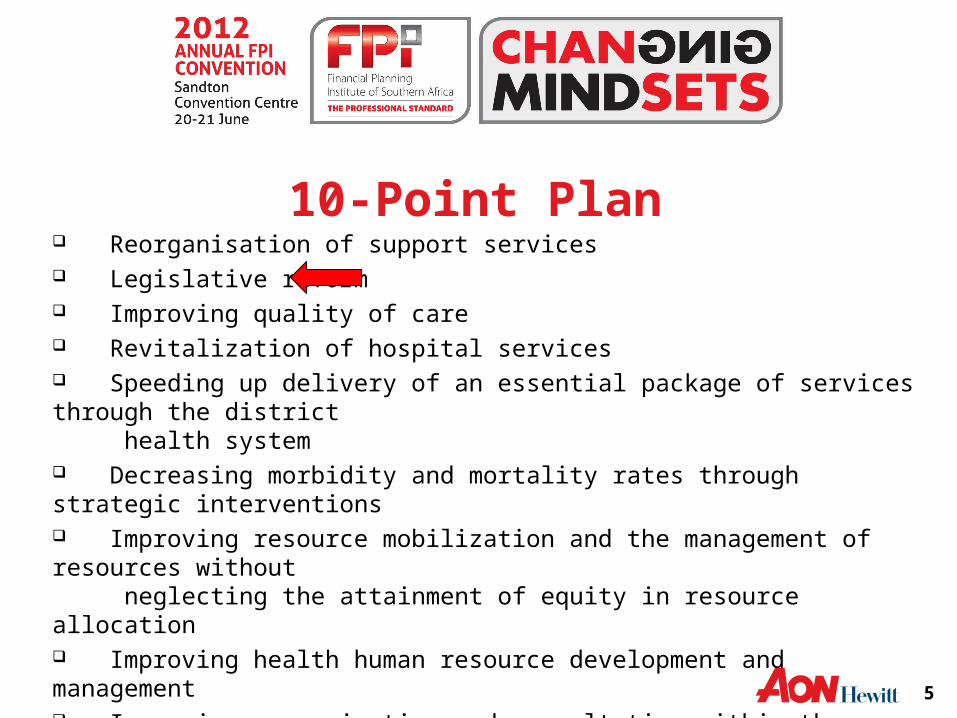
10-Point Plan Reorganisation of support services Legislative reform Improving quality of care Revitalization of hospital services Speeding up delivery of an essential package of services through the district health system Decreasing morbidity and mortality rates through strategic interventions Improving resource mobilization and the management of resources without neglecting the attainment of equity in resource allocation Improving health human resource development and management Improving communication and consultation within the health system and between the health system and communities we serve Strengthening co-operation with our partners internationally

6
NHI – Paradigm Shift
7
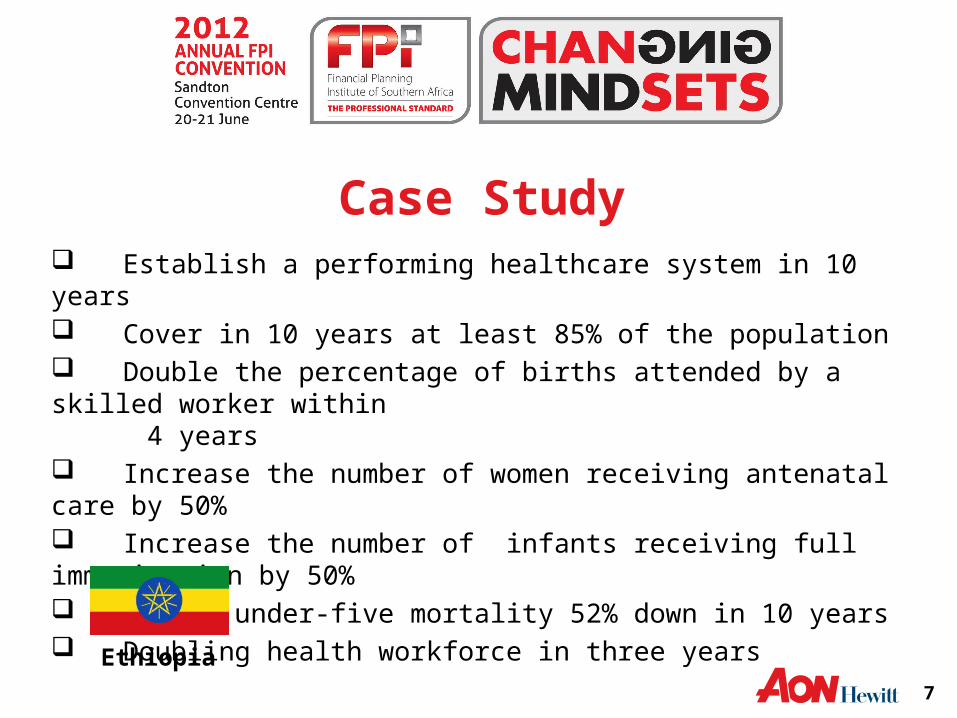
Case Study Establish a performing healthcare system in 10 years Cover in 10 years at least 85% of the population Double the percentage of births attended by a skilled worker within 4 years Increase the number of women receiving antenatal care by 50% Increase the number of infants receiving full immunisation by 50% Reduce under-five mortality 52% down in 10 years Doubling health workforce in three years
Ethiopia
8
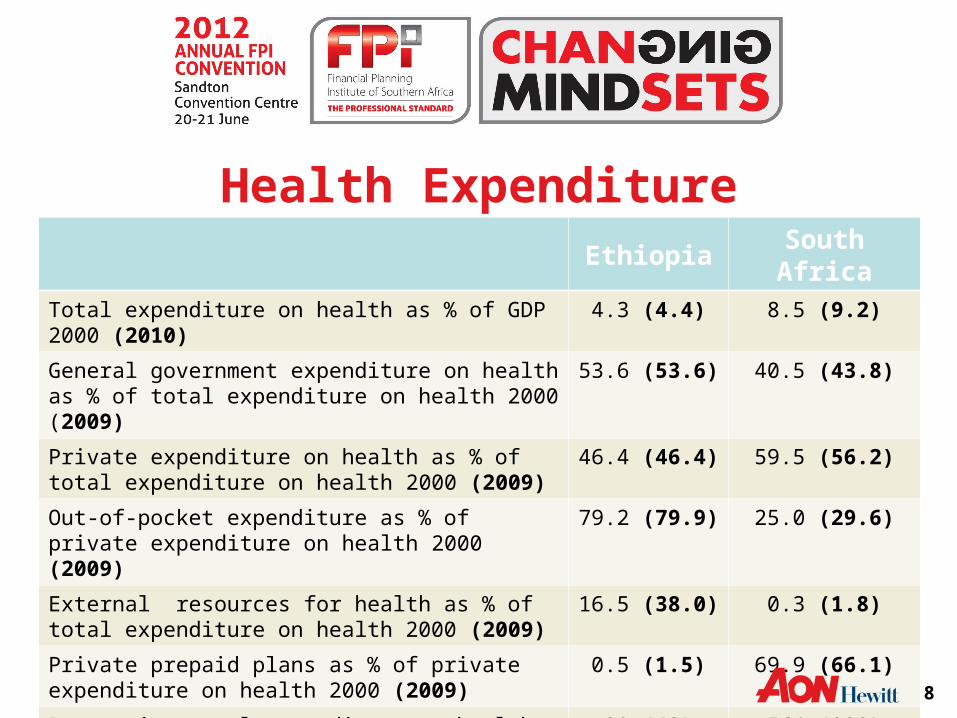
Ethiopia South AfricaTotal expenditure on health as % of GDP 2000 (2010) 4.3 (4.4) 8.5 (9.2)
General government expenditure on health as % of total expenditure on health 2000 (2009)
53.6 (53.6) 40.5 (43.8)
Private expenditure on health as % of total expenditure on health 2000 (2009)
46.4 (46.4) 59.5 (56.2)
Out-of-pocket expenditure as % of private expenditure on health 2000 (2009)
79.2 (79.9) 25.0 (29.6)
External resources for health as % of total expenditure on health 2000 (2009)
16.5 (38.0) 0.3 (1.8)
Private prepaid plans as % of private expenditure on health 2000 (2009)
0.5 (1.5) 69.9 (66.1)
Per capita total expenditure on health (PPP int.$) 2000 (2009)
20 (42) 564 (930)
Health Expenditure
9
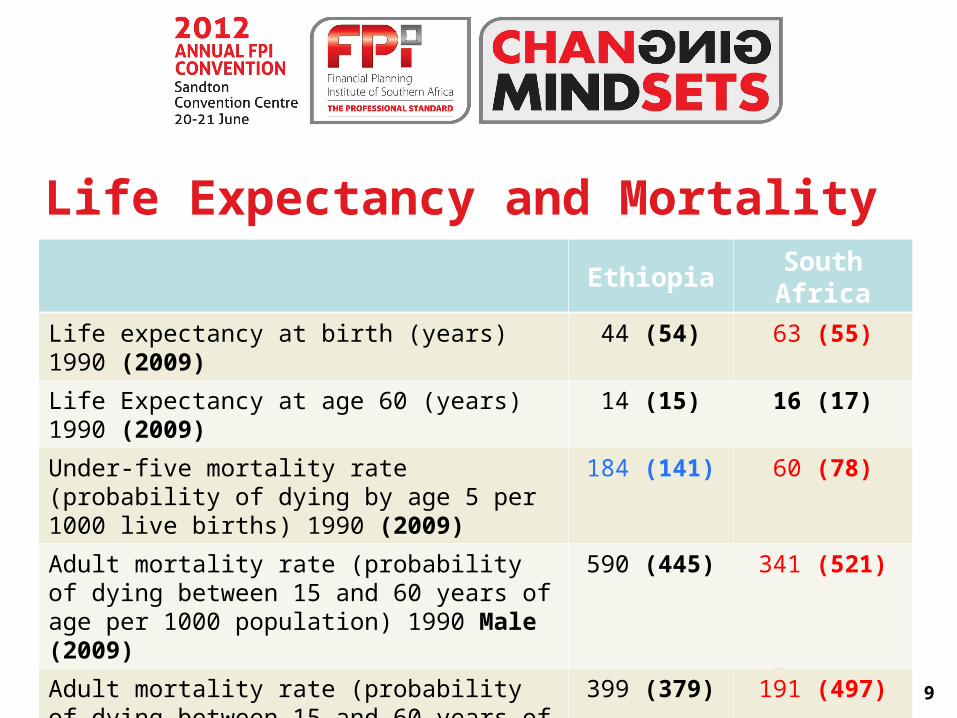
Life Expectancy and MortalityEthiopia South Africa
Life expectancy at birth (years) 1990 (2009) 44 (54) 63 (55)
Life Expectancy at age 60 (years) 1990 (2009) 14 (15) 16 (17)
Under-five mortality rate (probability of dying by age 5 per 1000 live births) 1990 (2009)
184 (141) 60 (78)
Adult mortality rate (probability of dying between 15 and 60 years of age per 1000 population) 1990 Male (2009)
590 (445) 341 (521)
Adult mortality rate (probability of dying between 15 and 60 years of age per 1000 population) 1990 Female (2009)
399 (379) 191 (497)