1 form 10-k standex international corporation
TRANSCRIPT
1
UNITED STATES
SECURITIES AND EXCHANGE COMMISSION
Washington, D.C. 20549
FORM 10-K
ANNUAL REPORT PURSUANT TO SECTION 13 OR 15(d)
OF THE SECURITIES EXCHANGE ACT OF 1934
For the fiscal year ended June 30, 2015 Commission File Number 1-7233
STANDEX INTERNATIONAL CORPORATION (Exact name of registrant as specified in its Charter)
DELAWARE 31-0596149
(State of incorporation) (I.R.S. Employer Identification No.)
11 KEEWAYDIN DRIVE, SALEM, NEW HAMPSHIRE 03079
(Address of principal executive offices) (Zip Code)
(603) 893-9701
(Registrant’s telephone number, including area code)
SECURITIES REGISTERED PURSUANT TO SECTION 12(b) OF THE
SECURITIES EXCHANGE ACT OF 1934:
Title of Each Class Name of Each Exchange on Which Registered
Common Stock, Par Value $1.50 Per Share New York Stock Exchange
Indicate by check mark if the Registrant is a well-known seasoned issuer, as defined in Rule 405 of the Securities Act. YES [ ] NO [X]
Indicate by check mark if the Registrant is not required to file reports pursuant to Section 13 or Section 15(d) of the Act. YES [ ] NO [X]
Indicate by check mark whether the Registrant (1) has filed all reports required to be filed by Section 13 or 15(d) of the Securities Exchange
Act of 1934 during the preceding 12 months (or for such shorter period that the Registrant was required to file such reports), and (2) has
been subject to such filing requirements for the past 90 days. YES [X] NO [ ]
Indicate by check mark whether the registrant has submitted electronically and posted on its corporate website, if any, every Interactive Data
File required to be submitted and posted pursuant to Rule 405 of Regulation S-T (§ 232.405 of this chapter) during the preceding 12 months
(or for such shorter period that the registrant was required to submit and post such files). YES [X] NO [ ]
Indicate by check mark if disclosure of delinquent filers pursuant to Item 405 of Regulation S-K is not contained herein and will not be
contained, to the best of Registrant's knowledge, in definitive proxy or information statements incorporated by reference in Part III of this
Form 10-K or any amendment to this Form 10-K. [ ]
Indicate by check mark whether the Registrant is a large accelerated filer, an accelerated filer, a non-accelerated filer, or a smaller reporting
company. See definition of “large accelerated filer,” “accelerated filer” and “smaller reporting company” in Rule 12b-2 of the Exchange
Act. (Check one):
Large accelerated filer X Accelerated filer Non-accelerated filer __ Smaller Reporting Company __
Indicate by check mark whether the Registrant is a shell company (as defined in Rule 12b-2 of the Exchange Act). YES [ ] NO [X]
The aggregate market value of the voting and non-voting common equity held by non-affiliates of the Registrant at the close of business on
December 31, 2014 was approximately $958,496,000. Registrant’s closing price as reported on the New York Stock Exchange for
December 31, 2014 was $77.26 per share.
The number of shares of Registrant's Common Stock outstanding on August 21, 2015 was 12,772,061
DOCUMENTS INCORPORATED BY REFERENCE
Portions of the Proxy Statement for the Registrant’s 2015 Annual Meeting of Stockholders (the “Proxy Statement”) are incorporated by
reference into Part III of this report.
2
Forward Looking Statement
Statements contained in this Annual Report on Form 10-K that are not based on historical facts are "forward-looking
statements" within the meaning of the Private Securities Litigation Reform Act of 1995. Forward-looking statements may be
identified by the use of forward-looking terminology such as “should,” “could,” "may," “will,” “expect," "believe,"
"estimate," "anticipate," ”intends,” "continue," or similar terms or variations of those terms or the negative of those terms.
There are many factors that affect the Company’s business and the results of its operations and may cause the actual results of
operations in future periods to differ materially from those currently expected or desired. These factors include, but are not
limited to material adverse or unforeseen legal judgments, fines, penalties or settlements, conditions in the financial and
banking markets, including fluctuations in exchange rates and the inability to repatriate foreign cash, general and
international recessionary economic conditions, including the impact, length and degree of the current slow growth conditions
on the customers and markets we serve and more specifically conditions in the food service equipment, automotive,
construction, aerospace, energy, transportation and general industrial markets, lower-cost competition, the relative mix of
products which impact margins and operating efficiencies, both domestic and foreign, in certain of our businesses, the impact
of higher raw material and component costs, particularly steel, petroleum based products and refrigeration components, an
inability to realize the expected cost savings from restructuring activities, effective completion of plant consolidations, cost
reduction efforts, restructuring including procurement savings and productivity enhancements, capital management
improvements, strategic capital expenditures, and the implementation of lean enterprise manufacturing techniques, the
inability to achieve the savings expected from the sourcing of raw materials from and diversification efforts in emerging
markets, the inability to attain expected benefits from strategic alliances or acquisitions and the inability to achieve synergies
contemplated by the Company. Other factors that could impact the Company include changes to future pension funding
requirements. In addition, any forward-looking statements represent management's estimates only as of the day made and
should not be relied upon as representing management's estimates as of any subsequent date. While the Company may elect to
update forward-looking statements at some point in the future, the Company and management specifically disclaim any
obligation to do so, even if management's estimates change.
PART I
Item 1. Business
Standex International Corporation (“Standex”, the “Company" or "we" (1)
) was incorporated in 1975 and is the successor of a
corporation organized in 1955. We have paid dividends each quarter since Standex became a public corporation in November
1964.
(1)
References in this Annual Report on Form 10-K to "Standex" or the "Company" or “we,” “our” or “us” shall
mean Standex International Corporation and its subsidiaries.
Unless otherwise noted, references to years are to fiscal years.
We are a leading manufacturer of a variety of products and services for diverse commercial and industrial market segments.
We have 11 operating segments, aggregated and organized for reporting purposes into five segments: Food Service Equipment
Group, Engraving Group, Engineering Technologies Group, Electronics Products Group and Hydraulics Products Group.
Overall management, strategic development and financial control are maintained by the executive staff from our corporate
headquarters located in Salem, New Hampshire.
Our corporate strategy has several primary components.
It is our objective to grow larger and more profitable business units through both organic initiatives and acquisitions.
On an ongoing basis we identify and implement organic growth initiatives such as new product development,
geographic expansion, introduction of products and technologies into new markets and applications and leveraging of
sales synergies between business units, key accounts and strategic sales channel partners. Also, we utilize
strategically aligned or “bolt on” acquisitions to create both sales and cost synergies with our core business platforms
to accelerate their growth and margin improvement. There is a particular focus on identifying and investing in
opportunities that complement our products and will increase the global presence and capabilities of our businesses.
From time to time we have divested businesses that we felt were not strategic or did not meet our growth and return
expectations.
We create “Customer Intimacy” by partnering with our customers in order to develop and deliver custom solutions or
engineered products that provide technology-driven solutions to our customers. This relationship generally provides
us with the ability to sustain sales and profit growth over time and provide superior operating margins to enhance
shareholder returns. Further, we have made a priority in developing new sales channels and leveraging strategic
customer relationships.
We focus on operational excellence through continuous improvement in the cost structure of our businesses and

3
recognize that our businesses are competing in a global economy that requires that we constantly strive to improve our
competitive position. We have deployed a number of management competencies including lean enterprise, the use of
low cost manufacturing facilities in countries such as Mexico, India, and China, the consolidation of manufacturing
facilities to achieve economies of scale and leveraging of fixed infrastructure costs, alternate sourcing to achieve
procurement cost reductions, and capital improvements to increase shop floor productivity, which drives
improvements in the cost structure of our business units.
Our capital allocation strategy is to use cash flow generated from operations to fund the strategic growth programs
above, including acquisitions, dividends, and capital investments for organic growth and cost reductions. We
recognize that cash flow is fundamental in our ability to invest in organic and acquisitive growth for our business units
and return cash to our shareholders in the form of dividends to reflect the measure of quality from the earnings that we
generate over time.
Please visit our website at www.standex.com to learn more about us or to review our most recent SEC filings. The information
on our website is for informational purposes only and is not incorporated into this Annual Report on Form 10-K.
Description of Segments
Food Service Equipment Group
The Food Service Equipment business is comprised of three groups. The Refrigeration Solutions group manufactures walk in
and cabinet coolers and freezers used in commercial food facilities and some industrial, life science and scientific applications.
The Cooking Solutions group manufacturers cooking equipment such as ovens, fryers, warmers and grills used in commercial
food preparation and service. The Specialty Solutions group consists of a specialty pump used in beverage applications and
custom display merchandising.
Our products are used throughout the entire commercial food service process – from storage, to preparation, to cooking and to
display. The equipment that we design and manufacture is utilized in restaurants, convenience stores, quick-service
restaurants, supermarkets, drug stores and institutions such as hotels, hospitals, and both corporate and school cafeterias to
meet the challenges of providing food and beverages that are fresh and appealing while at the same time providing for food
safety, energy efficiency and reliability of the equipment performance. In the scientific markets, our product portfolio is used
for research, testing and storage of pharmaceuticals, reagents, enzymes, plasma, whole blood, bone marrow, viruses, stem cells
DNA and plant samples.
Food Service Equipment products are manufactured in Hudson, WI; New Albany, MS; Nogales, Mexico; Simpsonville, SC;
San Antonio, TX; Belleville, WI; and Mountmellick, Ireland. In addition, we have our culinary demonstration center in Allen,
TX. Our products are sold directly, through dealers, and through industry representatives in the Americas, Europe, Asia and
Middle East.
Our product brands include:
Nor-Lake walk-in coolers and freezers and reach-in and under counter refrigerated cabinets to meet food service and
scientific needs;
Master-Bilt® and Kool Star® refrigerated reach-in and under counter refrigerated cabinets, cases, display units, and walk-
in coolers and freezers;
APW Wyott®, Bakers Pride®, and Tri-Star ovens, char broilers, commercial ranges, griddles, toasters, warmers, roller
grills and countertop merchandisers used in cooking, toasting, warming and merchandising food;
BKI® and Barbecue King® commercial cook and hold units, rotisseries, pressure fryers, ovens and baking equipment;
Ultrafryer® commercial deep fryers for restaurant and commercial installations;
Federal merchandizing display cases for bakery, deli and confectionary products; and
Procon® pump systems used in beverage and industrial fluid handling applications.
We continue to expand this segment through new product introductions and acquisitions.
Engraving Group
The Engraving Group consists of three product lines. Mold-Tech is a world-wide leader in applying textures to molds on
which manufacturers produce a final product with the desired surface textures on molded plastic parts and slush-molded parts.
Mold-Tech serves the global auto industry as well as consumer goods. Rolls plates and machinery is a niche business which
engraves patterns into rolls used to texturize building materials, packaging materials, papers and non-woven fabrics. Innovent
is a specialized supplier of tools and machines used to produce diapers and products which contain absorbent materials
between layers of non-woven fabric.
4
We simplify the supply chain for global Original Equipment Manufacturers, “OEM”, as a single source texture solutions
supplier. We provide texturizing services for the production of automotive components, particularly for interior dashboards
and upholstery, textiles for paper towels and hygiene products, consumer products and cosmetic appearances, construction
applications, various synthetic flooring products, and electronics used in computers, cell phones and printers.
Our worldwide Mold-Tech locations enable us to better serve our customers within key geographic areas on 6 continents
including the United States, Canada, Europe, China, India, Southeast Asia, Korea, Australia, South Africa, and South America.
Our products are primarily sold directly through our global sales network. The Engraving Group serves a number of industries
including automotive, plastics, building products, synthetic materials, converting, textile and paper, computer, housewares,
hygiene product tooling and aerospace industries.
The Engraving Group brands include:
Mold-Tech® which provides design and program management services texturizes molds used in the production of plastic
parts and manufactures nickel shell slush mold tooling.
Mullen® Burst Testers.
Roehlen®, B.F. Perkins®, Eastern Engraving and I R International manufacture machinery, engrave rolls and plates used
in production of textured industrial products.
Innovent is an engineering and manufacturing company delivering innovative product and service solutions to hygiene,
aerospace and other industrial clients around the world.
We are particularly focused on growth through the establishment of new “greenfield” facilities in emerging markets and
development of proprietary digital based process technology. Our extensive worldwide network of 35 manufacturing and
design centers provide uniform engravings to satisfy the needs of our global customers. We expect to continue to strengthen
our market leadership position through continuously expanding the breadth of products and services we provide customers
globally.
Engineering Technologies Group
The Engineering Technologies Group, “ETG”, provides critical engineered parts in all workable metal alloys using various
forming processes. Our competitive advantage is to deliver net and near net formed single-source customized solutions which
requires less input and raw material than traditional processes. The industry defines net and near net forming as the delivery of
parts that can be inserted directly into the production line with no or little surface finishing required. Our precision
manufacturing capabilities include metal spinning, metal forming, press forming, stretch forming, hydroforming, heat treating
and brazing, computer numerical control and electrical discharge machining, high speed milling, and other fabrication services
in all thickness and size ranges for all workable metal alloys.
ETG solutions are in a wide variety of advanced applications, where the utilization of our precision net and near net forming
technologies, combined with our business placement within the manufacturing process to deliver customer components and
assemblies with reduced input weight, part count, and cycle times. These solutions are found in the aviation, defense, energy,
industrial, medical, marine, oil and gas, and manned and unmanned space markets. Our components and assemblies have been
present on most major commercial aviation aircraft engines and nacelles as well as defense and navy nuclear programs. We
provide complex assemblies and formed solutions for the energy and oil and gas OEM’s, MRI machine formed components,
and single piece formed and machined fuel and liquid oxygen tanks and tank domes for commercial and government space
programs.
The group includes our legacy Spincraft units, with locations in North Billerica, Massachusetts, New Berlin, Wisconsin, and
the Spincraft ETG location in Newcastle upon Tyne in the U.K. The latest addition to the group, Enginetics, has plants in
Huber Heights and Eastlake, OH. Our sales are direct with the OEM’s in the particular market, throughout the world, with the
majority of our sales in North America and Europe.
Electronics Products Group
The Electronics Products Group is a manufacturer of custom magnetic sensing and electromechanical components such as:
reed switches, reed relays; fluid level sensors, flow, pressure, proximity, conductive and inductive sensors; electronics
assemblies; and magnetic components such as toroid and planar transformers.
We are a global components solutions provider who designs, engineers, and manufactures innovative electronic components
and sensors to solve our customers’ application needs. Our mission and vision is to be a strategic partner with customers
5
utilizing our innovative capabilities and solutions to solve challenges, and deliver high-quality products. Our components are
small custom or standard parts that play an important role in larger products. Our products are vital to a diverse array of
markets where a component can provide critical system feedback such as on/off, flow, level monitoring, proximity, etc.,
switches and control capabilities, transforming and isolating power safely, and measuring fluid levels. Our end user is
typically an OEM industrial equipment manufacturer. Other end-user markets include, but are not limited to: transportation,
appliances, HVAC, security, military, medical, aerospace, instrumentation, and general industrial/power applications.
Our components are manufactured in plants located in the USA, Mexico, Canada, the UK, Germany and China. We sell and
build relationships globally through our own direct sales force, regional sales managers, commissioned agents, representative
groups, and distribution channels. Our products are sold globally with approximately fifty percent of sales within North
America, forty percent within Europe and the balance in Asia.
Our brand names are Standex Electronics and Standex-Meder Electronics. We continue to expand the business through
organic growth with current customers, new customers, developing new products and technologies, geographic expansion, and
strategic acquisitions.
Hydraulics Products Group
The Hydraulics Products Group is a global manufacturer of mobile hydraulic cylinders including single or double acting
telescopic and piston rod hydraulic cylinders. Additionally we manufacture a specialty pneumatic cylinder and promote
complete wet line kits, which are complete hydraulic systems that include a pump, valves, hose and fittings.
Industries that use our products are construction equipment, refuse, airline support, mining, oil and gas, and other material
handling applications. Our products are utilized by OEMs on vehicles such as dump trucks, dump trailers, bottom dumps,
garbage trucks, container roll off vehicles, hook lift trucks, liquid waste handlers, compactors, balers, airport catering vehicles,
container handling equipment for airlines, lift trucks, yard tractors, and underground mining vehicles.
We manufacture our cylinders in Hayesville, Ohio and Tianjin, China. Our products are sold directly to OEMs, as well as
distributors, dealers, and aftermarket repair outlets primarily in North America with some sales in South America and Asia.
We provide Custom Hoists® branded single and double acting telescopic hydraulic cylinders and single stage, welded type
piston rod hydraulic cylinders for use in the mobile hydraulics industry.
Responsiveness to new opportunities drives continuous top line growth. We leverage our full line of products for the dump
truck and trailer market and deep expertise in their application to expand into new markets, targeting challenging custom
applications. Our flexible design capability and global supply chain enable us to be successful in our expansion efforts. Our
team is dedicated to superior customer service through our technical engineering support and on-time delivery.
Raw Materials
Raw materials and components necessary for the manufacture of our products are generally available from numerous sources.
Generally, we are not dependent on a single source of raw materials and supplies. We do not foresee unavailability of
materials or supplies which would have a significant adverse effect on any of our businesses, nor any of our segments, in the
near term.
Seasonality
We are a diversified business with generally low levels of seasonality, however our fiscal third quarter is typically the period
with the lowest level of sales volume.
Patents and Trademarks
We hold approximately 58 United States patents and patents pending covering processes, methods and devices and
approximately 44 United States trademarks. Many counterparts of these patents have also been registered in various foreign
countries. In addition, we have various foreign registered and common law trademarks.
Due to the diversity of our businesses and the markets served, the loss of any single patent or trademark would not, in our
opinion, materially affect any individual segment.
While we believe that many of our patents are important, we credit our competitive position in our niche markets to customer
intimacy, engineering capabilities, manufacturing techniques and skills, marketing and sales promotions, service and the
6
delivery of quality products.
Customers
Our business is not dependent upon a single customer or a few large customers, the loss of any one of which would not have a
material adverse effect on our operations. No customer accounted for more than 5% of our consolidated revenue in fiscal 2015
or any of the years presented.
Working Capital
Our primary source of working capital is the cash generated from continuing operations. No segments require any special
working capital needs outside of the normal course of business.
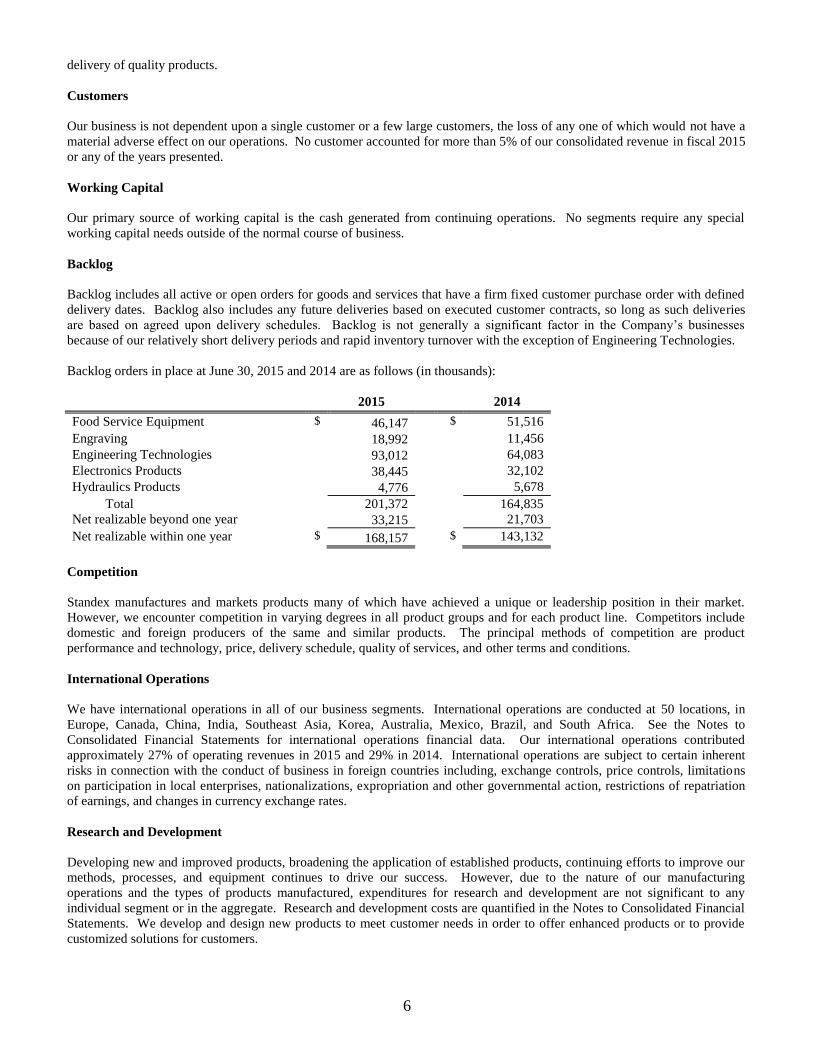
Backlog
Backlog includes all active or open orders for goods and services that have a firm fixed customer purchase order with defined
delivery dates. Backlog also includes any future deliveries based on executed customer contracts, so long as such deliveries
are based on agreed upon delivery schedules. Backlog is not generally a significant factor in the Company’s businesses
because of our relatively short delivery periods and rapid inventory turnover with the exception of Engineering Technologies.
Backlog orders in place at June 30, 2015 and 2014 are as follows (in thousands):
2015 2014
Food Service Equipment $ 46,147 $ 51,516
Engraving 18,992 11,456
Engineering Technologies 93,012 64,083
Electronics Products 38,445 32,102
Hydraulics Products 4,776 5,678
Total 201,372 164,835
Net realizable beyond one year 33,215 21,703
Net realizable within one year $ 168,157 $ 143,132
Competition
Standex manufactures and markets products many of which have achieved a unique or leadership position in their market.
However, we encounter competition in varying degrees in all product groups and for each product line. Competitors include
domestic and foreign producers of the same and similar products. The principal methods of competition are product
performance and technology, price, delivery schedule, quality of services, and other terms and conditions.
International Operations
We have international operations in all of our business segments. International operations are conducted at 50 locations, in
Europe, Canada, China, India, Southeast Asia, Korea, Australia, Mexico, Brazil, and South Africa. See the Notes to
Consolidated Financial Statements for international operations financial data. Our international operations contributed
approximately 27% of operating revenues in 2015 and 29% in 2014. International operations are subject to certain inherent
risks in connection with the conduct of business in foreign countries including, exchange controls, price controls, limitations
on participation in local enterprises, nationalizations, expropriation and other governmental action, restrictions of repatriation
of earnings, and changes in currency exchange rates.
Research and Development
Developing new and improved products, broadening the application of established products, continuing efforts to improve our
methods, processes, and equipment continues to drive our success. However, due to the nature of our manufacturing
operations and the types of products manufactured, expenditures for research and development are not significant to any
individual segment or in the aggregate. Research and development costs are quantified in the Notes to Consolidated Financial
Statements. We develop and design new products to meet customer needs in order to offer enhanced products or to provide
customized solutions for customers.
7
Environmental Matters
Based on our knowledge and current known facts, we believe that we are presently in substantial compliance with all existing
applicable environmental laws and regulations and do not anticipate any instances of non-compliance that will have a material
effect on our future capital expenditures, earnings or competitive position.
Financial Information about Geographic Areas
Information regarding revenues from external customers attributed to the United States, all foreign countries and any
individual foreign country, if material, is contained in the Notes to Consolidated Financial Statements for “Industry Segment
Information.”
Number of Employees
As of June 30, 2015, we employed approximately 5,100 employees of which approximately 2,200 were in the United States.
About 300 of our U.S. employees were represented by unions. Approximately 42% of our production workforce is situated in
low-cost manufacturing regions such as Mexico, Brazil and Asia.
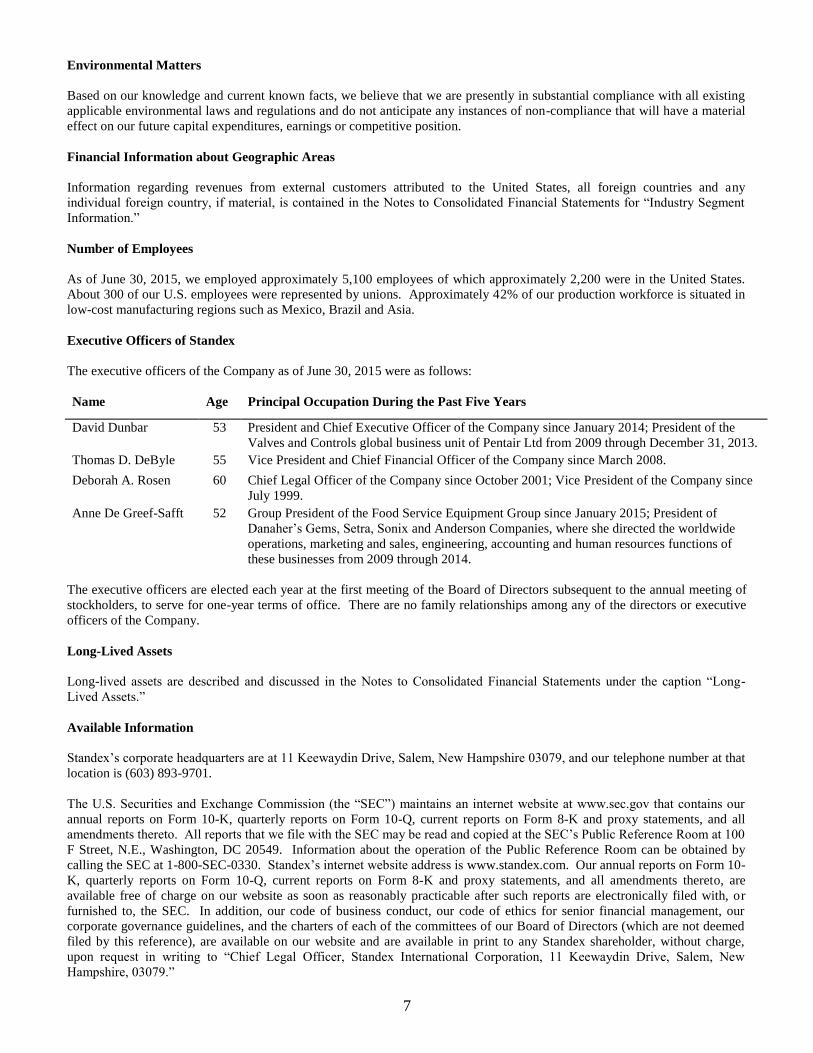
Executive Officers of Standex
The executive officers of the Company as of June 30, 2015 were as follows:
Name Age Principal Occupation During the Past Five Years
David Dunbar 53 President and Chief Executive Officer of the Company since January 2014; President of the
Valves and Controls global business unit of Pentair Ltd from 2009 through December 31, 2013.
Thomas D. DeByle 55 Vice President and Chief Financial Officer of the Company since March 2008.
Deborah A. Rosen 60 Chief Legal Officer of the Company since October 2001; Vice President of the Company since
July 1999.
Anne De Greef-Safft 52 Group President of the Food Service Equipment Group since January 2015; President of
Danaher’s Gems, Setra, Sonix and Anderson Companies, where she directed the worldwide
operations, marketing and sales, engineering, accounting and human resources functions of
these businesses from 2009 through 2014.
The executive officers are elected each year at the first meeting of the Board of Directors subsequent to the annual meeting of
stockholders, to serve for one-year terms of office. There are no family relationships among any of the directors or executive
officers of the Company.
Long-Lived Assets
Long-lived assets are described and discussed in the Notes to Consolidated Financial Statements under the caption “Long-
Lived Assets.”
Available Information
Standex’s corporate headquarters are at 11 Keewaydin Drive, Salem, New Hampshire 03079, and our telephone number at that
location is (603) 893-9701.
The U.S. Securities and Exchange Commission (the “SEC”) maintains an internet website at www.sec.gov that contains our
annual reports on Form 10-K, quarterly reports on Form 10-Q, current reports on Form 8-K and proxy statements, and all
amendments thereto. All reports that we file with the SEC may be read and copied at the SEC’s Public Reference Room at 100
F Street, N.E., Washington, DC 20549. Information about the operation of the Public Reference Room can be obtained by
calling the SEC at 1-800-SEC-0330. Standex’s internet website address is www.standex.com. Our annual reports on Form 10-
K, quarterly reports on Form 10-Q, current reports on Form 8-K and proxy statements, and all amendments thereto, are
available free of charge on our website as soon as reasonably practicable after such reports are electronically filed with, or
furnished to, the SEC. In addition, our code of business conduct, our code of ethics for senior financial management, our
corporate governance guidelines, and the charters of each of the committees of our Board of Directors (which are not deemed
filed by this reference), are available on our website and are available in print to any Standex shareholder, without charge,
upon request in writing to “Chief Legal Officer, Standex International Corporation, 11 Keewaydin Drive, Salem, New
Hampshire, 03079.”
8
The certifications of Standex’s Chief Executive Officer and Chief Financial Officer, as required by the rules adopted pursuant
to Section 302 of the Sarbanes-Oxley Act of 2002, are filed as exhibits to this Form 10-K.
Item 1A. Risk Factors
An investment in the Company’s common shares involves various risks, including those mentioned below and those that are
discussed from time to time in our other periodic filings with the SEC. Investors should carefully consider these risks, along
with the other information filed in this report, before making an investment decision regarding our common shares. All of
these risks could have a material adverse effect on our financial condition, results of operations and/or value of our common
shares.
A deterioration in the domestic and international economic environment could adversely affect our operating results and
financial condition.
Recessionary economic conditions coupled with a tightening of credit could adversely impact major markets served by our
businesses, including cyclical markets such as automotive, heavy construction vehicle, general industrial and food service. An
economic recession could adversely affect our business by:
• reducing demand for our products and services, particularly in markets where demand for our products and services is
cyclical;
• causing delays or cancellations of orders for our products or services;
• reducing capital spending by our customers;
• increasing price competition in our markets;
• increasing difficulty in collecting accounts receivable;
• increasing the risk of excess or obsolete inventories;
• increasing the risk of impairment to long-lived assets due to reduced use of manufacturing facilities;
• increasing the risk of supply interruptions that would be disruptive to our manufacturing processes; and
• reducing the availability of credit for our customers.
We rely on our credit facility to provide us with sufficient capital to operate our businesses.
We rely on our revolving credit facility to provide us with sufficient capital to operate our businesses. The availability of
borrowings under our revolving credit facility is dependent upon our compliance with the covenants set forth in the facility,
including the maintenance of certain financial ratios. Our ability to comply with these covenants is dependent upon our future
performance, which is subject to economic conditions in our markets along with factors that are beyond our control. Violation
of those covenants could result in our lenders restricting or terminating our borrowing ability under our credit facility, cause us
to be liable for covenant waiver fees or other obligations, or trigger an event of default under the terms of our credit facility,
which could result in acceleration of the debt under the facility and require prepayment of the debt before its due date. Even if
new financing is available in the event of a default under our current credit facility, the interest rate charged on any new
borrowing could be substantially higher than under the current credit facility, thus adversely affecting our overall financial
condition. If our lenders reduce or terminate our access to amounts under our credit facility, we may not have sufficient capital
to fund our working capital needs or we may need to secure additional capital or financing to fund our working capital
requirements or to repay outstanding debt under our credit facility.
Our credit facility contains covenants that restrict our activities.
Our revolving credit facility contains covenants that restrict our activities, including our ability to:
• incur additional indebtedness;
• make investments;
• create liens;
• pay cash dividends to shareholders unless we are in compliance with the financial covenants set forth in the credit
facility; and
• sell material assets.
Our global operations subject us to international business risks.
We operate in 50 locations outside of the United States in Europe, Canada, China, India, Singapore, Korea, Australia, Mexico,
Brazil, and South Africa. If we are unable to successfully manage the risks inherent to the operation and expansion of our
global businesses, those risks could have a material adverse effect on our business, results of operations or financial condition.
Those international business risks include:
9
• fluctuations in currency exchange rates;
• restrictions on repatriation of earnings;
• import and export controls;
• political, social and economic instability or disruptions;
• potential adverse tax consequences;
• difficulties in staffing and managing multi-national operations;
• difficulties in our ability to enforce legal rights and remedies; and
• changes in regulatory requirements.
Failure to achieve expected savings and synergies could adversely impact our operating profits and cash flows.
We focus on improving profitability through lean enterprise, low cost sourcing and manufacturing initiatives, improving
working capital management, developing new and enhanced products, consolidating factories where appropriate, automating
manufacturing processes, diversification efforts and completing acquisitions which deliver synergies to supplement sales and
growth. If we were unable to successfully execute these programs, this failure could adversely affect our operating profits and
cash flows. In addition, actions we may take to consolidate manufacturing operations to achieve cost savings or adjust to
market developments may result in restructuring charges that adversely affect our profits.
Violation of anti-bribery or similar laws by our employees, business partners or agents could result in fines, penalties,
damage to our reputation or other adverse consequences.
We cannot assure that our internal controls, code of conduct and training of our employees will provide complete protection
from reckless or criminal acts of our employees, business partners or agents that might violate US or international laws relating
to anti-bribery or similar topics. An action resulting in a violation of these laws could subject us to civil or criminal
investigations that could result in substantial civil or criminal fines and penalties and which could damage our reputation.
We face significant competition in our markets and, if we are not able to respond to competition in our markets, our net
sales, profits and cash flows could decline.
Our businesses operate in highly competitive markets. In order to effectively compete, we must retain long standing
relationships with significant customers, offer attractive pricing, develop enhancements to products that offer performance
features that are superior to our competitors and which maintain our brand recognition, continue to automate our
manufacturing capabilities, continue to grow our business by establishing relationships with new customers, diversify into
emerging markets and penetrate new markets. If we are unable to compete effectively, our net sales, profitability and cash
flows could decline. Pricing pressures resulting from competition may adversely affect our net sales and profitability.
If we are unable to successfully introduce new products and product enhancements, our future growth could be impaired.
Our ability to develop new products and innovations to satisfy customer needs or demands in the markets we serve can affect
our competitive position and often requires significant investment of resources. Difficulties or delays in research, development
or production of new products and services or failure to gain market acceptance of new products and technologies may
significantly reduce future net sales and adversely affect our competitive position.
Increased prices or significant shortages of the commodities that we use in our businesses could result in lower net sales,
profits and cash flows.
We purchase large quantities of steel, refrigeration components, freight services, foam insulation and other metal commodities
for the manufacture of our products. Historically, prices for commodities have fluctuated, and we are unable to enter into long
term contracts or other arrangements to hedge the risk of price increases in many of these commodities. Significant price
increases for these commodities could adversely affect our operating profits if we cannot timely mitigate the price increases by
successfully sourcing lower cost commodities or by passing the increased costs on to customers. Shortages or other
disruptions in the supply of these commodities could delay sales or increase costs.
An inability to identify or complete future acquisitions could adversely affect our future growth.
As part of our growth strategy, we intend to pursue acquisitions that provide opportunities for profitable growth for our
businesses and which enable us to leverage our competitive strengths. While we continue to evaluate potential acquisitions,
we may not be able to identify and successfully negotiate suitable acquisitions, obtain financing for future acquisitions on
satisfactory terms, obtain regulatory approval for certain acquisitions or otherwise complete acquisitions in the future. An
inability to identify or complete future acquisitions could limit our future growth.
10
We may experience difficulties in integrating acquisitions.
Integration of acquired companies involves a number of risks, including:
• inability to operate acquired businesses profitably;
• failure to accomplish strategic objectives for those acquisitions;
• unanticipated costs relating to acquisitions or to the integration of the acquired businesses;
• difficulties in achieving planned cost savings synergies and growth opportunities; and
• possible future impairment charges for goodwill and non-amortizable intangible assets that are recorded as a result of
acquisitions.
Additionally, our level of indebtedness may increase in the future if we finance acquisitions with debt, which would cause us
to incur additional interest expense and could increase our vulnerability to general adverse economic and industry conditions
and limit our ability to service our debt or obtain additional financing. We cannot assure that future acquisitions will not have
a material adverse effect on our financial condition, results of operations and cash flows.
Impairment charges could reduce our profitability.
We test goodwill and our other intangible assets with indefinite useful lives for impairment on an annual basis or on an interim
basis if an event occurs that might reduce the fair value of the reporting unit below its carrying value. Various uncertainties,
including continued adverse conditions in the capital markets or changes in general economic conditions, could impact the
future operating performance at one or more of our businesses which could significantly affect our valuations and could result
in additional future impairments. The recognition of an impairment of a significant portion of goodwill would negatively
affect our results of operations and could be a material effect to us.
Material adverse or unforeseen legal judgments, fines, penalties or settlements could have an adverse impact on our profits
and cash flows.
We are and may, from time to time, become a party to legal proceedings incidental to our businesses, including, but not limited
to, alleged claims relating to product liability, environmental compliance, patent infringement, commercial disputes and
employment matters. In accordance with United States generally accepted accounting principles, we have established reserves
based on our assessment of contingencies. Subsequent developments in legal proceedings may affect our assessment and
estimates of loss contingencies recorded as reserves which could require us to record additional reserves or make material
payments which could adversely affect our profits and cash flows. Even the successful defense of legal proceedings may cause
us to incur substantial legal costs and may divert management's time and resources away from our businesses.
The costs of complying with existing or future environmental regulations, and of correcting any violations of these
regulations, could increase our expenses and reduce our profitability.
We are subject to a variety of environmental laws relating to the storage, discharge, handling, emission, generation, use and
disposal of chemicals, hazardous waste and other toxic and hazardous materials used to manufacture, or resulting from the
process of manufacturing, our products. We cannot predict the nature, scope or effect of regulatory requirements to which our
operations might be subject or the manner in which existing or future laws will be administered or interpreted. We are also
exposed to potential legacy environmental risks relating to businesses we no longer own or operate. Future regulations could
be applied to materials, products or activities that have not been subject to regulation previously. The costs of complying with
new or more stringent regulations, or with more vigorous enforcement of these or existing regulations, could be significant.
In addition, properly permitted waste disposal facilities used by us as a legal and legitimate repository for hazardous waste may
in the future become mismanaged or abandoned without our knowledge or involvement. In such event, legacy landfill liability
could attach to or be imposed upon us in proportion to the waste deposited at any disposal facility.
Environmental laws require us to maintain and comply with a number of permits, authorizations and approvals and to maintain
and update training programs and safety data regarding materials used in our processes. Violations of these requirements
could result in financial penalties and other enforcement actions. We could be required to halt one or more portions of our
operations until a violation is cured. Although we attempt to operate in compliance with these environmental laws, we may
not succeed in this effort at all times. The costs of curing violations or resolving enforcement actions that might be initiated by
government authorities could be substantial.
Strategic divestitures could negatively affect our results and contingent liabilities from businesses that we have sold could
adversely affect our results of operations and financial condition.
11
We have retained responsibility for some of the known and unknown contingent liabilities related to a number of businesses
we have sold, such as lawsuits, tax liabilities, product liability claims, and environmental matters and have agreed to indemnify
purchasers of these businesses for certain of those contingent liabilities.
The trading price of our common stock has been volatile, and investors in our common stock may experience substantial
losses.
The trading price of our common stock has been volatile and may become volatile again in the future. The trading price of our
common stock could decline or fluctuate in response to a variety of factors, including:
• our failure to meet the performance estimates of securities analysts;
• changes in financial estimates of our net sales and operating results or buy/sell recommendations by securities analysts;
• fluctuations in our quarterly operating results;
• substantial sales of our common stock;
• changes in the amount or frequency of our payment of dividends or repurchases of our common stock;
• general stock market conditions; or
• other economic or external factors.
Decreases in discount rates and actual rates of return could require future pension contributions to our pension plans
which could limit our flexibility in managing our Company.
Key assumptions inherent in our actuarially calculated pension plan obligations and pension plan expense are the discount rate
and the expected rate of return on plan assets. If discount rates and actual rates of return on invested plan assets were to
decrease significantly, our pension plan obligations could increase materially. The size of future required pension
contributions could require us to dedicate a greater portion of our cash flow from operations to making contributions, which
could negatively impact our financial flexibility.
Our business could be negatively impacted by cybersecurity threats, information systems and network interruptions, and
other security threats or disruptions.
Our information technology networks and related systems are critical to the operation of our business and essential to our
ability to successfully perform day-to-day operations. Cybersecurity threats in particular, are persistent, evolve quickly, and
include, but are not limited to, computer viruses, attempts to access information, denial of service and other electronic security
breaches. These events could disrupt our operations or customers and other third party IT systems in which we are involved
and could negatively impact our reputation among our customers and the public which could have a negative impact on our
financial conditions, results of operations, or liquidity.
Various restrictions in our charter documents, Delaware law and our credit agreement could prevent or delay a change in
control of us that is not supported by our board of directors.
We are subject to a number of provisions in our charter documents, Delaware law and our credit facility that may discourage,
delay or prevent a merger, acquisition or change of control that a stockholder may consider favorable. These anti-takeover
provisions include:
• maintaining a classified board and imposing advance notice procedures for nominations of candidates for election as
directors and for stockholder proposals to be considered at stockholders' meetings;
• a provision in our certificate of incorporation that requires the approval of the holders of 80% of the outstanding shares
of our common stock to adopt any agreement of merger, the sale of substantially all of the assets of Standex to a third
party or the issuance or transfer by Standex of voting securities having a fair market value of $1 million or more to a
third party, if in any such case such third party is the beneficial owner of 10% or more of the outstanding shares of our
common stock, unless the transaction has been approved prior to its consummation by all of our directors;
• requiring the affirmative vote of the holders of at least 80% of the outstanding shares of our common stock for
stockholders to amend our amended and restated by-laws;
• covenants in our credit facility restricting mergers, asset sales and similar transactions; and
• the Delaware anti-takeover statute contained in Section 203 of the Delaware General Corporation Law.
Section 203 of the Delaware General Corporation Law prohibits a merger, consolidation, asset sale or other similar business
combination between Standex and any stockholder of 15% or more of our voting stock for a period of three years after the
stockholder acquires 15% or more of our voting stock, unless (1) the transaction is approved by our board of directors before
the stockholder acquires 15% or more of our voting stock, (2) upon completing the transaction the stockholder owns at least
12
85% of our voting stock outstanding at the commencement of the transaction, or (3) the transaction is approved by our board of
directors and the holders of 66 2/3% of our voting stock, excluding shares of our voting stock owned by the stockholder.
Item 1B. Unresolved Staff Comments
None.
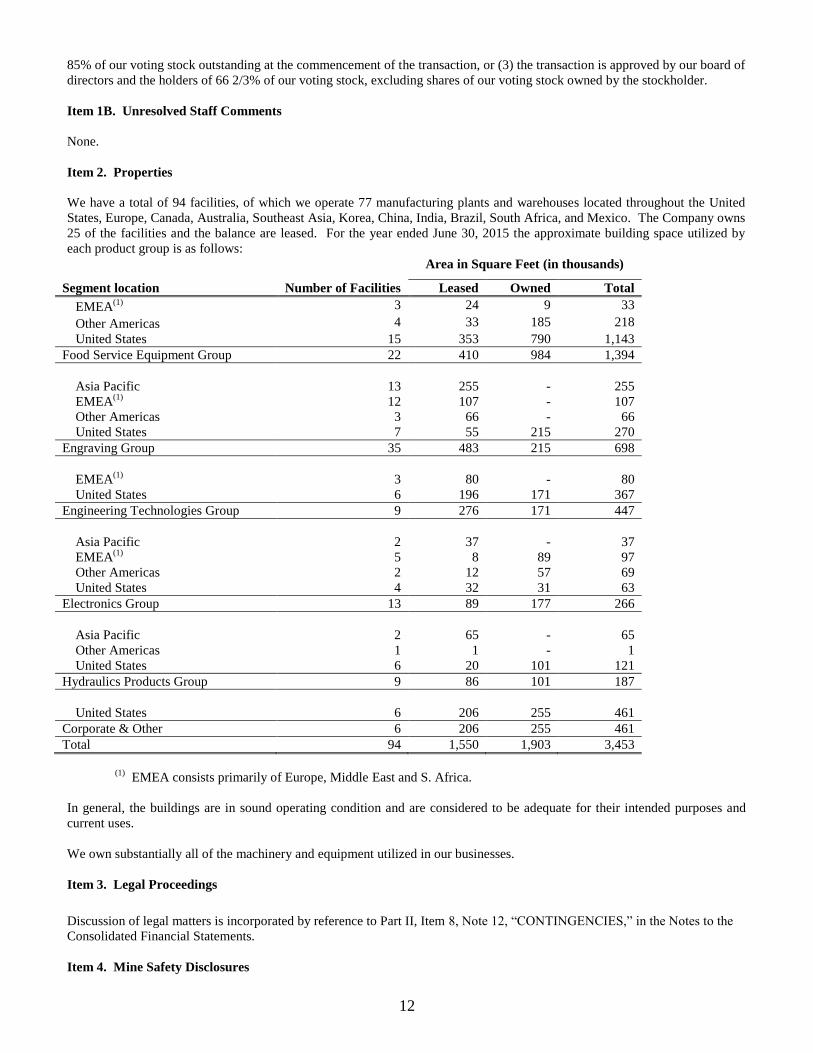
Item 2. Properties
We have a total of 94 facilities, of which we operate 77 manufacturing plants and warehouses located throughout the United
States, Europe, Canada, Australia, Southeast Asia, Korea, China, India, Brazil, South Africa, and Mexico. The Company owns
25 of the facilities and the balance are leased. For the year ended June 30, 2015 the approximate building space utilized by
each product group is as follows:
Area in Square Feet (in thousands)
Segment location Number of Facilities Leased Owned Total
EMEA(1)
3 24 9 33
Other Americas 4 33 185 218
United States 15 353 790 1,143
Food Service Equipment Group 22 410 984 1,394
Asia Pacific 13 255 - 255
EMEA(1)
12 107 - 107
Other Americas 3 66 - 66
United States 7 55 215 270
Engraving Group 35 483 215 698
EMEA(1)
3 80 - 80
United States 6 196 171 367
Engineering Technologies Group 9 276 171 447
Asia Pacific 2 37 - 37
EMEA(1)
5 8 89 97
Other Americas 2 12 57 69
United States 4 32 31 63
Electronics Group 13 89 177 266
Asia Pacific 2 65 - 65
Other Americas 1 1 - 1
United States 6 20 101 121
Hydraulics Products Group 9 86 101 187
United States 6 206 255 461
Corporate & Other 6 206 255 461
Total 94 1,550 1,903 3,453
(1)
EMEA consists primarily of Europe, Middle East and S. Africa.
In general, the buildings are in sound operating condition and are considered to be adequate for their intended purposes and
current uses.
We own substantially all of the machinery and equipment utilized in our businesses.
Item 3. Legal Proceedings
Discussion of legal matters is incorporated by reference to Part II, Item 8, Note 12, “CONTINGENCIES,” in the Notes to the
Consolidated Financial Statements.
Item 4. Mine Safety Disclosures
13
Not Applicable
PART II
Item 5. Market for Standex Common Stock
Related Stockholder Matters and Issuer Purchases of Equity Securities
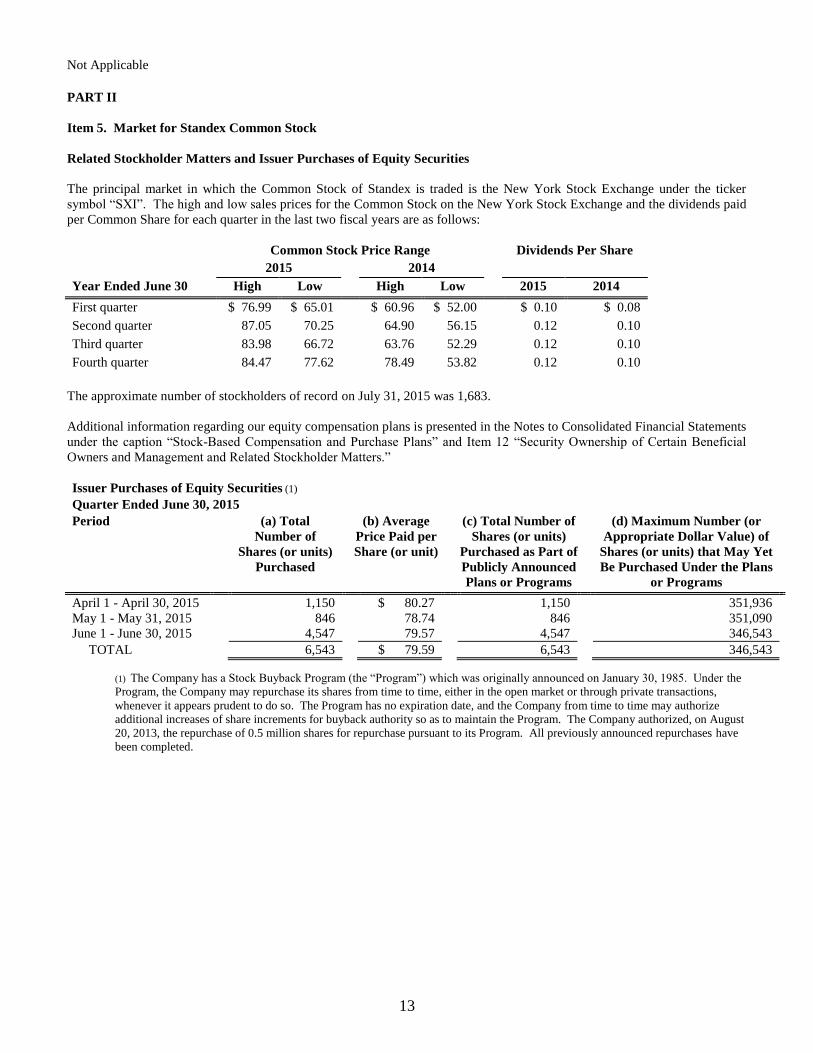
The principal market in which the Common Stock of Standex is traded is the New York Stock Exchange under the ticker
symbol “SXI”. The high and low sales prices for the Common Stock on the New York Stock Exchange and the dividends paid
per Common Share for each quarter in the last two fiscal years are as follows:
Common Stock Price Range Dividends Per Share
2015 2014
Year Ended June 30 High Low High Low 2015 2014
First quarter $ 76.99 $ 65.01 $ 60.96 $ 52.00 $ 0.10 $ 0.08
Second quarter 87.05 70.25 64.90 56.15 0.12 0.10
Third quarter 83.98 66.72 63.76 52.29 0.12 0.10
Fourth quarter 84.47 77.62 78.49 53.82 0.12 0.10
The approximate number of stockholders of record on July 31, 2015 was 1,683.
Additional information regarding our equity compensation plans is presented in the Notes to Consolidated Financial Statements
under the caption “Stock-Based Compensation and Purchase Plans” and Item 12 “Security Ownership of Certain Beneficial
Owners and Management and Related Stockholder Matters.”
Issuer Purchases of Equity Securities (1)
Quarter Ended June 30, 2015
Period (a) Total
Number of
Shares (or units)
Purchased
(b) Average
Price Paid per
Share (or unit)
(c) Total Number of
Shares (or units)
Purchased as Part of
Publicly Announced
Plans or Programs
(d) Maximum Number (or
Appropriate Dollar Value) of
Shares (or units) that May Yet
Be Purchased Under the Plans
or Programs
April 1 - April 30, 2015 1,150 $ 80.27 1,150 351,936
May 1 - May 31, 2015 846 78.74 846 351,090
June 1 - June 30, 2015 4,547 79.57 4,547 346,543
TOTAL 6,543 $ 79.59 6,543 346,543
(1) The Company has a Stock Buyback Program (the “Program”) which was originally announced on January 30, 1985. Under the
Program, the Company may repurchase its shares from time to time, either in the open market or through private transactions,
whenever it appears prudent to do so. The Program has no expiration date, and the Company from time to time may authorize
additional increases of share increments for buyback authority so as to maintain the Program. The Company authorized, on August
20, 2013, the repurchase of 0.5 million shares for repurchase pursuant to its Program. All previously announced repurchases have
been completed.
14
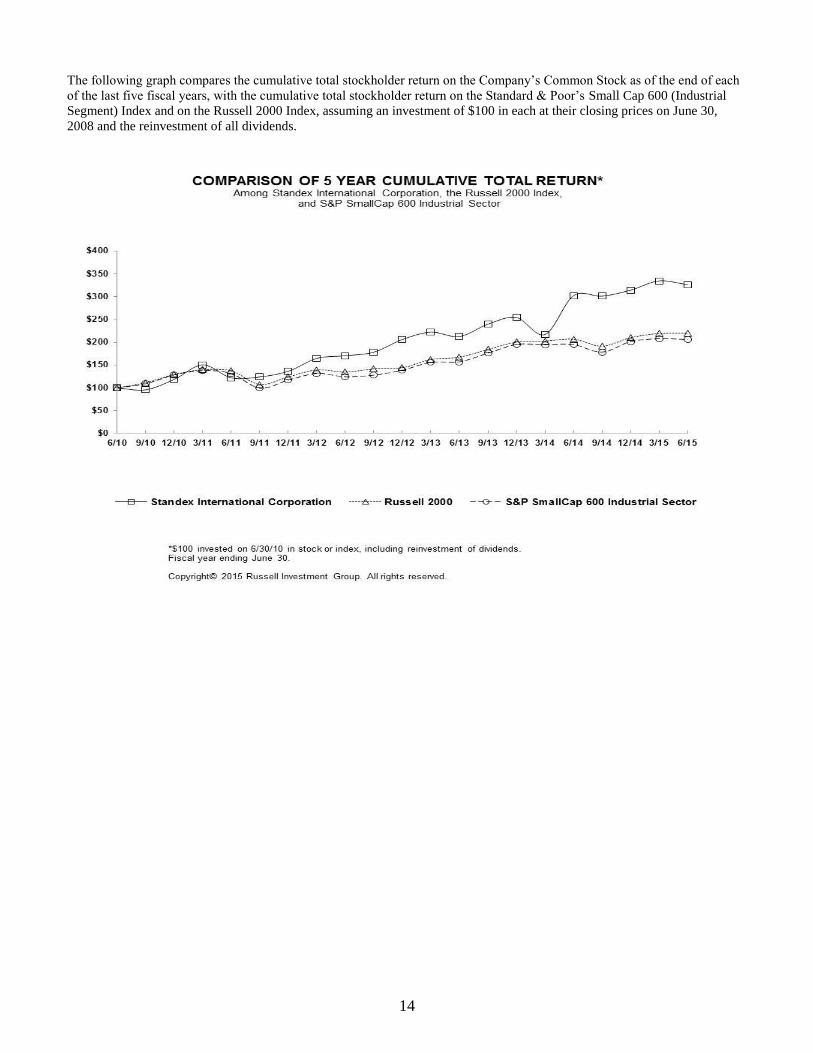
The following graph compares the cumulative total stockholder return on the Company’s Common Stock as of the end of each
of the last five fiscal years, with the cumulative total stockholder return on the Standard & Poor’s Small Cap 600 (Industrial
Segment) Index and on the Russell 2000 Index, assuming an investment of $100 in each at their closing prices on June 30,
2008 and the reinvestment of all dividends.
15
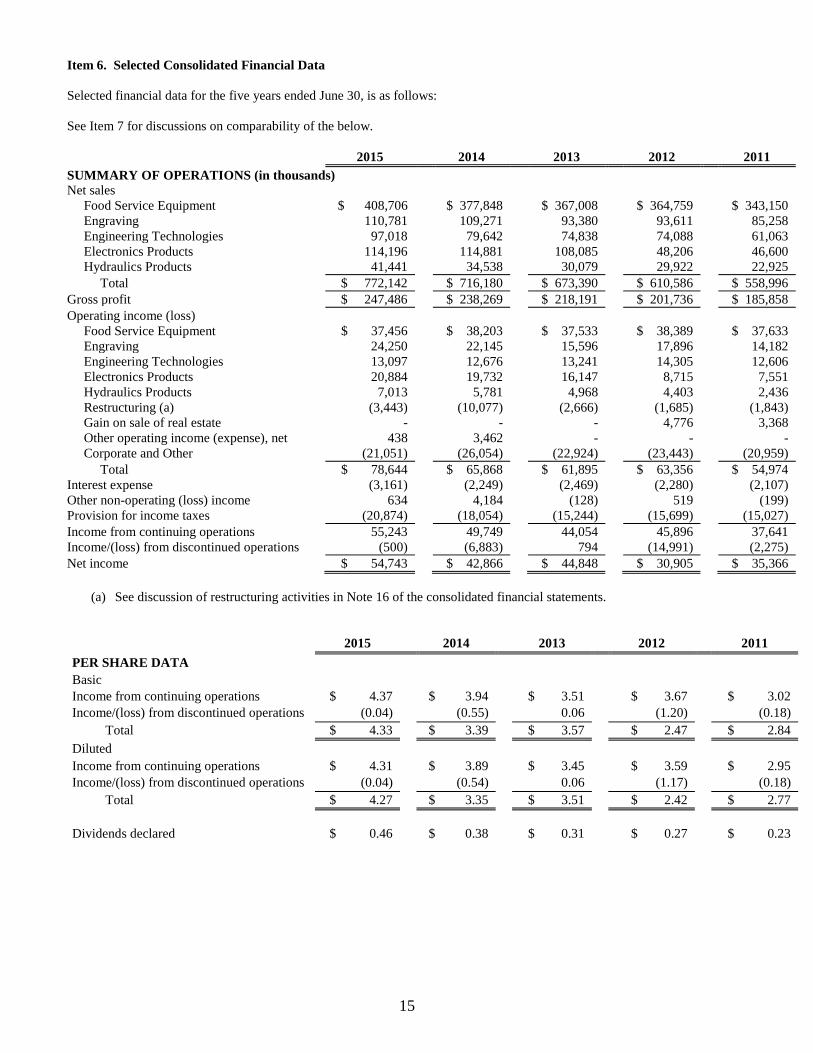
Item 6. Selected Consolidated Financial Data
Selected financial data for the five years ended June 30, is as follows:
See Item 7 for discussions on comparability of the below.
2015 2014 2013 2012 2011
SUMMARY OF OPERATIONS (in thousands)
Net sales
Food Service Equipment $ 408,706 $ 377,848 $ 367,008 $ 364,759 $ 343,150
Engraving 110,781 109,271 93,380 93,611 85,258
Engineering Technologies 97,018 79,642 74,838 74,088 61,063
Electronics Products 114,196 114,881 108,085 48,206 46,600
Hydraulics Products 41,441 34,538 30,079 29,922 22,925
Total $ 772,142 $ 716,180 $ 673,390 $ 610,586 $ 558,996
Gross profit $ 247,486 $ 238,269 $ 218,191 $ 201,736 $ 185,858
Operating income (loss)
Food Service Equipment $ 37,456 $ 38,203 $ 37,533 $ 38,389 $ 37,633
Engraving 24,250 22,145 15,596 17,896 14,182
Engineering Technologies 13,097 12,676 13,241 14,305 12,606
Electronics Products 20,884 19,732 16,147 8,715 7,551
Hydraulics Products 7,013 5,781 4,968 4,403 2,436
Restructuring (a) (3,443) (10,077) (2,666) (1,685) (1,843)
Gain on sale of real estate - - - 4,776 3,368
Other operating income (expense), net 438 3,462 - - -
Corporate and Other (21,051) (26,054) (22,924) (23,443) (20,959)
Total $ 78,644 $ 65,868 $ 61,895 $ 63,356 $ 54,974
Interest expense (3,161) (2,249) (2,469) (2,280) (2,107)
Other non-operating (loss) income 634 4,184 (128) 519 (199)
Provision for income taxes (20,874) (18,054) (15,244) (15,699) (15,027)
Income from continuing operations 55,243 49,749 44,054 45,896 37,641
Income/(loss) from discontinued operations (500) (6,883) 794 (14,991) (2,275)
Net income $ 54,743 $ 42,866 $ 44,848 $ 30,905 $ 35,366
(a) See discussion of restructuring activities in Note 16 of the consolidated financial statements.
2015 2014 2013 2012 2011
PER SHARE DATA
Basic
Income from continuing operations $ 4.37 $ 3.94 $ 3.51 $ 3.67 $ 3.02
Income/(loss) from discontinued operations (0.04) (0.55) 0.06 (1.20) (0.18)
Total $ 4.33 $ 3.39 $ 3.57 $ 2.47 $ 2.84
Diluted
Income from continuing operations $ 4.31 $ 3.89 $ 3.45 $ 3.59 $ 2.95
Income/(loss) from discontinued operations (0.04) (0.54) 0.06 (1.17) (0.18)
Total $ 4.27 $ 3.35 $ 3.51 $ 2.42 $ 2.77
Dividends declared $ 0.46 $ 0.38 $ 0.31 $ 0.27 $ 0.23
16
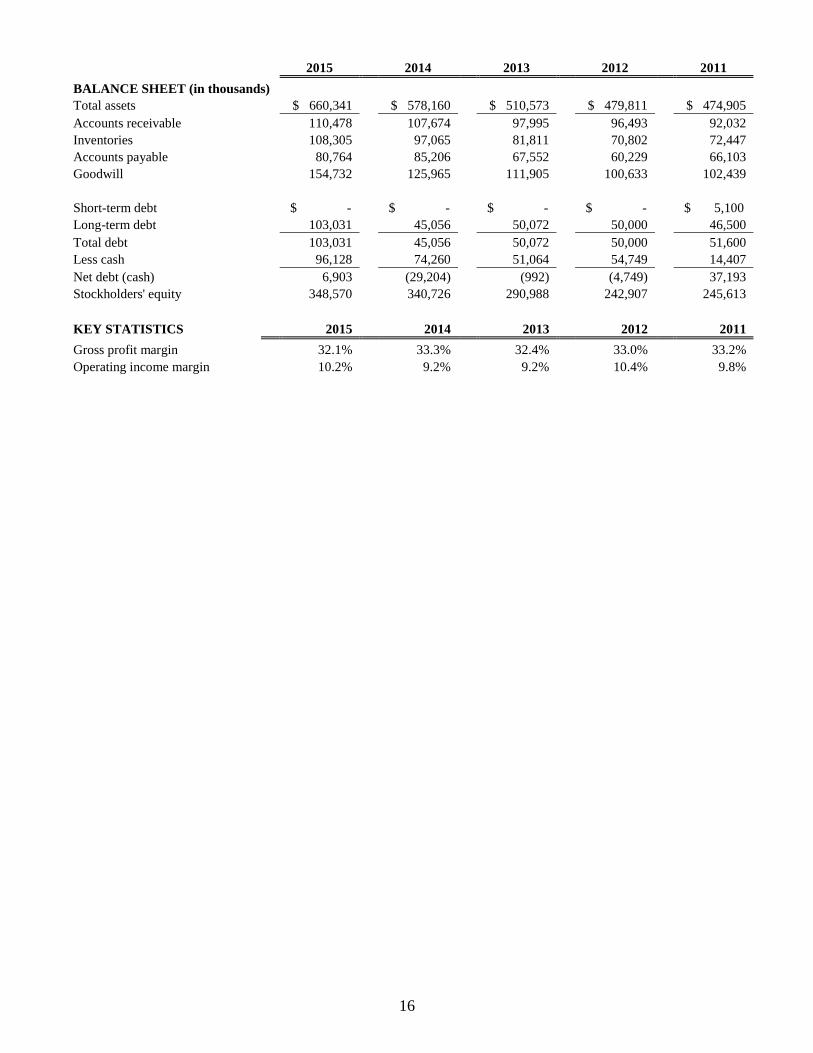
2015 2014 2013 2012 2011
BALANCE SHEET (in thousands)
Total assets
$ 660,341
$ 578,160
$ 510,573
$ 479,811
$ 474,905
Accounts receivable
110,478
107,674
97,995
96,493
92,032
Inventories
108,305
97,065
81,811
70,802
72,447
Accounts payable
80,764
85,206
67,552
60,229
66,103
Goodwill
154,732
125,965
111,905
100,633
102,439
Short-term debt
$ -
$ -
$ -
$ -
$ 5,100
Long-term debt
103,031
45,056
50,072
50,000
46,500
Total debt
103,031
45,056
50,072
50,000
51,600
Less cash
96,128
74,260
51,064
54,749
14,407
Net debt (cash)
6,903
(29,204)
(992)
(4,749)
37,193
Stockholders' equity
348,570
340,726
290,988
242,907
245,613
KEY STATISTICS 2015 2014 2013 2012 2011
Gross profit margin
32.1%
33.3%
32.4%
33.0%
33.2%
Operating income margin
10.2%
9.2%
9.2%
10.4%
9.8%
17
Item 7. Management's Discussion and Analysis of Financial Condition and Results of Operations
Overview
We are a leading manufacturer of a variety of products and services for diverse commercial and industrial markets. We have
five reportable segments: Food Service Equipment Group, Engraving Group, Engineering Technologies Group, Electronics
Products Group, and the Hydraulics Products Group.
Our long term strategy is to build larger industrial platforms through a value creation system that assists management in
meeting specific corporate and business unit financial and strategic performance goals in order to create and sustain
shareholder value. The Standex Value Creation System has four components. The Balanced Performance Plan process aligns
annual goals throughout the business and provides a standard reporting, management and review process. It is focused on
setting and meeting annual and quarterly targets that support our short term and long term goals. The Standex Growth
Disciplines are a standard set of tools and processes to grow our businesses organically and through acquisitions. Standex
Operational Excellence employs LEAN processes to eliminate waste, improve profitability, cash flow and customer
satisfaction. Finally, the Standex Talent Management process provides training, development, and succession planning for our
employees. The value creation system provides standard tools and processes throughout Standex to deliver our business
objectives:
It is our objective to grow larger and more profitable business units through both organic initiatives and acquisitions.
On an ongoing basis we identify and implement organic growth initiatives such as new product development,
geographic expansion, introduction of products and technologies into new markets and applications, key accounts and
strategic sales channel partners. Also, we have a long-term objective to create sizable business platforms by adding
strategically aligned or “bolt on” acquisitions to strengthen the individual businesses, to create both sales and cost
synergies with our core business platforms, to accelerate their growth and margin improvement. There is a particular
focus on identifying and investing in opportunities that complement our products and will increase the global presence
and capabilities of our businesses. From time to time we have divested businesses that we felt were not strategic or
did not meet our growth and return expectations.
We create “Customer Intimacy” by utilizing the Standex Growth Disciplines to partner with our customers in order to
develop and deliver custom solutions or engineered products that provide technology-driven solutions to our
customers. This relationship generally provides us with the ability to sustain sales and profit growth over time and
provide operating margins that enhance shareholder returns. Further, we have made a priority of developing new sales
channels and leveraging strategic customer relationships.
Standex Operational Excellence drives continuous improvement in the efficiency of our businesses. We recognize
that our businesses are competing in a global economy that requires that we constantly strive to improve our
competitive position. We have deployed a number of management competencies including operational excellence
through lean enterprise, the use of low cost manufacturing facilities in countries such as Mexico, and China, the
consolidation of manufacturing facilities to achieve economies of scale and leveraging of fixed infrastructure costs,
alternate sourcing to achieve procurement cost reductions, and capital improvements to increase shop floor
productivity, which drives improvements in the cost structure of our business units.
Our capital allocation strategy is to use cash flow generated from operations to fund the strategic growth programs
described above, including acquisitions, dividends, and capital investments for organic growth and cost reductions.
We recognize that cash flow is fundamental to our ability to invest in organic and acquisitive growth for our business
units and return cash to our shareholders in the form of dividends.
As part of this ongoing strategy, during the first quarter of fiscal year 2015, we acquired Enginetics Corporation,
(“Enginetics”), a leading producer of aircraft engine components for all major aircraft platforms. This investment
complements our Engineering Technologies Group and allows us to provide broader solutions to the aviation market. During
June 2014, we also acquired Ultrafryer Systems, Inc., (“Ultrafryer”), a manufacturer of high quality commercial deep fryers.
This investment expanded our Food Service Equipment Group’s cooking product line capabilities in restaurant chains and
commercial food service institutions. During June 2014, we also acquired the assets of Planar Quality Corporation, a producer
of transformers for commercial military and space applications. This investment strategically enhances our Electronics
Group’s transformer product line capabilities.
We continue to focus on our efforts to reduce cost and improve productivity across our businesses, particularly in the Food
Service Equipment Group with the previously announced Cooking Solutions consolidation of operations located in the
Cheyenne, Wyoming plant into its Mexico facility. We continue to evaluate our products and production processes and expect
to execute similar cost reductions and restructuring programs on an ongoing basis.
Our business units are actively engaged in initiating new product introductions, expansion of product offerings through private
labeling and sourcing agreements, geographic expansion of sales coverage, the development of new sales channels, leveraging
18
strategic customer relationships, development of energy efficient products, new applications for existing products and
technology, and next generation products and services for our end-user markets.
Restructuring expenses reflect costs associated with the Company’s efforts to continuously improve operational efficiency and
expand globally in order to remain competitive in the end-user markets we serve. Each year the Company incurs costs for
actions to size its businesses to a level appropriate for current economic conditions and to improve its cost structure to enhance
our competitive position and operating margins. Such expenses include costs for moving facilities to low-cost locations,
starting up plants after relocation, curtailing or downsizing operations because of changing economic conditions, and other
costs resulting from asset redeployment decisions. Shutdown costs include severance, benefits, stay bonuses, lease and contract
terminations, asset write-downs, costs of moving fixed assets, moving, and relocation costs. Vacant facility costs include
maintenance, utilities, property taxes, and other costs.
Because of the diversity of the Company’s businesses, end user markets and geographic locations, management does not use
specific external indices to predict the future performance of the Company, other than general information about broad
macroeconomic trends. Each of our individual business units serves niche markets and attempts to identify trends other than
general business and economic conditions which are specific to their businesses and which could impact their performance.
Those units report pertinent information to senior management, which use it to the extent relevant to assess the future
performance of the Company. A description of any such material trends is described below in the applicable segment analysis.
We monitor a number of key performance indicators (“KPIs”) including net sales, income from operations, backlog, effective
income tax rate, and gross profit margin. A discussion of these KPIs is included in the discussion below. We may also
supplement the discussion of these KPIs by identifying the impact of foreign exchange rates, acquisitions, and other significant
items when they have a material impact on the discussed KPI.
We believe that the discussion of these items provides enhanced information to investors by disclosing their consequence on
the overall trend in order to provide a clearer comparative view of the KPI where applicable. For discussion of the impact of
foreign exchange rates on KPIs, the Company calculates the impact as the difference between the current period KPI calculated
at the current period exchange rate as compared to the KPI calculated at the historical exchange rate for the prior period. For
discussion of the impact of acquisitions, we isolate the effect to the KPI amount that would have existed regardless of our
acquisition. Sales resulting from synergies between the acquisition and existing operations of the Company are considered
organic growth for the purposes of our discussion.
Unless otherwise noted, references to years are to fiscal years.
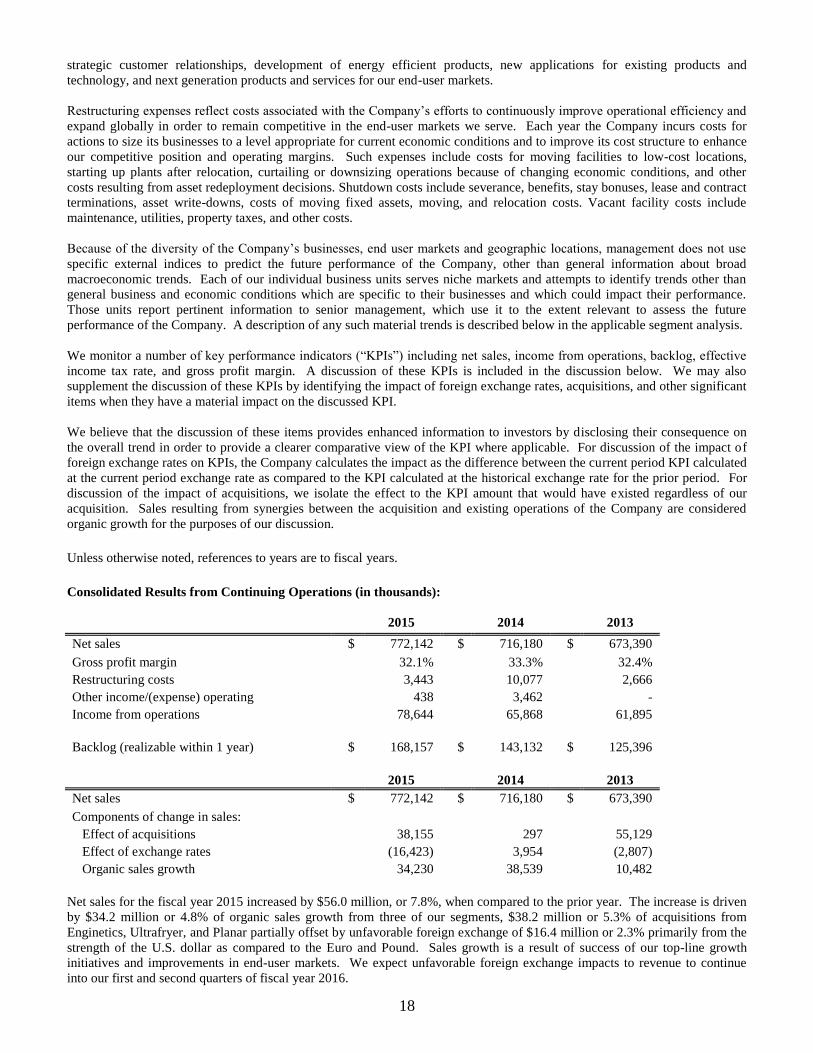
Consolidated Results from Continuing Operations (in thousands):
2015 2014 2013
Net sales $ 772,142 $ 716,180 $ 673,390
Gross profit margin 32.1% 33.3% 32.4%
Restructuring costs 3,443 10,077 2,666
Other income/(expense) operating 438 3,462 -
Income from operations 78,644 65,868 61,895
Backlog (realizable within 1 year) $ 168,157 $ 143,132 $ 125,396
2015 2014 2013
Net sales $ 772,142 $ 716,180 $ 673,390
Components of change in sales:
Effect of acquisitions 38,155 297 55,129
Effect of exchange rates (16,423) 3,954 (2,807)
Organic sales growth 34,230 38,539 10,482
Net sales for the fiscal year 2015 increased by $56.0 million, or 7.8%, when compared to the prior year. The increase is driven
by $34.2 million or 4.8% of organic sales growth from three of our segments, $38.2 million or 5.3% of acquisitions from
Enginetics, Ultrafryer, and Planar partially offset by unfavorable foreign exchange of $16.4 million or 2.3% primarily from the
strength of the U.S. dollar as compared to the Euro and Pound. Sales growth is a result of success of our top-line growth
initiatives and improvements in end-user markets. We expect unfavorable foreign exchange impacts to revenue to continue
into our first and second quarters of fiscal year 2016.
19
Net sales for the fiscal year 2014 increased by $42.8 million, or 6.4%, when compared to the prior year. The increase is driven
by $38.5 million or 5.7% of organic sales growth from all our segments and favorable foreign exchange of $4.0 million. Sales
growth is a result of success of our top-line growth initiatives and improvements in end-user markets.
Gross Profit Margin
During 2015, gross margin decreased to 32.1% as compared to 33.3% in 2014. This decrease is primarily a result of exchange
rate declines, an unfavorable sales mix as compared to the prior year, coupled with $1.7 million of purchase accounting charges
associated with the Enginetics and Ultrafryer acquisitions.
During 2014, gross margin increased to 33.3% as compared to 32.4% in 2013. This increase is primarily a result of sales
volume and favorable sales mix, coupled with the absence of $1.5 million of purchase accounting charges incurred during 2013
associated with the Meder acquisition. Gross margin has increased at the Engraving Group due to strong automotive Mold-
Tech sales.
Selling, General, and Administrative Expenses
Selling, general, and administrative expenses, (“SG&A”) for the fiscal year 2015 were $165.8 million or 21.5% of sales
compared to $165.8 million or 23.1% of sales during the prior year. The decline in SG&A as a percentage of sales relates to
three primary items: the absence of $3.9 million of management transition costs in the prior year; increased selling and
distribution expense in the current year associated with a 4.8% increase in organic sales during the year; and $6.6 million of
incremental expenses as a result of the Ultrafryer and Enginetics acquisitions.
Selling, general, and administrative expenses for the fiscal year 2014 were $165.8 million or 23.1% of sales compared to
$153.6 million or 22.8% of sales. The increase was driven by $3.9 million of management transition costs, $3.4 million of
compensation expense due to improved performance and increase of $3.1 million of increased selling and distribution
expenses due to incremental sales volume. The charge for management transition expense included search fees, relocation
and other costs associated with the hiring of a new chief executive officer (“CEO”) and the acceleration of stock incentive
compensation expenses related to the retired CEO.
Income from Operations
Income from operations for the fiscal year 2015 increased by $12.8 million or 19.4%, when compared to the prior year. The
increase is primarily driven by $56.0 million of sales increases, increasing gross profit by $9.2 million, along with a $6.6
million decline in restructuring expenses, and a reduction in net gain from insurance proceeds of $3.0 million.
Income from operations for the fiscal year 2014 increased by $4.0 million or 6.4%, when compared to the prior year. The
increase was primarily driven by $42.8 million of sales increases, gross profit improvement of $20.0 million, and a $3.5 million
net gain from insurance proceeds, partially offset by increased operating expense and restructuring costs associated with the
completion of a facility closure in the Food Service Equipment Group.
Discussion of the performance of all of our reportable segments is more fully explained in the segment analysis that follows.
Interest Expense
Interest expense for the fiscal year 2015 was $3.2 million, an increase of $0.9 million as compared to the prior year. The
increase is primarily due to higher average borrowings outstanding during the year as a result of the Enginetics acquisition
and increased capital spending to support strategic growth programs. Interest expense of $2.2 million during 2014 was
comparable with 2013.
Income Taxes
The Company's income tax provision from continuing operations for the fiscal year ended June 30, 2015 was $20.9 million, an
effective rate of 27.4%, compared to $18.1 million, an effective rate of 26.6% for the year ended June 30, 2014, and $15.2
million, an effective rate of 25.7% for the year ended June 30, 2013. Changes in the effective tax rates from period to period
may be significant as they depend on many factors including, but not limited to, the amount of the Company's income or loss,
the mix of income earned in the U.S. versus outside the U.S., the effective tax rate in each of the countries in which we earn
income, and any one time tax issues which occur during the period.
20
The Company's income tax provision from continuing operations for the fiscal year ended June 30, 2015 was impacted by the
following items: (i) a benefit of $0.5 million related to the R&D tax credit that expired during the fiscal year on December 31,
2014 (ii) a benefit of $4.0 million due to the mix of income earned in jurisdictions with beneficial tax rates.
The Company's income tax provision from continuing operations for the fiscal year ended June 30, 2014 was impacted by the
following items: (i) a benefit of $0.5 million related to the R&D tax credit that expired during the fiscal year on December 31,
(ii) a benefit of $0.5 million related to a decrease in the statutory tax rate in the United Kingdom on prior period deferred tax
liabilities recorded during the first quarter during the fiscal year, (iii) a benefit of $1.1 million due to non-taxable life insurance
proceeds received in the third quarter and (iv) a benefit of $3.8 million due to the mix of income earned in jurisdictions with
beneficial tax rates.
The Company's income tax provision from continuing operations for the fiscal year ended June 30, 2013 was impacted by the
following items: (i) a benefit of $0.4 million related to the retroactive extension of the R&D credit recorded during the third
quarter, (ii) a benefit of $0.3 million related to a decrease in the statutory tax rate in the United Kingdom on prior period
deferred tax liabilities recorded during the first and fourth quarters, (iii) a benefit of $1.0 million from the reversal of a deferred
tax liability that was determined to be no longer required during the third quarter and (iv) a benefit of $2.8 million due to the
mix of income earned in jurisdictions with beneficial tax rates.
Capital Expenditures
In general, our capital expenditures over the longer term are expected to be approximately 2% to 3% of net sales. During 2015,
capital expenditures increased to $22.6 million compared to $18.8 million in the prior year. We anticipate capital expenditures
in the range of $26.0 million to $28.0 million in 2016 including approximately $6.0 million related to a new facility to support
growth in the aviation market.
Backlog
Backlog includes all active or open orders for goods and services that have a firm fixed customer purchase order with defined
delivery dates. Backlog also includes any future deliveries based on executed customer contracts, so long as such deliveries
are based on agreed upon delivery schedules. Backlog is not generally a significant factor in the Company’s businesses
because of our relatively short delivery periods and rapid inventory turnover with the exception of Engineering Technologies.
Backlog realizable within one year increased $25.0 million, or 17.5%, to $168.2 million at June 30, 2015 from $143.1 million
at June 30, 2014. Backlog excluding the acquisition year over year is down by $1.2 million or 0.8%.
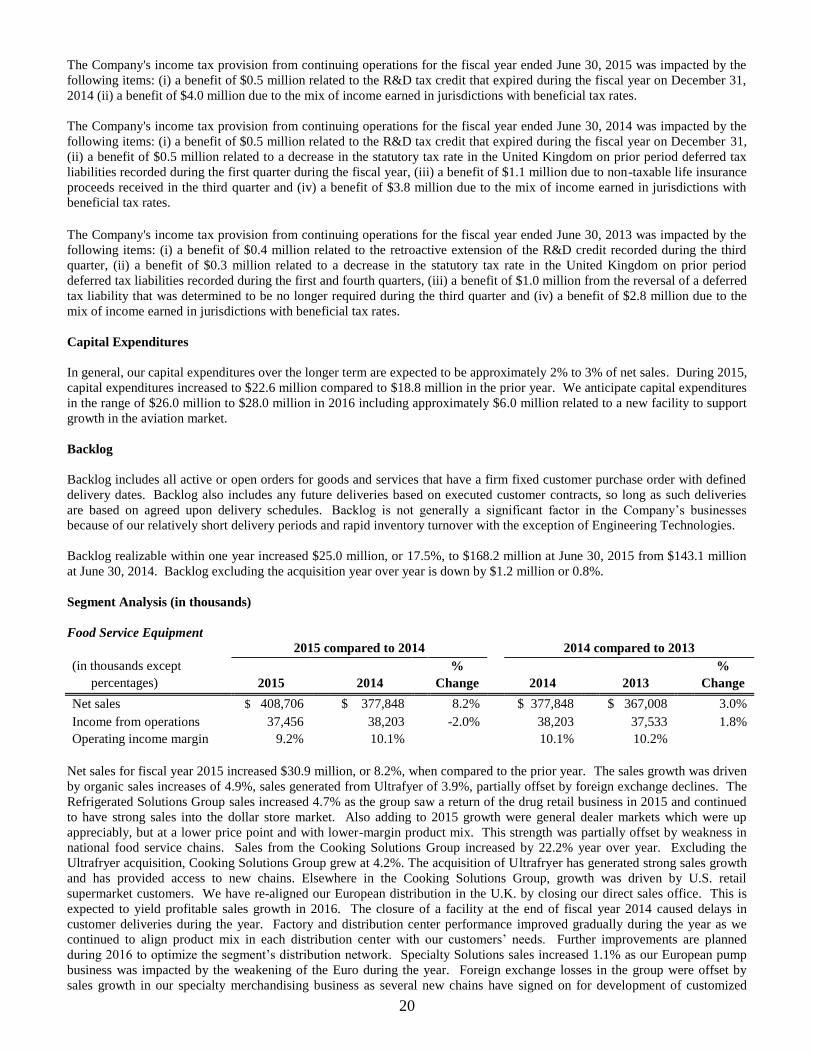
Segment Analysis (in thousands)
Food Service Equipment
2015 compared to 2014 2014 compared to 2013
(in thousands except % %
percentages) 2015 2014 Change 2014 2013 Change
Net sales $ 408,706 $ 377,848 8.2% $ 377,848 $ 367,008 3.0%
Income from operations 37,456 38,203 -2.0% 38,203 37,533 1.8%
Operating income margin 9.2% 10.1% 10.1% 10.2%
Net sales for fiscal year 2015 increased $30.9 million, or 8.2%, when compared to the prior year. The sales growth was driven
by organic sales increases of 4.9%, sales generated from Ultrafyer of 3.9%, partially offset by foreign exchange declines. The
Refrigerated Solutions Group sales increased 4.7% as the group saw a return of the drug retail business in 2015 and continued
to have strong sales into the dollar store market. Also adding to 2015 growth were general dealer markets which were up
appreciably, but at a lower price point and with lower-margin product mix. This strength was partially offset by weakness in
national food service chains. Sales from the Cooking Solutions Group increased by 22.2% year over year. Excluding the
Ultrafryer acquisition, Cooking Solutions Group grew at 4.2%. The acquisition of Ultrafryer has generated strong sales growth
and has provided access to new chains. Elsewhere in the Cooking Solutions Group, growth was driven by U.S. retail
supermarket customers. We have re-aligned our European distribution in the U.K. by closing our direct sales office. This is
expected to yield profitable sales growth in 2016. The closure of a facility at the end of fiscal year 2014 caused delays in
customer deliveries during the year. Factory and distribution center performance improved gradually during the year as we
continued to align product mix in each distribution center with our customers’ needs. Further improvements are planned
during 2016 to optimize the segment’s distribution network. Specialty Solutions sales increased 1.1% as our European pump
business was impacted by the weakening of the Euro during the year. Foreign exchange losses in the group were offset by
sales growth in our specialty merchandising business as several new chains have signed on for development of customized
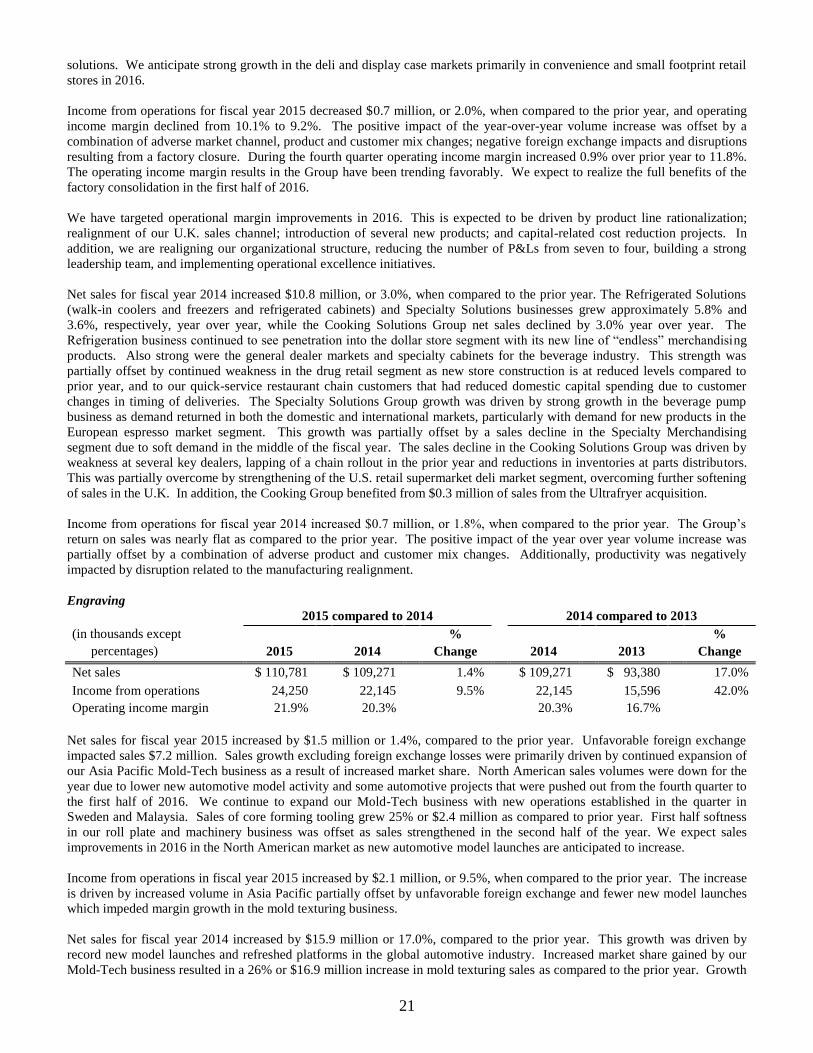
21
solutions. We anticipate strong growth in the deli and display case markets primarily in convenience and small footprint retail
stores in 2016.
Income from operations for fiscal year 2015 decreased $0.7 million, or 2.0%, when compared to the prior year, and operating
income margin declined from 10.1% to 9.2%. The positive impact of the year-over-year volume increase was offset by a
combination of adverse market channel, product and customer mix changes; negative foreign exchange impacts and disruptions
resulting from a factory closure. During the fourth quarter operating income margin increased 0.9% over prior year to 11.8%.
The operating income margin results in the Group have been trending favorably. We expect to realize the full benefits of the
factory consolidation in the first half of 2016.
We have targeted operational margin improvements in 2016. This is expected to be driven by product line rationalization;
realignment of our U.K. sales channel; introduction of several new products; and capital-related cost reduction projects. In
addition, we are realigning our organizational structure, reducing the number of P&Ls from seven to four, building a strong
leadership team, and implementing operational excellence initiatives.
Net sales for fiscal year 2014 increased $10.8 million, or 3.0%, when compared to the prior year. The Refrigerated Solutions
(walk-in coolers and freezers and refrigerated cabinets) and Specialty Solutions businesses grew approximately 5.8% and
3.6%, respectively, year over year, while the Cooking Solutions Group net sales declined by 3.0% year over year. The
Refrigeration business continued to see penetration into the dollar store segment with its new line of “endless” merchandising
products. Also strong were the general dealer markets and specialty cabinets for the beverage industry. This strength was
partially offset by continued weakness in the drug retail segment as new store construction is at reduced levels compared to
prior year, and to our quick-service restaurant chain customers that had reduced domestic capital spending due to customer
changes in timing of deliveries. The Specialty Solutions Group growth was driven by strong growth in the beverage pump
business as demand returned in both the domestic and international markets, particularly with demand for new products in the
European espresso market segment. This growth was partially offset by a sales decline in the Specialty Merchandising
segment due to soft demand in the middle of the fiscal year. The sales decline in the Cooking Solutions Group was driven by
weakness at several key dealers, lapping of a chain rollout in the prior year and reductions in inventories at parts distributors.
This was partially overcome by strengthening of the U.S. retail supermarket deli market segment, overcoming further softening
of sales in the U.K. In addition, the Cooking Group benefited from $0.3 million of sales from the Ultrafryer acquisition.
Income from operations for fiscal year 2014 increased $0.7 million, or 1.8%, when compared to the prior year. The Group’s
return on sales was nearly flat as compared to the prior year. The positive impact of the year over year volume increase was
partially offset by a combination of adverse product and customer mix changes. Additionally, productivity was negatively
impacted by disruption related to the manufacturing realignment.
Engraving
2015 compared to 2014 2014 compared to 2013
(in thousands except % %
percentages) 2015 2014 Change 2014 2013 Change
Net sales $ 110,781 $ 109,271 1.4% $ 109,271 $ 93,380 17.0%
Income from operations 24,250 22,145 9.5% 22,145 15,596 42.0%
Operating income margin 21.9% 20.3% 20.3% 16.7%
Net sales for fiscal year 2015 increased by $1.5 million or 1.4%, compared to the prior year. Unfavorable foreign exchange
impacted sales $7.2 million. Sales growth excluding foreign exchange losses were primarily driven by continued expansion of
our Asia Pacific Mold-Tech business as a result of increased market share. North American sales volumes were down for the
year due to lower new automotive model activity and some automotive projects that were pushed out from the fourth quarter to
the first half of 2016. We continue to expand our Mold-Tech business with new operations established in the quarter in
Sweden and Malaysia. Sales of core forming tooling grew 25% or $2.4 million as compared to prior year. First half softness
in our roll plate and machinery business was offset as sales strengthened in the second half of the year. We expect sales
improvements in 2016 in the North American market as new automotive model launches are anticipated to increase.
Income from operations in fiscal year 2015 increased by $2.1 million, or 9.5%, when compared to the prior year. The increase
is driven by increased volume in Asia Pacific partially offset by unfavorable foreign exchange and fewer new model launches
which impeded margin growth in the mold texturing business.
Net sales for fiscal year 2014 increased by $15.9 million or 17.0%, compared to the prior year. This growth was driven by
record new model launches and refreshed platforms in the global automotive industry. Increased market share gained by our
Mold-Tech business resulted in a 26% or $16.9 million increase in mold texturing sales as compared to the prior year. Growth
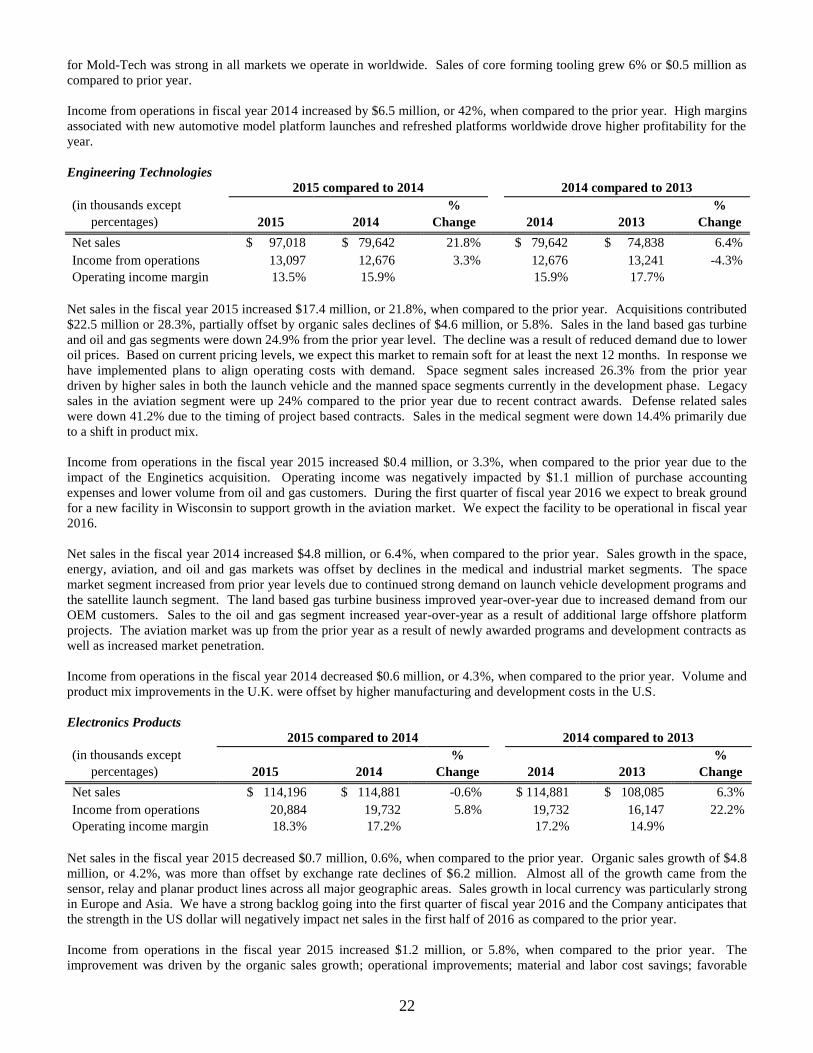
22
for Mold-Tech was strong in all markets we operate in worldwide. Sales of core forming tooling grew 6% or $0.5 million as
compared to prior year.
Income from operations in fiscal year 2014 increased by $6.5 million, or 42%, when compared to the prior year. High margins
associated with new automotive model platform launches and refreshed platforms worldwide drove higher profitability for the
year.
Engineering Technologies
2015 compared to 2014 2014 compared to 2013
(in thousands except % %
percentages) 2015 2014 Change 2014 2013 Change
Net sales $ 97,018 $ 79,642 21.8% $ 79,642 $ 74,838 6.4%
Income from operations 13,097 12,676 3.3% 12,676 13,241 -4.3%
Operating income margin 13.5% 15.9% 15.9% 17.7%
Net sales in the fiscal year 2015 increased $17.4 million, or 21.8%, when compared to the prior year. Acquisitions contributed
$22.5 million or 28.3%, partially offset by organic sales declines of $4.6 million, or 5.8%. Sales in the land based gas turbine
and oil and gas segments were down 24.9% from the prior year level. The decline was a result of reduced demand due to lower
oil prices. Based on current pricing levels, we expect this market to remain soft for at least the next 12 months. In response we
have implemented plans to align operating costs with demand. Space segment sales increased 26.3% from the prior year
driven by higher sales in both the launch vehicle and the manned space segments currently in the development phase. Legacy
sales in the aviation segment were up 24% compared to the prior year due to recent contract awards. Defense related sales
were down 41.2% due to the timing of project based contracts. Sales in the medical segment were down 14.4% primarily due
to a shift in product mix.
Income from operations in the fiscal year 2015 increased $0.4 million, or 3.3%, when compared to the prior year due to the
impact of the Enginetics acquisition. Operating income was negatively impacted by $1.1 million of purchase accounting
expenses and lower volume from oil and gas customers. During the first quarter of fiscal year 2016 we expect to break ground
for a new facility in Wisconsin to support growth in the aviation market. We expect the facility to be operational in fiscal year
2016.
Net sales in the fiscal year 2014 increased $4.8 million, or 6.4%, when compared to the prior year. Sales growth in the space,
energy, aviation, and oil and gas markets was offset by declines in the medical and industrial market segments. The space
market segment increased from prior year levels due to continued strong demand on launch vehicle development programs and
the satellite launch segment. The land based gas turbine business improved year-over-year due to increased demand from our
OEM customers. Sales to the oil and gas segment increased year-over-year as a result of additional large offshore platform
projects. The aviation market was up from the prior year as a result of newly awarded programs and development contracts as
well as increased market penetration.
Income from operations in the fiscal year 2014 decreased $0.6 million, or 4.3%, when compared to the prior year. Volume and
product mix improvements in the U.K. were offset by higher manufacturing and development costs in the U.S.
Electronics Products
2015 compared to 2014 2014 compared to 2013
(in thousands except % %
percentages) 2015 2014 Change 2014 2013 Change
Net sales $ 114,196 $ 114,881 -0.6% $ 114,881 $ 108,085 6.3%
Income from operations 20,884 19,732 5.8% 19,732 16,147 22.2%
Operating income margin 18.3% 17.2% 17.2% 14.9%
Net sales in the fiscal year 2015 decreased $0.7 million, 0.6%, when compared to the prior year. Organic sales growth of $4.8
million, or 4.2%, was more than offset by exchange rate declines of $6.2 million. Almost all of the growth came from the
sensor, relay and planar product lines across all major geographic areas. Sales growth in local currency was particularly strong
in Europe and Asia. We have a strong backlog going into the first quarter of fiscal year 2016 and the Company anticipates that
the strength in the US dollar will negatively impact net sales in the first half of 2016 as compared to the prior year.
Income from operations in the fiscal year 2015 increased $1.2 million, or 5.8%, when compared to the prior year. The
improvement was driven by the organic sales growth; operational improvements; material and labor cost savings; favorable
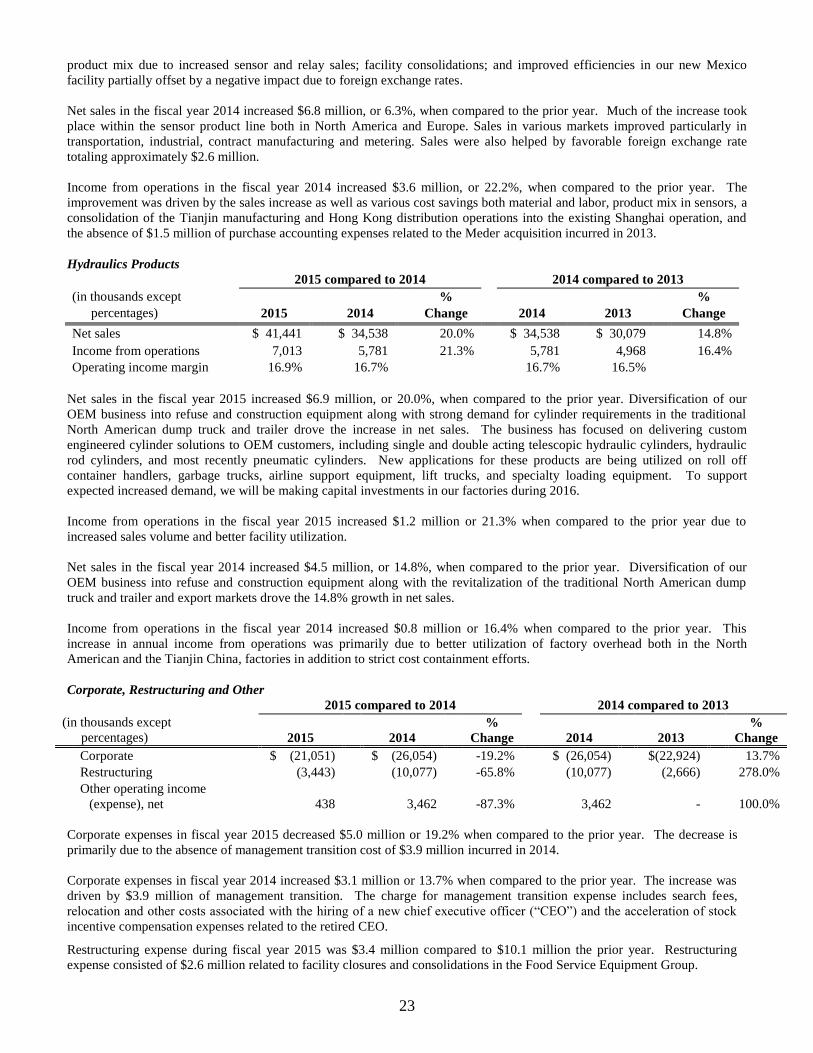
23
product mix due to increased sensor and relay sales; facility consolidations; and improved efficiencies in our new Mexico
facility partially offset by a negative impact due to foreign exchange rates.
Net sales in the fiscal year 2014 increased $6.8 million, or 6.3%, when compared to the prior year. Much of the increase took
place within the sensor product line both in North America and Europe. Sales in various markets improved particularly in
transportation, industrial, contract manufacturing and metering. Sales were also helped by favorable foreign exchange rate
totaling approximately $2.6 million.
Income from operations in the fiscal year 2014 increased $3.6 million, or 22.2%, when compared to the prior year. The
improvement was driven by the sales increase as well as various cost savings both material and labor, product mix in sensors, a
consolidation of the Tianjin manufacturing and Hong Kong distribution operations into the existing Shanghai operation, and
the absence of $1.5 million of purchase accounting expenses related to the Meder acquisition incurred in 2013.
Hydraulics Products
2015 compared to 2014 2014 compared to 2013
(in thousands except % %
percentages) 2015 2014 Change 2014 2013 Change
Net sales $ 41,441 $ 34,538 20.0% $ 34,538 $ 30,079 14.8%
Income from operations 7,013 5,781 21.3% 5,781 4,968 16.4%
Operating income margin 16.9% 16.7% 16.7% 16.5%
Net sales in the fiscal year 2015 increased $6.9 million, or 20.0%, when compared to the prior year. Diversification of our
OEM business into refuse and construction equipment along with strong demand for cylinder requirements in the traditional
North American dump truck and trailer drove the increase in net sales. The business has focused on delivering custom
engineered cylinder solutions to OEM customers, including single and double acting telescopic hydraulic cylinders, hydraulic
rod cylinders, and most recently pneumatic cylinders. New applications for these products are being utilized on roll off
container handlers, garbage trucks, airline support equipment, lift trucks, and specialty loading equipment. To support
expected increased demand, we will be making capital investments in our factories during 2016.
Income from operations in the fiscal year 2015 increased $1.2 million or 21.3% when compared to the prior year due to
increased sales volume and better facility utilization.
Net sales in the fiscal year 2014 increased $4.5 million, or 14.8%, when compared to the prior year. Diversification of our
OEM business into refuse and construction equipment along with the revitalization of the traditional North American dump
truck and trailer and export markets drove the 14.8% growth in net sales.
Income from operations in the fiscal year 2014 increased $0.8 million or 16.4% when compared to the prior year. This
increase in annual income from operations was primarily due to better utilization of factory overhead both in the North
American and the Tianjin China, factories in addition to strict cost containment efforts.
Corporate, Restructuring and Other
2015 compared to 2014 2014 compared to 2013
(in thousands except % %
percentages) 2015 2014 Change 2014 2013 Change
Corporate $ (21,051) $ (26,054) -19.2% $ (26,054) $(22,924) 13.7%
Restructuring (3,443) (10,077) -65.8% (10,077) (2,666) 278.0%
Other operating income
(expense), net
438
3,462
-87.3%
3,462
-
100.0%
Corporate expenses in fiscal year 2015 decreased $5.0 million or 19.2% when compared to the prior year. The decrease is
primarily due to the absence of management transition cost of $3.9 million incurred in 2014.
Corporate expenses in fiscal year 2014 increased $3.1 million or 13.7% when compared to the prior year. The increase was
driven by $3.9 million of management transition. The charge for management transition expense includes search fees,
relocation and other costs associated with the hiring of a new chief executive officer (“CEO”) and the acceleration of stock
incentive compensation expenses related to the retired CEO.
Restructuring expense during fiscal year 2015 was $3.4 million compared to $10.1 million the prior year. Restructuring
expense consisted of $2.6 million related to facility closures and consolidations in the Food Service Equipment Group.
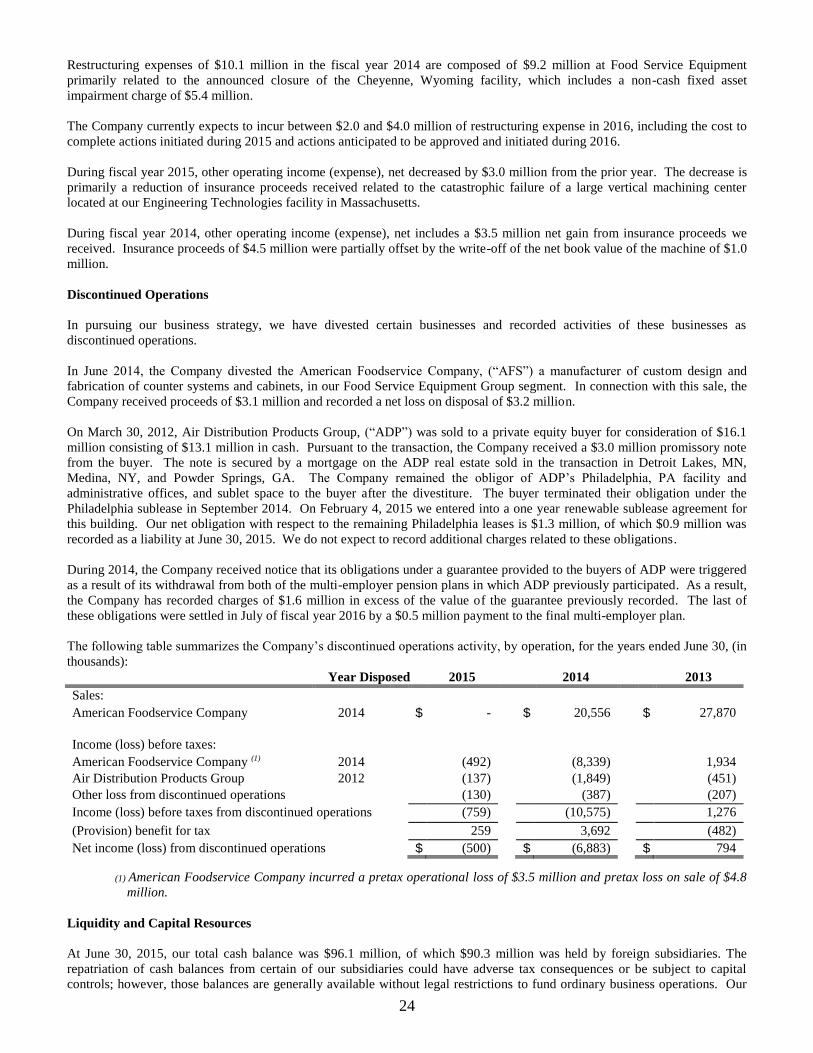
24
Restructuring expenses of $10.1 million in the fiscal year 2014 are composed of $9.2 million at Food Service Equipment
primarily related to the announced closure of the Cheyenne, Wyoming facility, which includes a non-cash fixed asset
impairment charge of $5.4 million.
The Company currently expects to incur between $2.0 and $4.0 million of restructuring expense in 2016, including the cost to
complete actions initiated during 2015 and actions anticipated to be approved and initiated during 2016.
During fiscal year 2015, other operating income (expense), net decreased by $3.0 million from the prior year. The decrease is
primarily a reduction of insurance proceeds received related to the catastrophic failure of a large vertical machining center
located at our Engineering Technologies facility in Massachusetts.
During fiscal year 2014, other operating income (expense), net includes a $3.5 million net gain from insurance proceeds we
received. Insurance proceeds of $4.5 million were partially offset by the write-off of the net book value of the machine of $1.0
million.
Discontinued Operations
In pursuing our business strategy, we have divested certain businesses and recorded activities of these businesses as
discontinued operations.
In June 2014, the Company divested the American Foodservice Company, (“AFS”) a manufacturer of custom design and
fabrication of counter systems and cabinets, in our Food Service Equipment Group segment. In connection with this sale, the
Company received proceeds of $3.1 million and recorded a net loss on disposal of $3.2 million.
On March 30, 2012, Air Distribution Products Group, (“ADP”) was sold to a private equity buyer for consideration of $16.1
million consisting of $13.1 million in cash. Pursuant to the transaction, the Company received a $3.0 million promissory note
from the buyer. The note is secured by a mortgage on the ADP real estate sold in the transaction in Detroit Lakes, MN,
Medina, NY, and Powder Springs, GA. The Company remained the obligor of ADP’s Philadelphia, PA facility and
administrative offices, and sublet space to the buyer after the divestiture. The buyer terminated their obligation under the
Philadelphia sublease in September 2014. On February 4, 2015 we entered into a one year renewable sublease agreement for
this building. Our net obligation with respect to the remaining Philadelphia leases is $1.3 million, of which $0.9 million was
recorded as a liability at June 30, 2015. We do not expect to record additional charges related to these obligations.
During 2014, the Company received notice that its obligations under a guarantee provided to the buyers of ADP were triggered
as a result of its withdrawal from both of the multi-employer pension plans in which ADP previously participated. As a result,
the Company has recorded charges of $1.6 million in excess of the value of the guarantee previously recorded. The last of
these obligations were settled in July of fiscal year 2016 by a $0.5 million payment to the final multi-employer plan.
The following table summarizes the Company’s discontinued operations activity, by operation, for the years ended June 30, (in
thousands):
Year Disposed 2015 2014 2013
Sales:
American Foodservice Company 2014 $ - $ 20,556 $ 27,870
Income (loss) before taxes:
American Foodservice Company (1) 2014 (492) (8,339) 1,934
Air Distribution Products Group 2012 (137) (1,849) (451)
Other loss from discontinued operations (130) (387) (207)
Income (loss) before taxes from discontinued operations (759) (10,575) 1,276
(Provision) benefit for tax 259 3,692 (482)
Net income (loss) from discontinued operations $ (500) $ (6,883) $ 794
(1) American Foodservice Company incurred a pretax operational loss of $3.5 million and pretax loss on sale of $4.8
million.
Liquidity and Capital Resources
At June 30, 2015, our total cash balance was $96.1 million, of which $90.3 million was held by foreign subsidiaries. The
repatriation of cash balances from certain of our subsidiaries could have adverse tax consequences or be subject to capital
controls; however, those balances are generally available without legal restrictions to fund ordinary business operations. Our
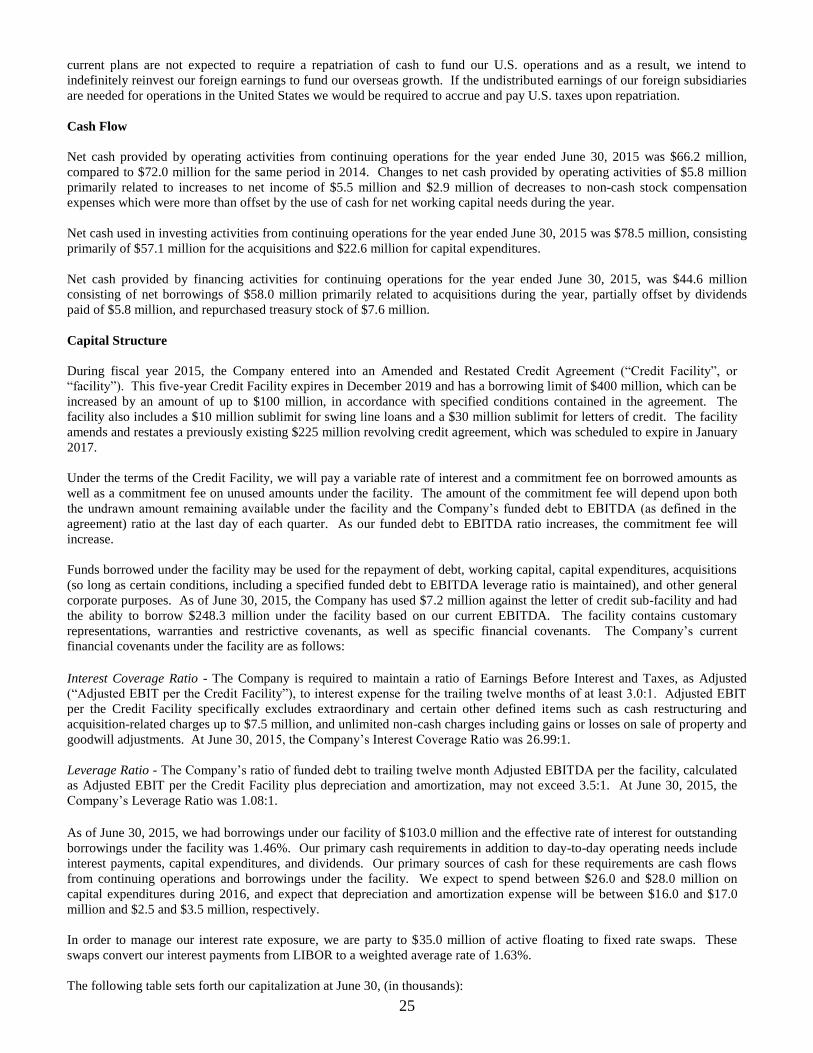
25
current plans are not expected to require a repatriation of cash to fund our U.S. operations and as a result, we intend to
indefinitely reinvest our foreign earnings to fund our overseas growth. If the undistributed earnings of our foreign subsidiaries
are needed for operations in the United States we would be required to accrue and pay U.S. taxes upon repatriation.
Cash Flow
Net cash provided by operating activities from continuing operations for the year ended June 30, 2015 was $66.2 million,
compared to $72.0 million for the same period in 2014. Changes to net cash provided by operating activities of $5.8 million
primarily related to increases to net income of $5.5 million and $2.9 million of decreases to non-cash stock compensation
expenses which were more than offset by the use of cash for net working capital needs during the year.
Net cash used in investing activities from continuing operations for the year ended June 30, 2015 was $78.5 million, consisting
primarily of $57.1 million for the acquisitions and $22.6 million for capital expenditures.
Net cash provided by financing activities for continuing operations for the year ended June 30, 2015, was $44.6 million
consisting of net borrowings of $58.0 million primarily related to acquisitions during the year, partially offset by dividends
paid of $5.8 million, and repurchased treasury stock of $7.6 million.
Capital Structure
During fiscal year 2015, the Company entered into an Amended and Restated Credit Agreement (“Credit Facility”, or
“facility”). This five-year Credit Facility expires in December 2019 and has a borrowing limit of $400 million, which can be
increased by an amount of up to $100 million, in accordance with specified conditions contained in the agreement. The
facility also includes a $10 million sublimit for swing line loans and a $30 million sublimit for letters of credit. The facility
amends and restates a previously existing $225 million revolving credit agreement, which was scheduled to expire in January
2017.
Under the terms of the Credit Facility, we will pay a variable rate of interest and a commitment fee on borrowed amounts as
well as a commitment fee on unused amounts under the facility. The amount of the commitment fee will depend upon both
the undrawn amount remaining available under the facility and the Company’s funded debt to EBITDA (as defined in the
agreement) ratio at the last day of each quarter. As our funded debt to EBITDA ratio increases, the commitment fee will
increase.
Funds borrowed under the facility may be used for the repayment of debt, working capital, capital expenditures, acquisitions
(so long as certain conditions, including a specified funded debt to EBITDA leverage ratio is maintained), and other general
corporate purposes. As of June 30, 2015, the Company has used $7.2 million against the letter of credit sub-facility and had
the ability to borrow $248.3 million under the facility based on our current EBITDA. The facility contains customary
representations, warranties and restrictive covenants, as well as specific financial covenants. The Company’s current
financial covenants under the facility are as follows:
Interest Coverage Ratio - The Company is required to maintain a ratio of Earnings Before Interest and Taxes, as Adjusted
(“Adjusted EBIT per the Credit Facility”), to interest expense for the trailing twelve months of at least 3.0:1. Adjusted EBIT
per the Credit Facility specifically excludes extraordinary and certain other defined items such as cash restructuring and
acquisition-related charges up to $7.5 million, and unlimited non-cash charges including gains or losses on sale of property and
goodwill adjustments. At June 30, 2015, the Company’s Interest Coverage Ratio was 26.99:1.
Leverage Ratio - The Company’s ratio of funded debt to trailing twelve month Adjusted EBITDA per the facility, calculated
as Adjusted EBIT per the Credit Facility plus depreciation and amortization, may not exceed 3.5:1. At June 30, 2015, the
Company’s Leverage Ratio was 1.08:1.
As of June 30, 2015, we had borrowings under our facility of $103.0 million and the effective rate of interest for outstanding
borrowings under the facility was 1.46%. Our primary cash requirements in addition to day-to-day operating needs include
interest payments, capital expenditures, and dividends. Our primary sources of cash for these requirements are cash flows
from continuing operations and borrowings under the facility. We expect to spend between $26.0 and $28.0 million on
capital expenditures during 2016, and expect that depreciation and amortization expense will be between $16.0 and $17.0
million and $2.5 and $3.5 million, respectively.
In order to manage our interest rate exposure, we are party to $35.0 million of active floating to fixed rate swaps. These
swaps convert our interest payments from LIBOR to a weighted average rate of 1.63%.
The following table sets forth our capitalization at June 30, (in thousands):
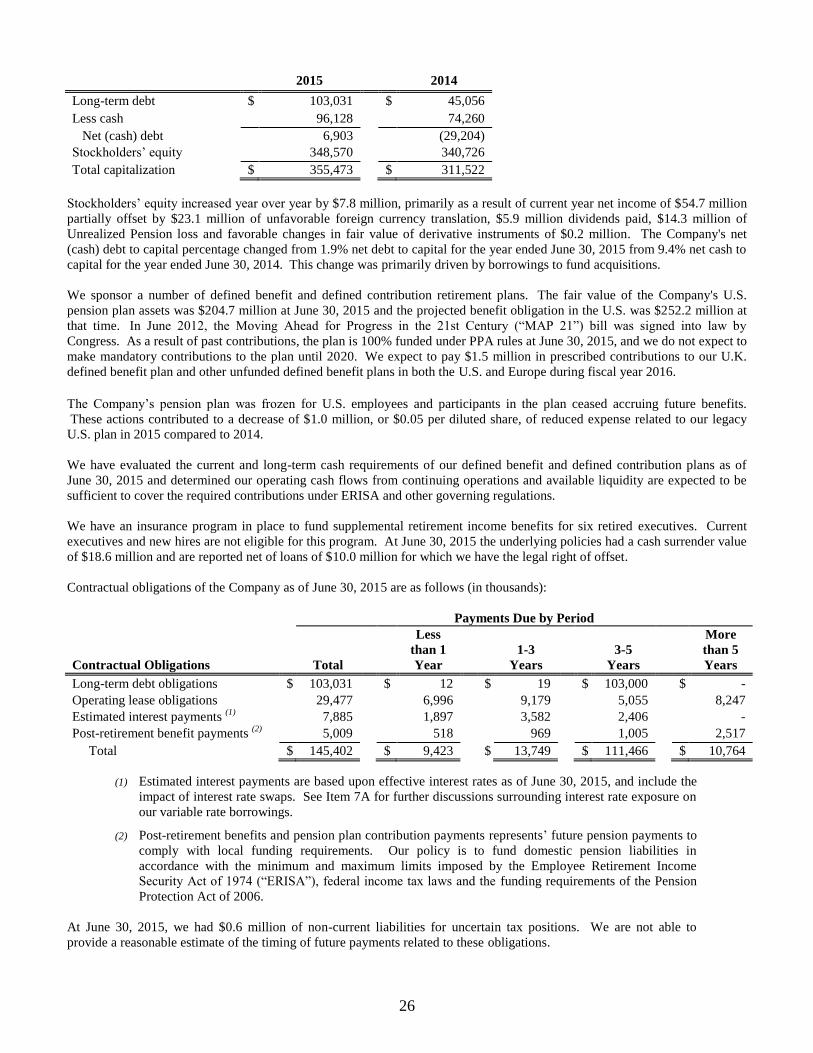
26
2015 2014
Long-term debt $ 103,031 $ 45,056
Less cash 96,128 74,260
Net (cash) debt 6,903 (29,204)
Stockholders’ equity 348,570 340,726
Total capitalization $ 355,473 $ 311,522
Stockholders’ equity increased year over year by $7.8 million, primarily as a result of current year net income of $54.7 million
partially offset by $23.1 million of unfavorable foreign currency translation, $5.9 million dividends paid, $14.3 million of
Unrealized Pension loss and favorable changes in fair value of derivative instruments of $0.2 million. The Company's net
(cash) debt to capital percentage changed from 1.9% net debt to capital for the year ended June 30, 2015 from 9.4% net cash to
capital for the year ended June 30, 2014. This change was primarily driven by borrowings to fund acquisitions.
We sponsor a number of defined benefit and defined contribution retirement plans. The fair value of the Company's U.S.
pension plan assets was $204.7 million at June 30, 2015 and the projected benefit obligation in the U.S. was $252.2 million at
that time. In June 2012, the Moving Ahead for Progress in the 21st Century (“MAP 21”) bill was signed into law by
Congress. As a result of past contributions, the plan is 100% funded under PPA rules at June 30, 2015, and we do not expect to
make mandatory contributions to the plan until 2020. We expect to pay $1.5 million in prescribed contributions to our U.K.
defined benefit plan and other unfunded defined benefit plans in both the U.S. and Europe during fiscal year 2016.
The Company’s pension plan was frozen for U.S. employees and participants in the plan ceased accruing future benefits.
These actions contributed to a decrease of $1.0 million, or $0.05 per diluted share, of reduced expense related to our legacy
U.S. plan in 2015 compared to 2014.
We have evaluated the current and long-term cash requirements of our defined benefit and defined contribution plans as of
June 30, 2015 and determined our operating cash flows from continuing operations and available liquidity are expected to be
sufficient to cover the required contributions under ERISA and other governing regulations.
We have an insurance program in place to fund supplemental retirement income benefits for six retired executives. Current
executives and new hires are not eligible for this program. At June 30, 2015 the underlying policies had a cash surrender value
of $18.6 million and are reported net of loans of $10.0 million for which we have the legal right of offset.
Contractual obligations of the Company as of June 30, 2015 are as follows (in thousands):
Payments Due by Period
Less More
than 1 1-3 3-5 than 5
Contractual Obligations Total Year Years Years Years
Long-term debt obligations $ 103,031 $ 12 $ 19 $ 103,000 $ -
Operating lease obligations 29,477 6,996 9,179 5,055 8,247
Estimated interest payments (1)
7,885 1,897 3,582 2,406 -
Post-retirement benefit payments (2)
5,009 518 969 1,005 2,517
Total $ 145,402 $ 9,423 $ 13,749 $ 111,466 $ 10,764
(1) Estimated interest payments are based upon effective interest rates as of June 30, 2015, and include the
impact of interest rate swaps. See Item 7A for further discussions surrounding interest rate exposure on
our variable rate borrowings.
(2) Post-retirement benefits and pension plan contribution payments represents’ future pension payments to
comply with local funding requirements. Our policy is to fund domestic pension liabilities in
accordance with the minimum and maximum limits imposed by the Employee Retirement Income
Security Act of 1974 (“ERISA”), federal income tax laws and the funding requirements of the Pension
Protection Act of 2006.
At June 30, 2015, we had $0.6 million of non-current liabilities for uncertain tax positions. We are not able to
provide a reasonable estimate of the timing of future payments related to these obligations.
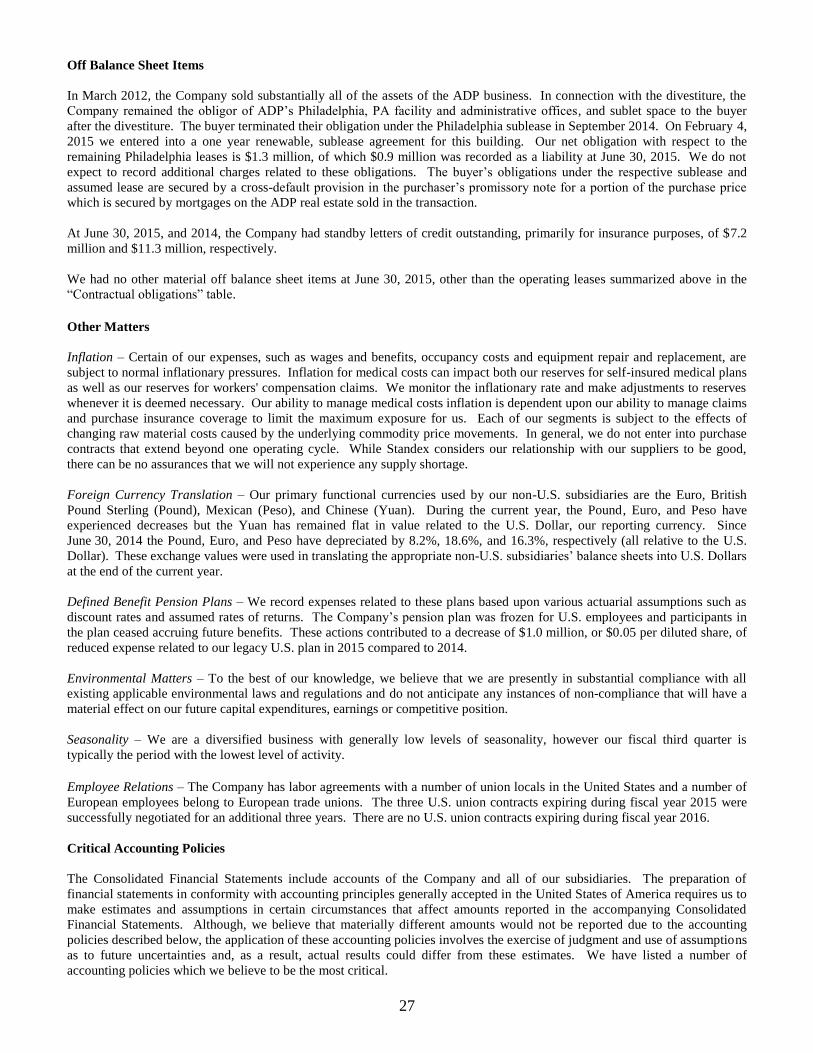
27
Off Balance Sheet Items
In March 2012, the Company sold substantially all of the assets of the ADP business. In connection with the divestiture, the
Company remained the obligor of ADP’s Philadelphia, PA facility and administrative offices, and sublet space to the buyer
after the divestiture. The buyer terminated their obligation under the Philadelphia sublease in September 2014. On February 4,
2015 we entered into a one year renewable, sublease agreement for this building. Our net obligation with respect to the
remaining Philadelphia leases is $1.3 million, of which $0.9 million was recorded as a liability at June 30, 2015. We do not
expect to record additional charges related to these obligations. The buyer’s obligations under the respective sublease and
assumed lease are secured by a cross-default provision in the purchaser’s promissory note for a portion of the purchase price
which is secured by mortgages on the ADP real estate sold in the transaction.
At June 30, 2015, and 2014, the Company had standby letters of credit outstanding, primarily for insurance purposes, of $7.2
million and $11.3 million, respectively.
We had no other material off balance sheet items at June 30, 2015, other than the operating leases summarized above in the
“Contractual obligations” table.
Other Matters
Inflation – Certain of our expenses, such as wages and benefits, occupancy costs and equipment repair and replacement, are
subject to normal inflationary pressures. Inflation for medical costs can impact both our reserves for self-insured medical plans
as well as our reserves for workers' compensation claims. We monitor the inflationary rate and make adjustments to reserves
whenever it is deemed necessary. Our ability to manage medical costs inflation is dependent upon our ability to manage claims
and purchase insurance coverage to limit the maximum exposure for us. Each of our segments is subject to the effects of
changing raw material costs caused by the underlying commodity price movements. In general, we do not enter into purchase
contracts that extend beyond one operating cycle. While Standex considers our relationship with our suppliers to be good,
there can be no assurances that we will not experience any supply shortage.
Foreign Currency Translation – Our primary functional currencies used by our non-U.S. subsidiaries are the Euro, British
Pound Sterling (Pound), Mexican (Peso), and Chinese (Yuan). During the current year, the Pound, Euro, and Peso have
experienced decreases but the Yuan has remained flat in value related to the U.S. Dollar, our reporting currency. Since
June 30, 2014 the Pound, Euro, and Peso have depreciated by 8.2%, 18.6%, and 16.3%, respectively (all relative to the U.S.
Dollar). These exchange values were used in translating the appropriate non-U.S. subsidiaries’ balance sheets into U.S. Dollars
at the end of the current year.
Defined Benefit Pension Plans – We record expenses related to these plans based upon various actuarial assumptions such as
discount rates and assumed rates of returns. The Company’s pension plan was frozen for U.S. employees and participants in
the plan ceased accruing future benefits. These actions contributed to a decrease of $1.0 million, or $0.05 per diluted share, of
reduced expense related to our legacy U.S. plan in 2015 compared to 2014.
Environmental Matters – To the best of our knowledge, we believe that we are presently in substantial compliance with all
existing applicable environmental laws and regulations and do not anticipate any instances of non-compliance that will have a
material effect on our future capital expenditures, earnings or competitive position.
Seasonality – We are a diversified business with generally low levels of seasonality, however our fiscal third quarter is
typically the period with the lowest level of activity.
Employee Relations – The Company has labor agreements with a number of union locals in the United States and a number of
European employees belong to European trade unions. The three U.S. union contracts expiring during fiscal year 2015 were
successfully negotiated for an additional three years. There are no U.S. union contracts expiring during fiscal year 2016.
Critical Accounting Policies
The Consolidated Financial Statements include accounts of the Company and all of our subsidiaries. The preparation of
financial statements in conformity with accounting principles generally accepted in the United States of America requires us to
make estimates and assumptions in certain circumstances that affect amounts reported in the accompanying Consolidated
Financial Statements. Although, we believe that materially different amounts would not be reported due to the accounting
policies described below, the application of these accounting policies involves the exercise of judgment and use of assumptions
as to future uncertainties and, as a result, actual results could differ from these estimates. We have listed a number of
accounting policies which we believe to be the most critical.
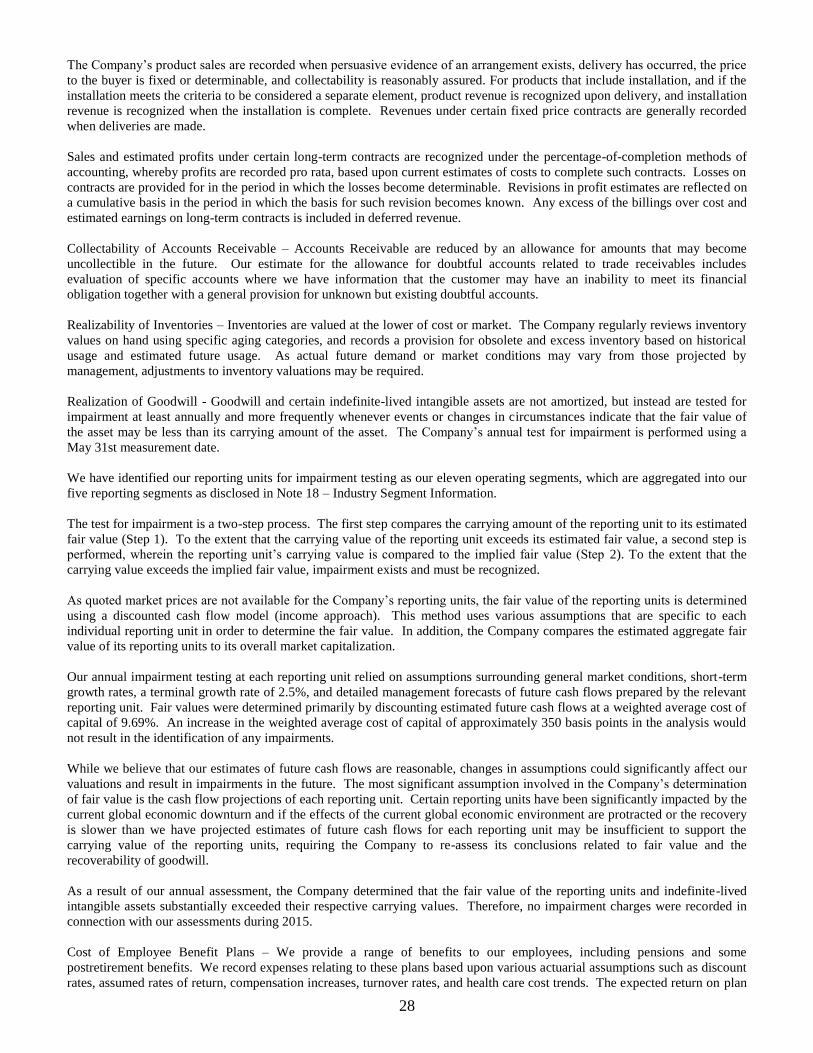
28
The Company’s product sales are recorded when persuasive evidence of an arrangement exists, delivery has occurred, the price
to the buyer is fixed or determinable, and collectability is reasonably assured. For products that include installation, and if the
installation meets the criteria to be considered a separate element, product revenue is recognized upon delivery, and installation
revenue is recognized when the installation is complete. Revenues under certain fixed price contracts are generally recorded
when deliveries are made.
Sales and estimated profits under certain long-term contracts are recognized under the percentage-of-completion methods of
accounting, whereby profits are recorded pro rata, based upon current estimates of costs to complete such contracts. Losses on
contracts are provided for in the period in which the losses become determinable. Revisions in profit estimates are reflected on
a cumulative basis in the period in which the basis for such revision becomes known. Any excess of the billings over cost and
estimated earnings on long-term contracts is included in deferred revenue.
Collectability of Accounts Receivable – Accounts Receivable are reduced by an allowance for amounts that may become
uncollectible in the future. Our estimate for the allowance for doubtful accounts related to trade receivables includes
evaluation of specific accounts where we have information that the customer may have an inability to meet its financial
obligation together with a general provision for unknown but existing doubtful accounts.
Realizability of Inventories – Inventories are valued at the lower of cost or market. The Company regularly reviews inventory
values on hand using specific aging categories, and records a provision for obsolete and excess inventory based on historical
usage and estimated future usage. As actual future demand or market conditions may vary from those projected by
management, adjustments to inventory valuations may be required.
Realization of Goodwill - Goodwill and certain indefinite-lived intangible assets are not amortized, but instead are tested for
impairment at least annually and more frequently whenever events or changes in circumstances indicate that the fair value of
the asset may be less than its carrying amount of the asset. The Company’s annual test for impairment is performed using a
May 31st measurement date.
We have identified our reporting units for impairment testing as our eleven operating segments, which are aggregated into our
five reporting segments as disclosed in Note 18 – Industry Segment Information.
The test for impairment is a two-step process. The first step compares the carrying amount of the reporting unit to its estimated
fair value (Step 1). To the extent that the carrying value of the reporting unit exceeds its estimated fair value, a second step is
performed, wherein the reporting unit’s carrying value is compared to the implied fair value (Step 2). To the extent that the
carrying value exceeds the implied fair value, impairment exists and must be recognized.
As quoted market prices are not available for the Company’s reporting units, the fair value of the reporting units is determined
using a discounted cash flow model (income approach). This method uses various assumptions that are specific to each
individual reporting unit in order to determine the fair value. In addition, the Company compares the estimated aggregate fair
value of its reporting units to its overall market capitalization.
Our annual impairment testing at each reporting unit relied on assumptions surrounding general market conditions, short-term
growth rates, a terminal growth rate of 2.5%, and detailed management forecasts of future cash flows prepared by the relevant
reporting unit. Fair values were determined primarily by discounting estimated future cash flows at a weighted average cost of
capital of 9.69%. An increase in the weighted average cost of capital of approximately 350 basis points in the analysis would
not result in the identification of any impairments.
While we believe that our estimates of future cash flows are reasonable, changes in assumptions could significantly affect our
valuations and result in impairments in the future. The most significant assumption involved in the Company’s determination
of fair value is the cash flow projections of each reporting unit. Certain reporting units have been significantly impacted by the
current global economic downturn and if the effects of the current global economic environment are protracted or the recovery
is slower than we have projected estimates of future cash flows for each reporting unit may be insufficient to support the
carrying value of the reporting units, requiring the Company to re-assess its conclusions related to fair value and the
recoverability of goodwill.
As a result of our annual assessment, the Company determined that the fair value of the reporting units and indefinite-lived
intangible assets substantially exceeded their respective carrying values. Therefore, no impairment charges were recorded in
connection with our assessments during 2015.
Cost of Employee Benefit Plans – We provide a range of benefits to our employees, including pensions and some
postretirement benefits. We record expenses relating to these plans based upon various actuarial assumptions such as discount
rates, assumed rates of return, compensation increases, turnover rates, and health care cost trends. The expected return on plan
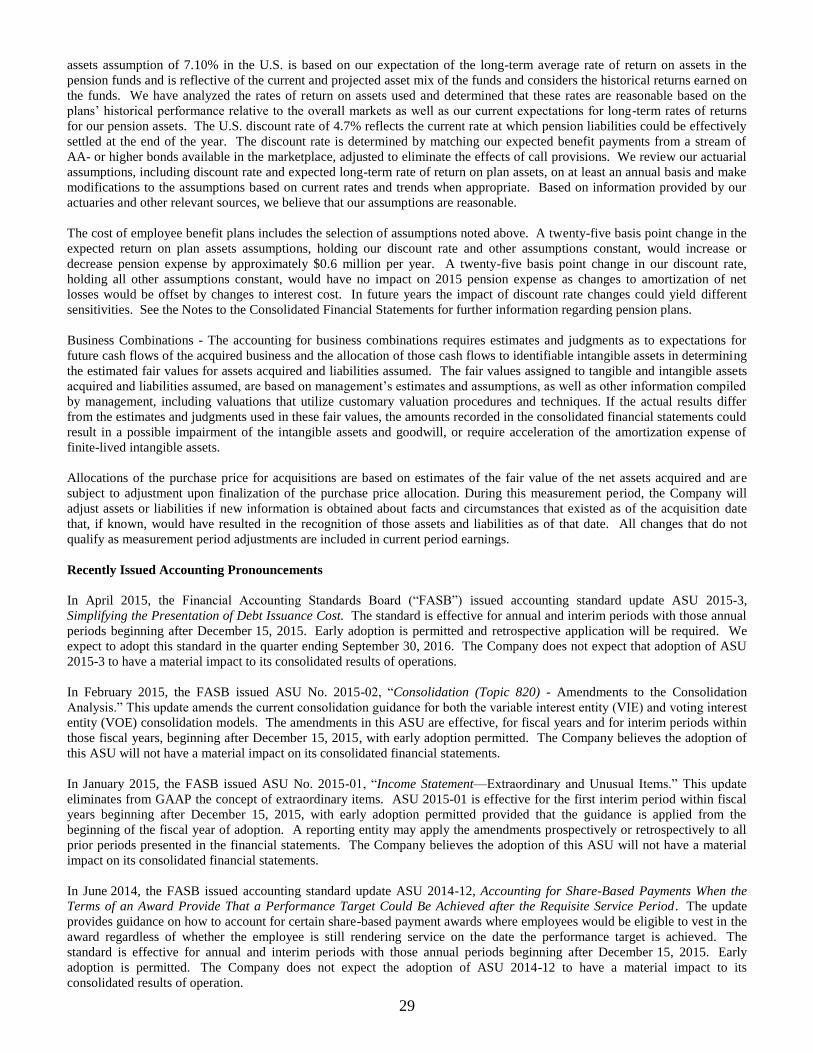
29
assets assumption of 7.10% in the U.S. is based on our expectation of the long-term average rate of return on assets in the
pension funds and is reflective of the current and projected asset mix of the funds and considers the historical returns earned on
the funds. We have analyzed the rates of return on assets used and determined that these rates are reasonable based on the
plans’ historical performance relative to the overall markets as well as our current expectations for long-term rates of returns
for our pension assets. The U.S. discount rate of 4.7% reflects the current rate at which pension liabilities could be effectively
settled at the end of the year. The discount rate is determined by matching our expected benefit payments from a stream of
AA- or higher bonds available in the marketplace, adjusted to eliminate the effects of call provisions. We review our actuarial
assumptions, including discount rate and expected long-term rate of return on plan assets, on at least an annual basis and make
modifications to the assumptions based on current rates and trends when appropriate. Based on information provided by our
actuaries and other relevant sources, we believe that our assumptions are reasonable.
The cost of employee benefit plans includes the selection of assumptions noted above. A twenty-five basis point change in the
expected return on plan assets assumptions, holding our discount rate and other assumptions constant, would increase or
decrease pension expense by approximately $0.6 million per year. A twenty-five basis point change in our discount rate,
holding all other assumptions constant, would have no impact on 2015 pension expense as changes to amortization of net
losses would be offset by changes to interest cost. In future years the impact of discount rate changes could yield different
sensitivities. See the Notes to the Consolidated Financial Statements for further information regarding pension plans.
Business Combinations - The accounting for business combinations requires estimates and judgments as to expectations for
future cash flows of the acquired business and the allocation of those cash flows to identifiable intangible assets in determining
the estimated fair values for assets acquired and liabilities assumed. The fair values assigned to tangible and intangible assets
acquired and liabilities assumed, are based on management’s estimates and assumptions, as well as other information compiled
by management, including valuations that utilize customary valuation procedures and techniques. If the actual results differ
from the estimates and judgments used in these fair values, the amounts recorded in the consolidated financial statements could
result in a possible impairment of the intangible assets and goodwill, or require acceleration of the amortization expense of
finite-lived intangible assets.
Allocations of the purchase price for acquisitions are based on estimates of the fair value of the net assets acquired and are
subject to adjustment upon finalization of the purchase price allocation. During this measurement period, the Company will
adjust assets or liabilities if new information is obtained about facts and circumstances that existed as of the acquisition date
that, if known, would have resulted in the recognition of those assets and liabilities as of that date. All changes that do not
qualify as measurement period adjustments are included in current period earnings.
Recently Issued Accounting Pronouncements
In April 2015, the Financial Accounting Standards Board (“FASB”) issued accounting standard update ASU 2015-3,
Simplifying the Presentation of Debt Issuance Cost. The standard is effective for annual and interim periods with those annual
periods beginning after December 15, 2015. Early adoption is permitted and retrospective application will be required. We
expect to adopt this standard in the quarter ending September 30, 2016. The Company does not expect that adoption of ASU
2015-3 to have a material impact to its consolidated results of operations.
In February 2015, the FASB issued ASU No. 2015-02, “Consolidation (Topic 820) - Amendments to the Consolidation
Analysis.” This update amends the current consolidation guidance for both the variable interest entity (VIE) and voting interest
entity (VOE) consolidation models. The amendments in this ASU are effective, for fiscal years and for interim periods within
those fiscal years, beginning after December 15, 2015, with early adoption permitted. The Company believes the adoption of
this ASU will not have a material impact on its consolidated financial statements.
In January 2015, the FASB issued ASU No. 2015-01, “Income Statement—Extraordinary and Unusual Items.” This update
eliminates from GAAP the concept of extraordinary items. ASU 2015-01 is effective for the first interim period within fiscal
years beginning after December 15, 2015, with early adoption permitted provided that the guidance is applied from the
beginning of the fiscal year of adoption. A reporting entity may apply the amendments prospectively or retrospectively to all
prior periods presented in the financial statements. The Company believes the adoption of this ASU will not have a material
impact on its consolidated financial statements.
In June 2014, the FASB issued accounting standard update ASU 2014-12, Accounting for Share-Based Payments When the
Terms of an Award Provide That a Performance Target Could Be Achieved after the Requisite Service Period. The update
provides guidance on how to account for certain share-based payment awards where employees would be eligible to vest in the
award regardless of whether the employee is still rendering service on the date the performance target is achieved. The
standard is effective for annual and interim periods with those annual periods beginning after December 15, 2015. Early
adoption is permitted. The Company does not expect the adoption of ASU 2014-12 to have a material impact to its
consolidated results of operation.
30
In May 2014, the FASB and the International Accounting Standards Board jointly issued a comprehensive new revenue
recognition standard, ASU 2014-09, Revenue from Contract with Customers, that will supersede nearly all existing revenue
recognition guidance under US GAAP and IFRS. The standard’s primary principle is that a company will recognize revenue
when it transfers promised goods or services to customers in an amount that reflects the consideration to which the Company
expects to be entitled in exchange for those goods or services. The original standard was effective for fiscal years beginning
after December 15, 2016; however, in July 2015, the FASB approved a one-year deferral of this standard, with a new effective
date for fiscal years beginning after December 15, 2017. We expect to adopt this standard in the quarter ending September 30,
2018. The Company is continuing to evaluating the impact of adopting ASU 2014-09 on its consolidated financial statements.
Item 7A. Quantitative and Qualitative Disclosures About Market Risk
Risk Management
We are exposed to market risks from changes in interest rates, commodity prices and changes in foreign currency exchange.
To reduce these risks, we selectively use, from time to time, financial instruments and other proactive management techniques.
We have internal policies and procedures that place financial instruments under the direction of the Treasurer and restrict all
derivative transactions to those intended for hedging purposes only. The use of financial instruments for trading purposes
(except for certain investments in connection with the non-qualified defined contribution plan) or speculation is strictly
prohibited. The Company has no majority-owned subsidiaries that are excluded from the consolidated financial statements.
Further, we have no interests in or relationships with any special purpose entities.
Exchange Risk
We are exposed to both transactional risk and translation risk associated with exchange rates. The transactional risk is
mitigated, in large part, by natural hedges developed with locally denominated debt service on intercompany accounts. We
also mitigate certain of our foreign currency exchange rate risks by entering into forward foreign currency contracts from time
to time. The contracts are used as a hedge against anticipated foreign cash flows, such as dividend payments, loan payments,
and materials purchases, and are not used for trading or speculative purposes. The fair values of the forward foreign currency
exchange contracts are sensitive to changes in foreign currency exchange rates, as an adverse change in foreign currency
exchange rates from market rates would decrease the fair value of the contracts. However, any such losses or gains would
generally be offset by corresponding gains and losses, respectively, on the related hedged asset or liability. At June 30, 2015
and 2014, the fair value, in the aggregate, of the Company’s open foreign exchange contracts was an asset of $0.7 million and a
liability of $1.2 million, respectively.
Our primary translation risk is with the Euro, British Pound Sterling, Peso, and Chinese Yuan. A hypothetical 10%
appreciation or depreciation of the value of any these foreign currencies to the U.S. Dollar at June 30, 2015, would not result in
a material change in our operations, financial position, or cash flows. We do not hedge our translation risk. As a result,
fluctuations in currency exchange rates can affect our stockholders’ equity.
Interest Rate
The Company’s effective rate on variable-rate borrowings under the revolving credit agreement is 1.46% and 3.87% at June
30, 2015 and 2014, respectively. Our interest rate exposure is limited primarily to interest rate changes on our variable rate
borrowings. From time to time, we will use interest rate swap agreements to modify our exposure to interest rate movements.
We currently have $35.0 million of active floating to fixed rate swaps with terms ranging from two to five years. These swaps
convert our interest payments from LIBOR to a weighted average rate of 1.63%. At June 30, 2015 and 2014, the fair value, in
the aggregate, of the Company’s interest rate swaps was a liability of $0.6 million and a liability of $1.1 million, respectively.
Due to the impact of the swaps, an increase in interest rates would not materially impact our annual interest expense at June 30,
2015.
Concentration of Credit Risk
We have a diversified customer base. As such, the risk associated with concentration of credit risk is inherently minimized.
As of June 30, 2015, no one customer accounted for more than 5% of our consolidated outstanding receivables or of our sales.
Commodity Prices
The Company is exposed to fluctuating market prices for all commodities used in its manufacturing processes. Each of our
segments is subject to the effects of changing raw material costs caused by the underlying commodity price movements. In

31
general, we do not enter into purchase contracts that extend beyond one operating cycle. While Standex considers our
relationship with our suppliers to be good, there can be no assurances that we will not experience any supply shortage.
The Engineering Technologies, Food Service Equipment, Electronics, and Hydraulics Groups are all sensitive to price
increases for steel products, other metal commodities and petroleum based products. In the past year, we have experienced
price fluctuations for a number of materials including steel, copper wire, other metal commodities, refrigeration components
and foam insulation. These materials are some of the key elements in the products manufactured in these segments. Wherever
possible, we will implement price increases to offset the impact of changing prices. The ultimate acceptance of these price
increases, if implemented, will be impacted by our affected divisions’ respective competitors and the timing of their price
increases.
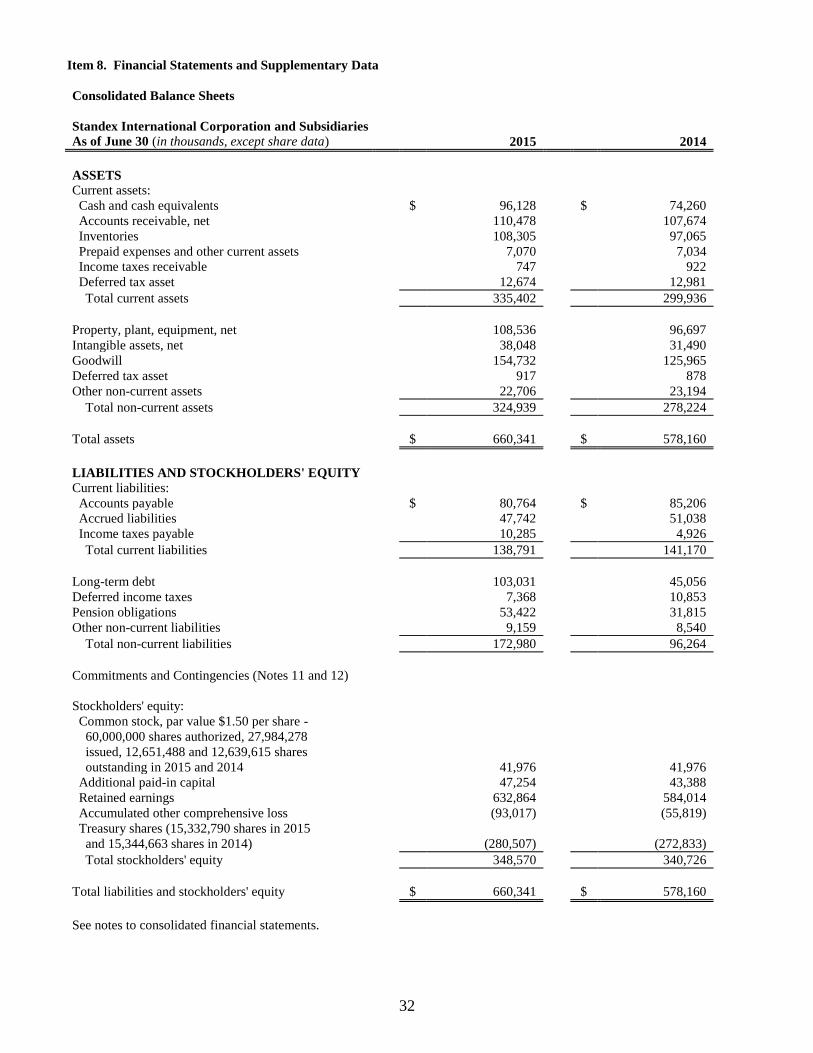
32
Item 8. Financial Statements and Supplementary Data
Consolidated Balance Sheets
Standex International Corporation and Subsidiaries
As of June 30 (in thousands, except share data) 2015 2014
ASSETS
Current assets:
Cash and cash equivalents $ 96,128 $ 74,260
Accounts receivable, net 110,478 107,674
Inventories 108,305 97,065
Prepaid expenses and other current assets 7,070 7,034
Income taxes receivable 747 922
Deferred tax asset 12,674 12,981
Total current assets 335,402 299,936
Property, plant, equipment, net 108,536 96,697
Intangible assets, net 38,048 31,490
Goodwill 154,732 125,965
Deferred tax asset 917 878
Other non-current assets 22,706 23,194
Total non-current assets 324,939 278,224
Total assets $ 660,341 $ 578,160
LIABILITIES AND STOCKHOLDERS' EQUITY
Current liabilities:
Accounts payable $ 80,764 $ 85,206
Accrued liabilities 47,742 51,038
Income taxes payable 10,285 4,926
Total current liabilities 138,791 141,170
Long-term debt 103,031 45,056
Deferred income taxes 7,368 10,853
Pension obligations 53,422 31,815
Other non-current liabilities 9,159 8,540
Total non-current liabilities 172,980 96,264
Commitments and Contingencies (Notes 11 and 12)
Stockholders' equity:
Common stock, par value $1.50 per share -
60,000,000 shares authorized, 27,984,278
issued, 12,651,488 and 12,639,615 shares outstanding in 2015 and 2014 41,976 41,976
Additional paid-in capital 47,254 43,388
Retained earnings 632,864 584,014
Accumulated other comprehensive loss (93,017) (55,819)
Treasury shares (15,332,790 shares in 2015
and 15,344,663 shares in 2014) (280,507) (272,833)
Total stockholders' equity 348,570 340,726
Total liabilities and stockholders' equity $ 660,341 $ 578,160
See notes to consolidated financial statements.
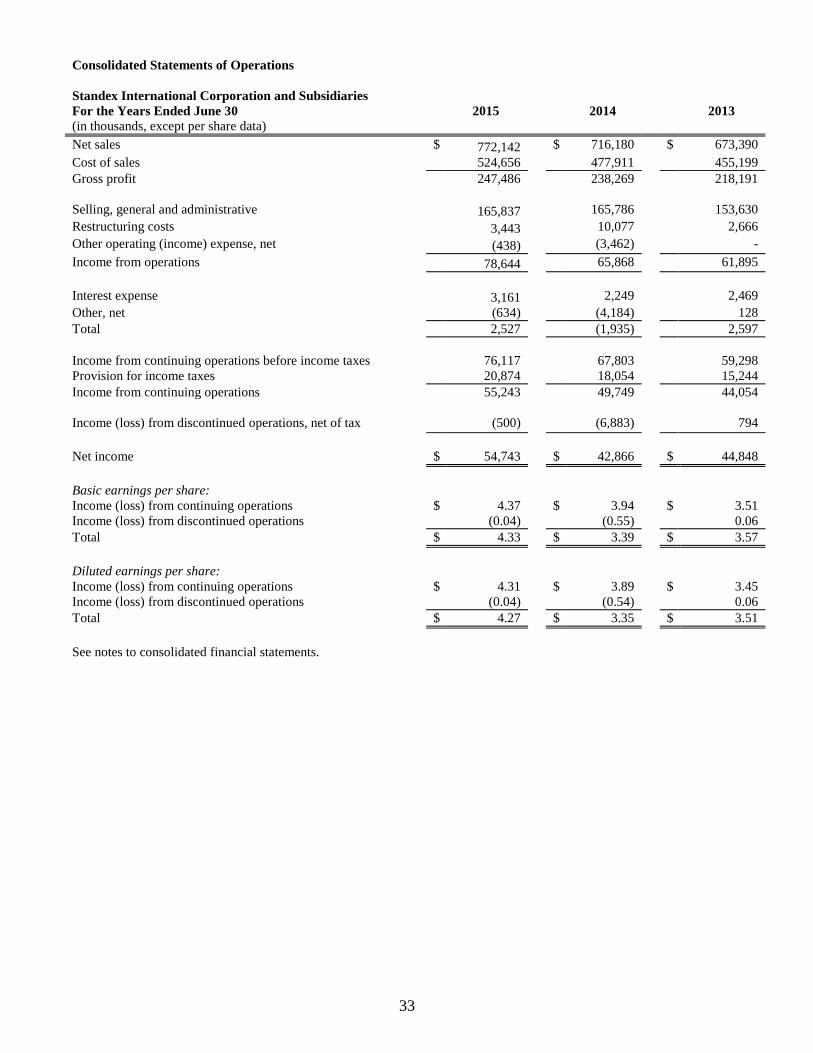
33
Consolidated Statements of Operations
Standex International Corporation and Subsidiaries
For the Years Ended June 30
(in thousands, except per share data) 2015 2014 2013
Net sales $ 772,142 $ 716,180 $ 673,390
Cost of sales 524,656 477,911 455,199
Gross profit 247,486 238,269 218,191
Selling, general and administrative 165,837 165,786 153,630
Restructuring costs 3,443 10,077 2,666
Other operating (income) expense, net (438) (3,462) -
Income from operations 78,644 65,868 61,895
Interest expense 3,161 2,249 2,469
Other, net (634) (4,184) 128
Total 2,527 (1,935) 2,597
Income from continuing operations before income taxes 76,117 67,803 59,298
Provision for income taxes 20,874 18,054 15,244
Income from continuing operations 55,243 49,749 44,054
Income (loss) from discontinued operations, net of tax (500) (6,883) 794
Net income $ 54,743 $ 42,866 $ 44,848
Basic earnings per share:
Income (loss) from continuing operations $ 4.37 $ 3.94 $ 3.51
Income (loss) from discontinued operations (0.04) (0.55) 0.06
Total $ 4.33 $ 3.39 $ 3.57
Diluted earnings per share:
Income (loss) from continuing operations $ 4.31 $ 3.89 $ 3.45
Income (loss) from discontinued operations (0.04) (0.54) 0.06
Total $ 4.27 $ 3.35 $ 3.51
See notes to consolidated financial statements.
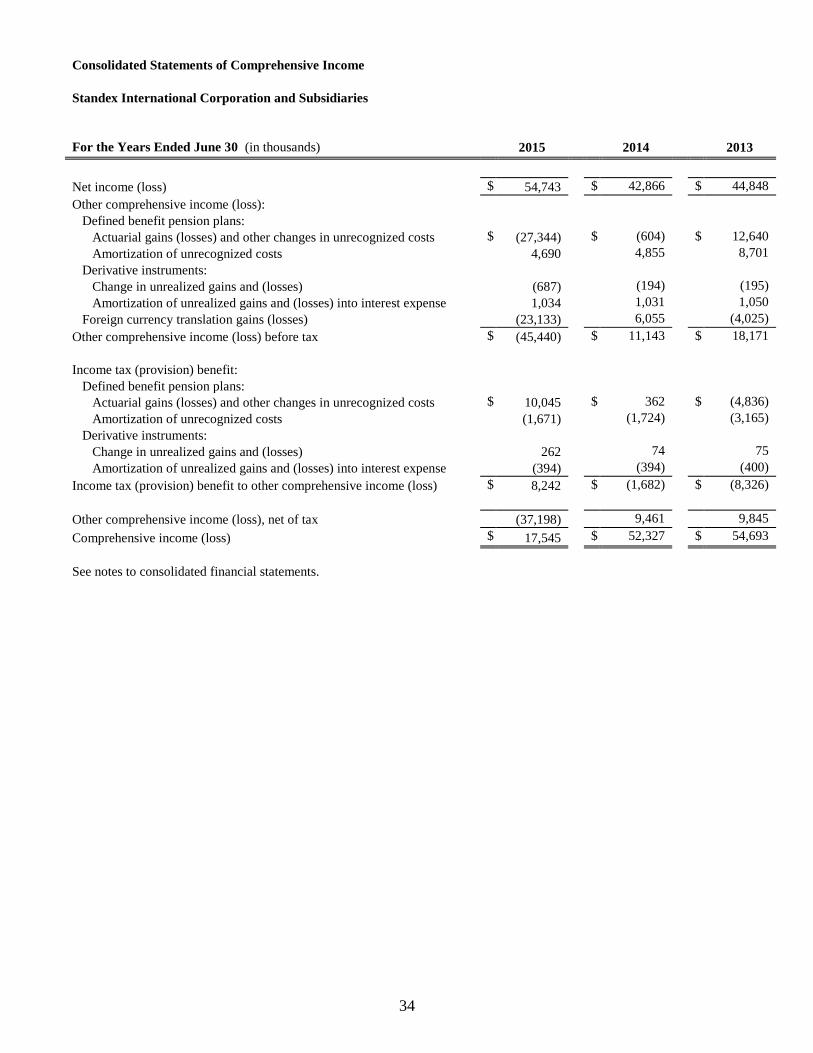
34
Consolidated Statements of Comprehensive Income
Standex International Corporation and Subsidiaries
For the Years Ended June 30 (in thousands) 2015 2014 2013
Net income (loss) $ 54,743 $ 42,866 $ 44,848
Other comprehensive income (loss):
Defined benefit pension plans:
Actuarial gains (losses) and other changes in unrecognized costs $ (27,344) $ (604) $ 12,640
Amortization of unrecognized costs 4,690 4,855 8,701
Derivative instruments:
Change in unrealized gains and (losses) (687) (194) (195)
Amortization of unrealized gains and (losses) into interest expense 1,034 1,031 1,050
Foreign currency translation gains (losses) (23,133) 6,055 (4,025)
Other comprehensive income (loss) before tax $ (45,440) $ 11,143 $ 18,171
Income tax (provision) benefit:
Defined benefit pension plans:
Actuarial gains (losses) and other changes in unrecognized costs $ 10,045 $ 362 $ (4,836)
Amortization of unrecognized costs (1,671) (1,724) (3,165)
Derivative instruments:
Change in unrealized gains and (losses) 262 74 75
Amortization of unrealized gains and (losses) into interest expense (394) (394) (400)
Income tax (provision) benefit to other comprehensive income (loss) $ 8,242 $ (1,682) $ (8,326)
Other comprehensive income (loss), net of tax (37,198) 9,461 9,845
Comprehensive income (loss) $ 17,545 $ 52,327 $ 54,693
See notes to consolidated financial statements.
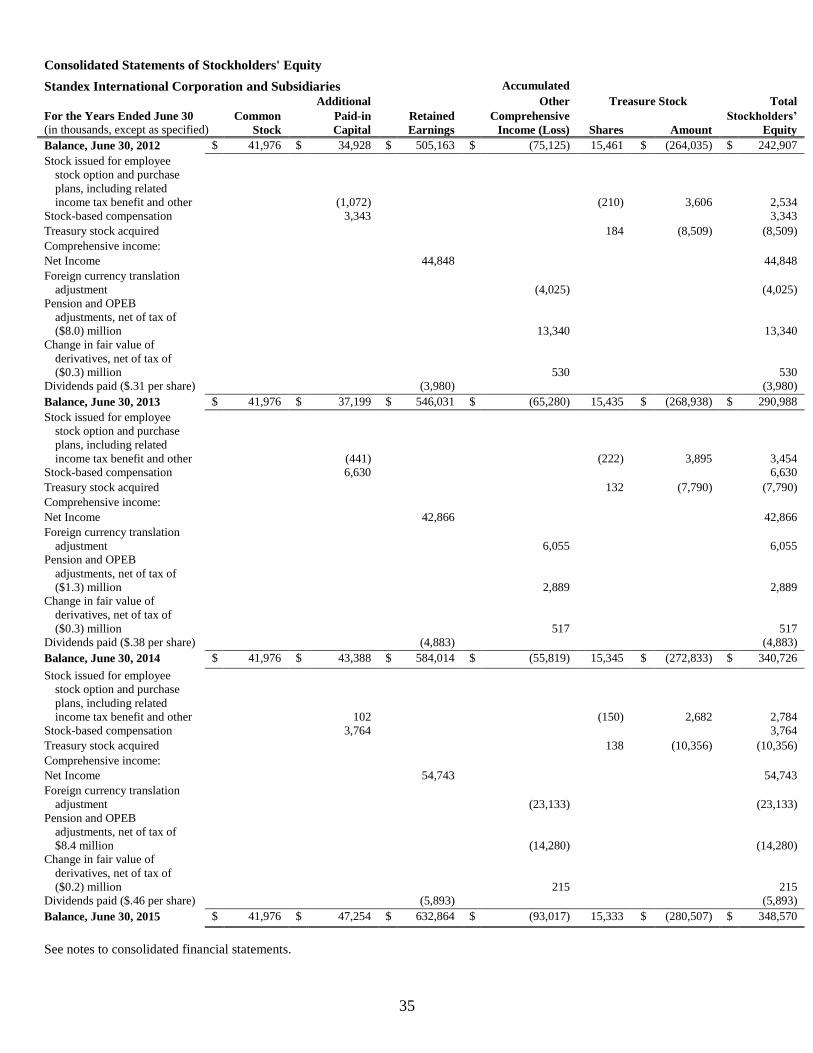
35
Consolidated Statements of Stockholders' Equity
Standex International Corporation and Subsidiaries Accumulated
Additional Other Treasure Stock Total
For the Years Ended June 30
(in thousands, except as specified) Common
Stock
Paid-in
Capital
Retained
Earnings
Comprehensive
Income (Loss)
Shares
Amount
Stockholders’
Equity
Balance, June 30, 2012 $ 41,976 $ 34,928 $ 505,163 $ (75,125) 15,461 $ (264,035) $ 242,907
Stock issued for employee
stock option and purchase
plans, including related
income tax benefit and other
(1,072)
(210)
3,606
2,534
Stock-based compensation 3,343 3,343
Treasury stock acquired 184 (8,509) (8,509)
Comprehensive income:
Net Income 44,848 44,848
Foreign currency translation
adjustment
(4,025)
(4,025)
Pension and OPEB
adjustments, net of tax of
($8.0) million
13,340
13,340
Change in fair value of
derivatives, net of tax of
($0.3) million
530
530
Dividends paid ($.31 per share) (3,980) (3,980)
Balance, June 30, 2013 $ 41,976 $ 37,199 $ 546,031 $ (65,280) 15,435 $ (268,938) $ 290,988
Stock issued for employee
stock option and purchase
plans, including related
income tax benefit and other
(441)
(222)
3,895
3,454
Stock-based compensation 6,630 6,630
Treasury stock acquired 132 (7,790) (7,790)
Comprehensive income:
Net Income 42,866 42,866
Foreign currency translation
adjustment
6,055
6,055
Pension and OPEB
adjustments, net of tax of
($1.3) million
2,889
2,889
Change in fair value of
derivatives, net of tax of
($0.3) million
517
517
Dividends paid ($.38 per share) (4,883) (4,883)
Balance, June 30, 2014 $ 41,976 $ 43,388 $ 584,014 $ (55,819) 15,345 $ (272,833) $ 340,726
Stock issued for employee
stock option and purchase
plans, including related
income tax benefit and other
102
(150)
2,682
2,784
Stock-based compensation 3,764 3,764
Treasury stock acquired 138 (10,356) (10,356)
Comprehensive income:
Net Income 54,743 54,743
Foreign currency translation
adjustment
(23,133)
(23,133)
Pension and OPEB
adjustments, net of tax of
$8.4 million
(14,280)
(14,280)
Change in fair value of
derivatives, net of tax of
($0.2) million
215
215
Dividends paid ($.46 per share) (5,893) (5,893)
Balance, June 30, 2015 $ 41,976 $ 47,254 $ 632,864 $ (93,017) 15,333 $ (280,507) $ 348,570
See notes to consolidated financial statements.
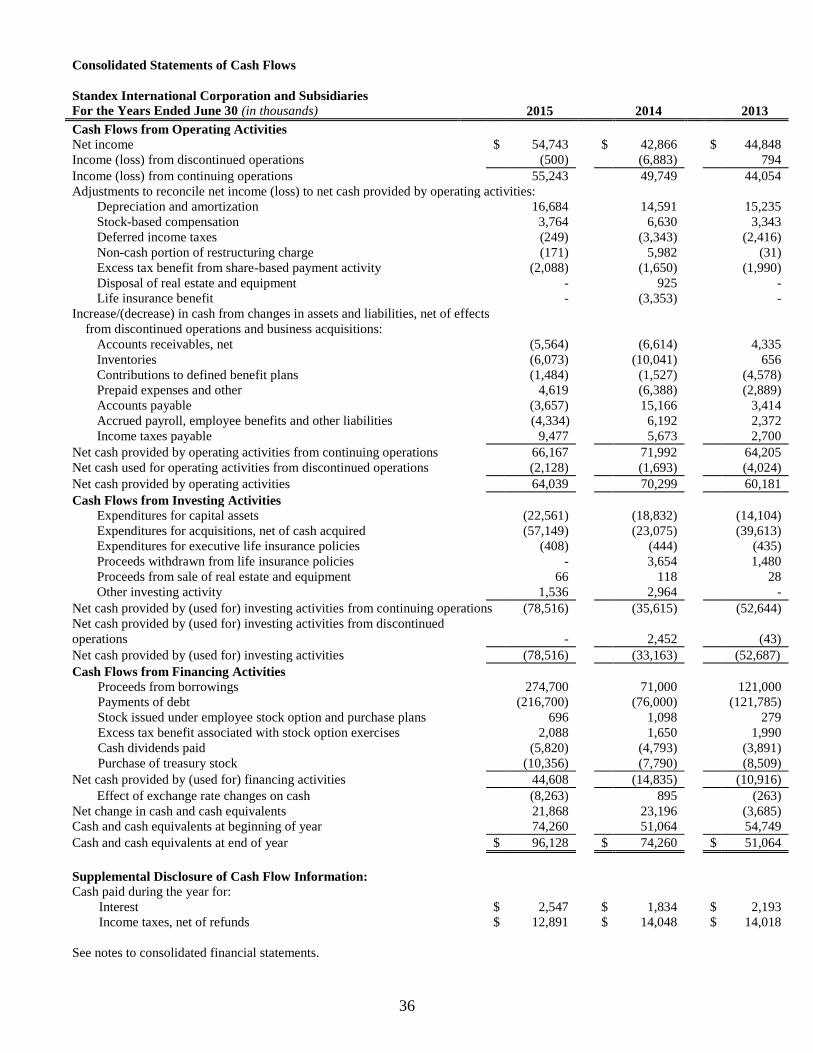
36
Consolidated Statements of Cash Flows
Standex International Corporation and Subsidiaries For the Years Ended June 30 (in thousands) 2015 2014 2013
Cash Flows from Operating Activities Net income $ 54,743 $ 42,866 $ 44,848 Income (loss) from discontinued operations (500) (6,883) 794
Income (loss) from continuing operations 55,243 49,749 44,054 Adjustments to reconcile net income (loss) to net cash provided by operating activities:
Depreciation and amortization 16,684 14,591 15,235 Stock-based compensation 3,764 6,630 3,343 Deferred income taxes (249) (3,343) (2,416) Non-cash portion of restructuring charge (171) 5,982 (31) Excess tax benefit from share-based payment activity (2,088) (1,650) (1,990) Disposal of real estate and equipment - 925 - Life insurance benefit - (3,353) -
Increase/(decrease) in cash from changes in assets and liabilities, net of effects
from discontinued operations and business acquisitions:
Accounts receivables, net (5,564) (6,614) 4,335 Inventories (6,073) (10,041) 656 Contributions to defined benefit plans (1,484) (1,527) (4,578) Prepaid expenses and other 4,619 (6,388) (2,889) Accounts payable (3,657) 15,166 3,414 Accrued payroll, employee benefits and other liabilities (4,334) 6,192 2,372 Income taxes payable 9,477 5,673 2,700
Net cash provided by operating activities from continuing operations 66,167 71,992 64,205 Net cash used for operating activities from discontinued operations (2,128) (1,693) (4,024)
Net cash provided by operating activities 64,039 70,299 60,181
Cash Flows from Investing Activities Expenditures for capital assets (22,561) (18,832) (14,104) Expenditures for acquisitions, net of cash acquired (57,149) (23,075) (39,613) Expenditures for executive life insurance policies (408) (444) (435) Proceeds withdrawn from life insurance policies - 3,654 1,480 Proceeds from sale of real estate and equipment 66 118 28 Other investing activity 1,536 2,964 -
Net cash provided by (used for) investing activities from continuing operations (78,516) (35,615) (52,644) Net cash provided by (used for) investing activities from discontinued
operations
-
2,452
(43)
Net cash provided by (used for) investing activities (78,516) (33,163) (52,687)
Cash Flows from Financing Activities Proceeds from borrowings 274,700 71,000 121,000 Payments of debt (216,700) (76,000) (121,785) Stock issued under employee stock option and purchase plans 696 1,098 279 Excess tax benefit associated with stock option exercises 2,088 1,650 1,990 Cash dividends paid (5,820) (4,793) (3,891) Purchase of treasury stock (10,356) (7,790) (8,509)
Net cash provided by (used for) financing activities 44,608 (14,835) (10,916)
Effect of exchange rate changes on cash (8,263) 895 (263) Net change in cash and cash equivalents 21,868 23,196 (3,685) Cash and cash equivalents at beginning of year 74,260 51,064 54,749
Cash and cash equivalents at end of year $ 96,128 $ 74,260 $ 51,064
Supplemental Disclosure of Cash Flow Information: Cash paid during the year for: Interest $ 2,547 $ 1,834 $ 2,193 Income taxes, net of refunds $ 12,891 $ 14,048 $ 14,018
See notes to consolidated financial statements.
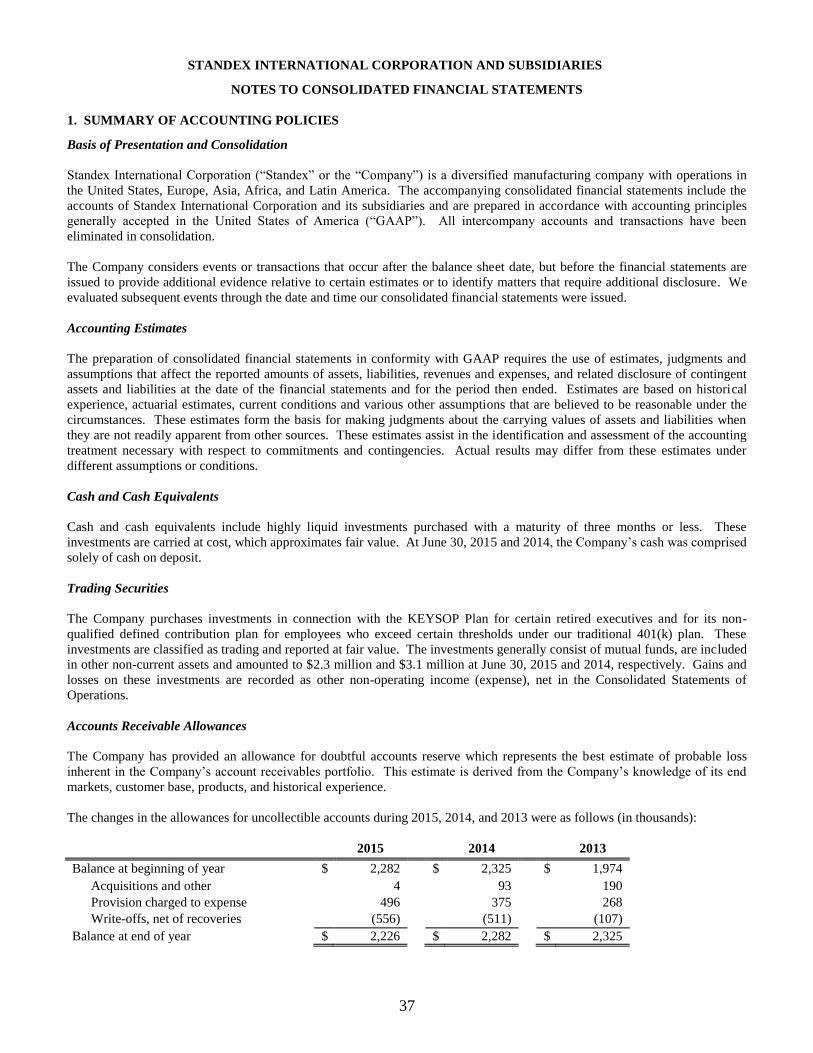
37
STANDEX INTERNATIONAL CORPORATION AND SUBSIDIARIES
NOTES TO CONSOLIDATED FINANCIAL STATEMENTS
1. SUMMARY OF ACCOUNTING POLICIES
Basis of Presentation and Consolidation
Standex International Corporation (“Standex” or the “Company”) is a diversified manufacturing company with operations in
the United States, Europe, Asia, Africa, and Latin America. The accompanying consolidated financial statements include the
accounts of Standex International Corporation and its subsidiaries and are prepared in accordance with accounting principles
generally accepted in the United States of America (“GAAP”). All intercompany accounts and transactions have been
eliminated in consolidation.
The Company considers events or transactions that occur after the balance sheet date, but before the financial statements are
issued to provide additional evidence relative to certain estimates or to identify matters that require additional disclosure. We
evaluated subsequent events through the date and time our consolidated financial statements were issued.
Accounting Estimates
The preparation of consolidated financial statements in conformity with GAAP requires the use of estimates, judgments and
assumptions that affect the reported amounts of assets, liabilities, revenues and expenses, and related disclosure of contingent
assets and liabilities at the date of the financial statements and for the period then ended. Estimates are based on historical
experience, actuarial estimates, current conditions and various other assumptions that are believed to be reasonable under the
circumstances. These estimates form the basis for making judgments about the carrying values of assets and liabilities when
they are not readily apparent from other sources. These estimates assist in the identification and assessment of the accounting
treatment necessary with respect to commitments and contingencies. Actual results may differ from these estimates under
different assumptions or conditions.
Cash and Cash Equivalents
Cash and cash equivalents include highly liquid investments purchased with a maturity of three months or less. These
investments are carried at cost, which approximates fair value. At June 30, 2015 and 2014, the Company’s cash was comprised
solely of cash on deposit.
Trading Securities
The Company purchases investments in connection with the KEYSOP Plan for certain retired executives and for its non-
qualified defined contribution plan for employees who exceed certain thresholds under our traditional 401(k) plan. These
investments are classified as trading and reported at fair value. The investments generally consist of mutual funds, are included
in other non-current assets and amounted to $2.3 million and $3.1 million at June 30, 2015 and 2014, respectively. Gains and
losses on these investments are recorded as other non-operating income (expense), net in the Consolidated Statements of
Operations.
Accounts Receivable Allowances
The Company has provided an allowance for doubtful accounts reserve which represents the best estimate of probable loss
inherent in the Company’s account receivables portfolio. This estimate is derived from the Company’s knowledge of its end
markets, customer base, products, and historical experience.
The changes in the allowances for uncollectible accounts during 2015, 2014, and 2013 were as follows (in thousands):
2015 2014 2013
Balance at beginning of year $ 2,282 $ 2,325 $ 1,974
Acquisitions and other 4 93 190
Provision charged to expense 496 375 268
Write-offs, net of recoveries (556) (511) (107)
Balance at end of year $ 2,226 $ 2,282 $ 2,325
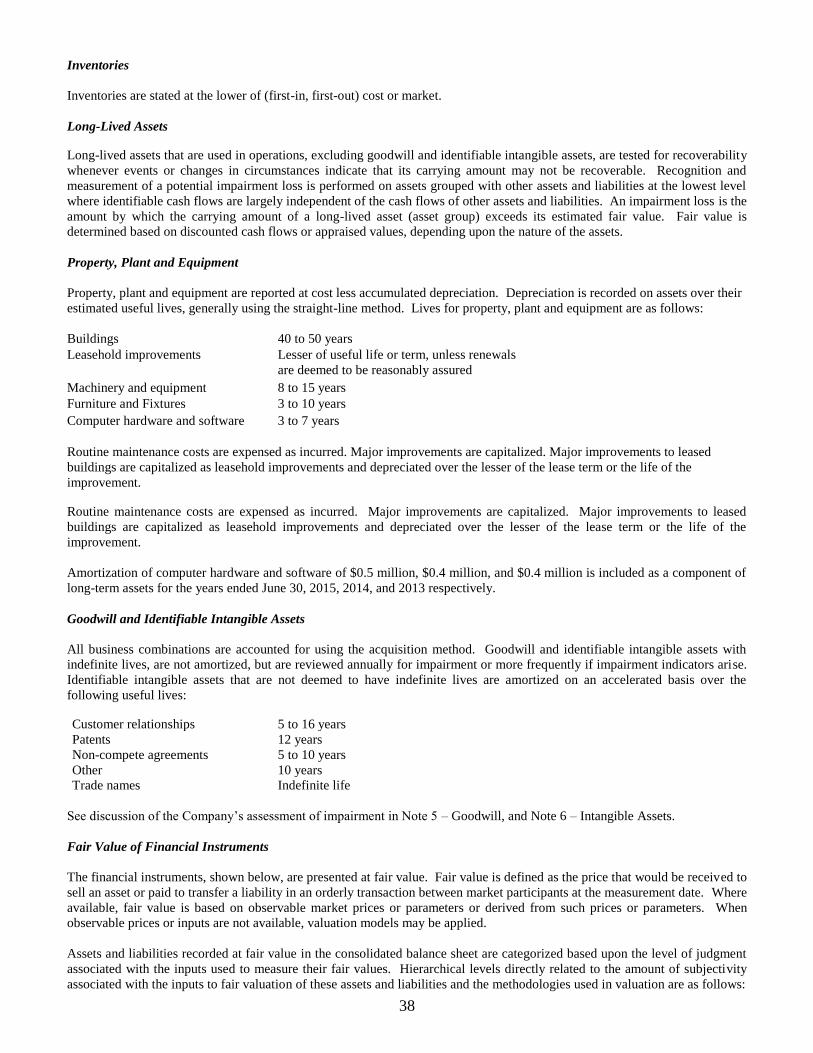
38
Inventories
Inventories are stated at the lower of (first-in, first-out) cost or market.
Long-Lived Assets
Long-lived assets that are used in operations, excluding goodwill and identifiable intangible assets, are tested for recoverability
whenever events or changes in circumstances indicate that its carrying amount may not be recoverable. Recognition and
measurement of a potential impairment loss is performed on assets grouped with other assets and liabilities at the lowest level
where identifiable cash flows are largely independent of the cash flows of other assets and liabilities. An impairment loss is the
amount by which the carrying amount of a long-lived asset (asset group) exceeds its estimated fair value. Fair value is
determined based on discounted cash flows or appraised values, depending upon the nature of the assets.
Property, Plant and Equipment
Property, plant and equipment are reported at cost less accumulated depreciation. Depreciation is recorded on assets over their
estimated useful lives, generally using the straight-line method. Lives for property, plant and equipment are as follows:
Buildings 40 to 50 years
Leasehold improvements Lesser of useful life or term, unless renewals
are deemed to be reasonably assured
Machinery and equipment 8 to 15 years
Furniture and Fixtures 3 to 10 years
Computer hardware and software 3 to 7 years
Routine maintenance costs are expensed as incurred. Major improvements are capitalized. Major improvements to leased
buildings are capitalized as leasehold improvements and depreciated over the lesser of the lease term or the life of the
improvement.
Routine maintenance costs are expensed as incurred. Major improvements are capitalized. Major improvements to leased
buildings are capitalized as leasehold improvements and depreciated over the lesser of the lease term or the life of the
improvement.
Amortization of computer hardware and software of $0.5 million, $0.4 million, and $0.4 million is included as a component of
long-term assets for the years ended June 30, 2015, 2014, and 2013 respectively.
Goodwill and Identifiable Intangible Assets
All business combinations are accounted for using the acquisition method. Goodwill and identifiable intangible assets with
indefinite lives, are not amortized, but are reviewed annually for impairment or more frequently if impairment indicators arise.
Identifiable intangible assets that are not deemed to have indefinite lives are amortized on an accelerated basis over the
following useful lives:
Customer relationships 5 to 16 years
Patents 12 years
Non-compete agreements 5 to 10 years
Other 10 years
Trade names Indefinite life
See discussion of the Company’s assessment of impairment in Note 5 – Goodwill, and Note 6 – Intangible Assets.
Fair Value of Financial Instruments
The financial instruments, shown below, are presented at fair value. Fair value is defined as the price that would be received to
sell an asset or paid to transfer a liability in an orderly transaction between market participants at the measurement date. Where
available, fair value is based on observable market prices or parameters or derived from such prices or parameters. When
observable prices or inputs are not available, valuation models may be applied.
Assets and liabilities recorded at fair value in the consolidated balance sheet are categorized based upon the level of judgment
associated with the inputs used to measure their fair values. Hierarchical levels directly related to the amount of subjectivity
associated with the inputs to fair valuation of these assets and liabilities and the methodologies used in valuation are as follows:
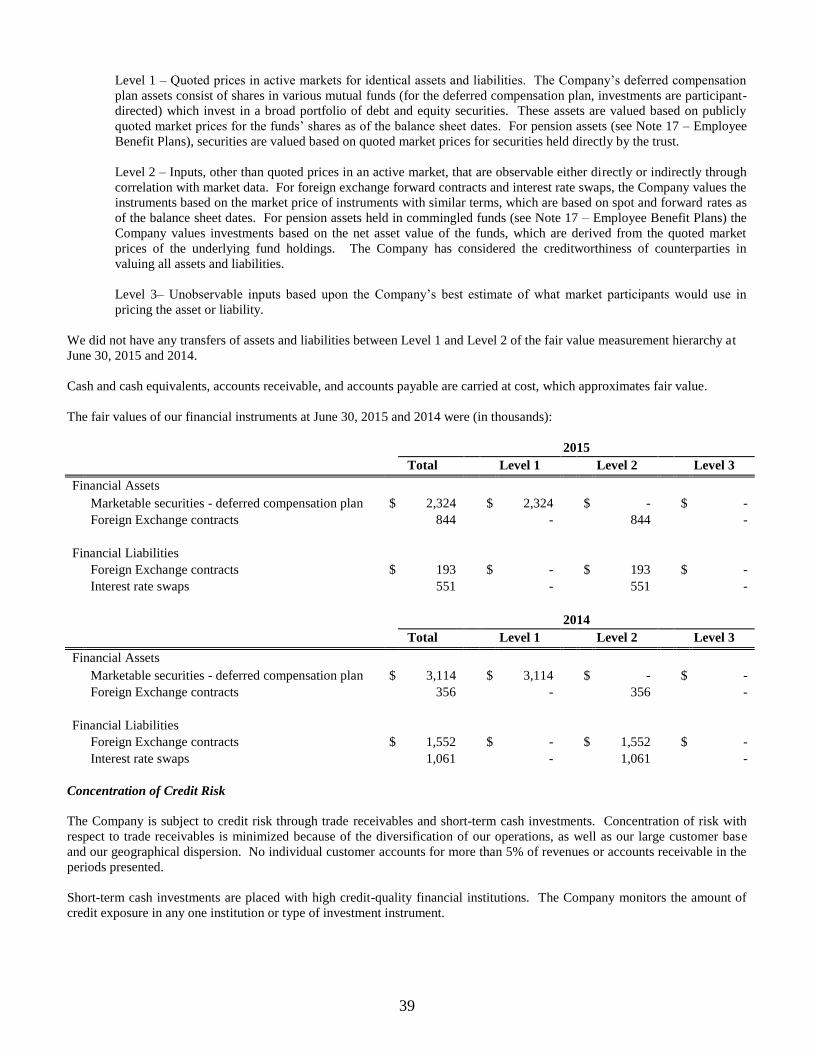
39
Level 1 – Quoted prices in active markets for identical assets and liabilities. The Company’s deferred compensation
plan assets consist of shares in various mutual funds (for the deferred compensation plan, investments are participant-
directed) which invest in a broad portfolio of debt and equity securities. These assets are valued based on publicly
quoted market prices for the funds’ shares as of the balance sheet dates. For pension assets (see Note 17 – Employee
Benefit Plans), securities are valued based on quoted market prices for securities held directly by the trust.
Level 2 – Inputs, other than quoted prices in an active market, that are observable either directly or indirectly through
correlation with market data. For foreign exchange forward contracts and interest rate swaps, the Company values the
instruments based on the market price of instruments with similar terms, which are based on spot and forward rates as
of the balance sheet dates. For pension assets held in commingled funds (see Note 17 – Employee Benefit Plans) the
Company values investments based on the net asset value of the funds, which are derived from the quoted market
prices of the underlying fund holdings. The Company has considered the creditworthiness of counterparties in
valuing all assets and liabilities.
Level 3– Unobservable inputs based upon the Company’s best estimate of what market participants would use in
pricing the asset or liability.
We did not have any transfers of assets and liabilities between Level 1 and Level 2 of the fair value measurement hierarchy at
June 30, 2015 and 2014.
Cash and cash equivalents, accounts receivable, and accounts payable are carried at cost, which approximates fair value.
The fair values of our financial instruments at June 30, 2015 and 2014 were (in thousands):
2015
Total Level 1 Level 2 Level 3
Financial Assets
Marketable securities - deferred compensation plan $ 2,324 $ 2,324 $ - $ -
Foreign Exchange contracts 844 - 844 -
Financial Liabilities
Foreign Exchange contracts $ 193 $ - $ 193 $ -
Interest rate swaps 551 - 551 -
2014
Total Level 1 Level 2 Level 3
Financial Assets
Marketable securities - deferred compensation plan $ 3,114 $ 3,114 $ - $ -
Foreign Exchange contracts 356 - 356 -
Financial Liabilities
Foreign Exchange contracts $ 1,552 $ - $ 1,552 $ -
Interest rate swaps 1,061 - 1,061 -
Concentration of Credit Risk
The Company is subject to credit risk through trade receivables and short-term cash investments. Concentration of risk with
respect to trade receivables is minimized because of the diversification of our operations, as well as our large customer base
and our geographical dispersion. No individual customer accounts for more than 5% of revenues or accounts receivable in the
periods presented.
Short-term cash investments are placed with high credit-quality financial institutions. The Company monitors the amount of
credit exposure in any one institution or type of investment instrument.

40
Revenue Recognition
The Company’s product sales are recorded when persuasive evidence of an arrangement exists, delivery has occurred, the price
to the buyer is fixed or determinable, and collectability is reasonably assured. For products that include installation, and if the
installation meets the criteria to be considered a separate element, product revenue is recognized upon delivery, and installation
revenue is recognized when the installation is complete. Revenues under certain fixed price contracts are generally recorded
when deliveries are made.
Sales and estimated profits under certain long-term contracts are recognized under the percentage-of-completion methods of
accounting, whereby profits are recorded pro rata, based upon current estimates of costs to complete such contracts. Losses on
contracts are provided for in the period in which the losses become determinable. Revisions in profit estimates are reflected on
a cumulative basis in the period in which the basis for such revision becomes known. Any excess of the billings over cost and
estimated earnings on long-term contracts is included in deferred revenue.
Cost of Goods Sold and Selling, General and Administrative Expenses
The Company includes expenses in either cost of goods sold or selling, general and administrative categories based upon the
natural classification of the expenses. Cost of goods sold includes expenses associated with the acquisition, inspection,
manufacturing and receiving of materials for use in the manufacturing process. These costs include inbound freight charges,
purchasing and receiving costs, inspection costs, warehousing costs, internal transfer costs as well as depreciation,
amortization, wages, benefits and other costs that are incurred directly or indirectly to support the manufacturing process.
Selling, general and administrative includes expenses associated with the distribution of our products, sales effort,
administration costs and other costs that are not incurred to support the manufacturing process. The Company records
distribution costs associated with the sale of inventory as a component of selling, general and administrative expenses in the
Consolidated Statements of Operations. These expenses include warehousing costs, outbound freight charges and costs
associated with distribution personnel. Our gross profit margins may not be comparable to those of other entities due to
different classifications of costs and expenses.
Our total advertising expenses, which are classified under selling, general, and administrative expenses are primarily related to
trade shows, and totaled $5.0 million, $4.6 million, and $4.6 million for the years ended June 30, 2015, 2014, and 2013,
respectively.
Research and Development
Research and development expenditures are expensed as incurred. Total research and development costs, which are classified
under selling, general, and administrative expenses, were $4.1 million, $4.8 million, and $4.4 million for the years ended June
30, 2015, 2014, and 2013, respectively.
Warranties
The expected cost associated with warranty obligations on our products is recorded when the revenue is recognized. The
Company’s estimate of warranty cost is based on contract terms and historical warranty loss experience that is periodically
adjusted for recent actual experience. Since warranty estimates are forecasts based on the best available information, claims
costs may differ from amounts provided. Adjustments to initial obligations for warranties are made as changes in the
obligations become reasonably estimable.
The changes in continuing operations warranty reserve, which are recorded as accrued liabilities, during 2015, 2014, and 2013
were as follows (in thousands):
2015 2014 2013
Balance at beginning of year $ 6,941 $ 6,782 $ 5,767
Acquisitions 3 274 795
Warranty expense 11,086 3,937 4,282
Warranty claims (10,594) (4,052) (4,062)
Balance at end of year $ 7,436 $ 6,941 $ 6,782
Stock-Based Compensation Plans
Restricted stock awards generally vest over a three-year period. Compensation expense associated with these awards is
recorded based on their grant-date fair values and is generally recognized on a straight-line basis over the vesting period except
for awards with performance conditions, which are recognized on a graded vesting schedule. Compensation cost for an award
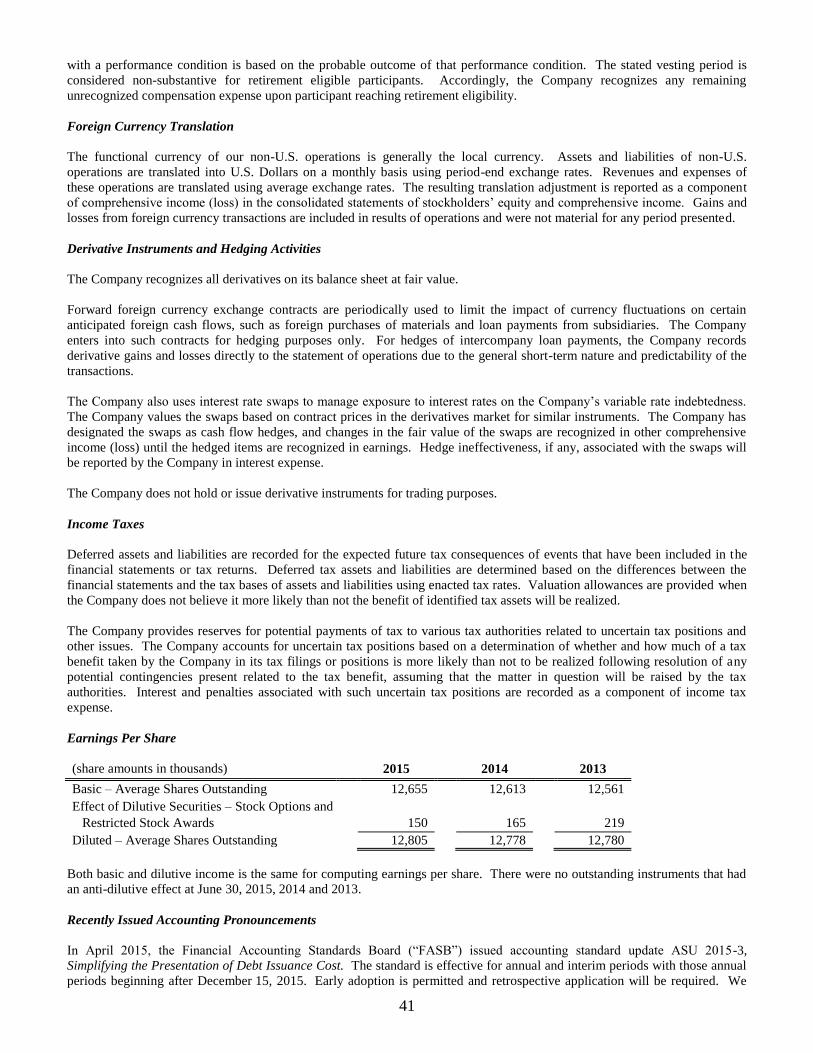
41
with a performance condition is based on the probable outcome of that performance condition. The stated vesting period is
considered non-substantive for retirement eligible participants. Accordingly, the Company recognizes any remaining
unrecognized compensation expense upon participant reaching retirement eligibility.
Foreign Currency Translation
The functional currency of our non-U.S. operations is generally the local currency. Assets and liabilities of non-U.S.
operations are translated into U.S. Dollars on a monthly basis using period-end exchange rates. Revenues and expenses of
these operations are translated using average exchange rates. The resulting translation adjustment is reported as a component
of comprehensive income (loss) in the consolidated statements of stockholders’ equity and comprehensive income. Gains and
losses from foreign currency transactions are included in results of operations and were not material for any period presented.
Derivative Instruments and Hedging Activities
The Company recognizes all derivatives on its balance sheet at fair value.
Forward foreign currency exchange contracts are periodically used to limit the impact of currency fluctuations on certain
anticipated foreign cash flows, such as foreign purchases of materials and loan payments from subsidiaries. The Company
enters into such contracts for hedging purposes only. For hedges of intercompany loan payments, the Company records
derivative gains and losses directly to the statement of operations due to the general short-term nature and predictability of the
transactions.
The Company also uses interest rate swaps to manage exposure to interest rates on the Company’s variable rate indebtedness.
The Company values the swaps based on contract prices in the derivatives market for similar instruments. The Company has
designated the swaps as cash flow hedges, and changes in the fair value of the swaps are recognized in other comprehensive
income (loss) until the hedged items are recognized in earnings. Hedge ineffectiveness, if any, associated with the swaps will
be reported by the Company in interest expense.
The Company does not hold or issue derivative instruments for trading purposes.
Income Taxes
Deferred assets and liabilities are recorded for the expected future tax consequences of events that have been included in the
financial statements or tax returns. Deferred tax assets and liabilities are determined based on the differences between the
financial statements and the tax bases of assets and liabilities using enacted tax rates. Valuation allowances are provided when
the Company does not believe it more likely than not the benefit of identified tax assets will be realized.
The Company provides reserves for potential payments of tax to various tax authorities related to uncertain tax positions and
other issues. The Company accounts for uncertain tax positions based on a determination of whether and how much of a tax
benefit taken by the Company in its tax filings or positions is more likely than not to be realized following resolution of any
potential contingencies present related to the tax benefit, assuming that the matter in question will be raised by the tax
authorities. Interest and penalties associated with such uncertain tax positions are recorded as a component of income tax
expense.
Earnings Per Share
(share amounts in thousands) 2015 2014 2013
Basic – Average Shares Outstanding 12,655 12,613 12,561
Effect of Dilutive Securities – Stock Options and
Restricted Stock Awards 150 165 219
Diluted – Average Shares Outstanding 12,805 12,778 12,780
Both basic and dilutive income is the same for computing earnings per share. There were no outstanding instruments that had
an anti-dilutive effect at June 30, 2015, 2014 and 2013.
Recently Issued Accounting Pronouncements
In April 2015, the Financial Accounting Standards Board (“FASB”) issued accounting standard update ASU 2015-3,
Simplifying the Presentation of Debt Issuance Cost. The standard is effective for annual and interim periods with those annual
periods beginning after December 15, 2015. Early adoption is permitted and retrospective application will be required. We
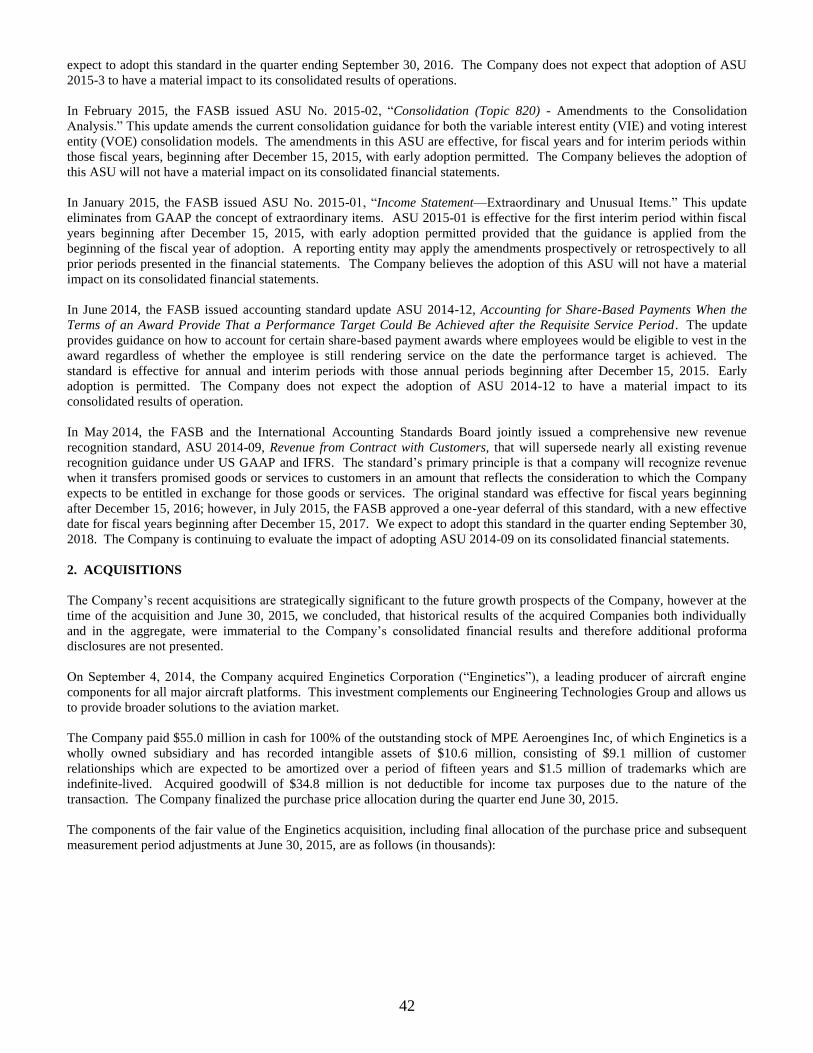
42
expect to adopt this standard in the quarter ending September 30, 2016. The Company does not expect that adoption of ASU
2015-3 to have a material impact to its consolidated results of operations.
In February 2015, the FASB issued ASU No. 2015-02, “Consolidation (Topic 820) - Amendments to the Consolidation
Analysis.” This update amends the current consolidation guidance for both the variable interest entity (VIE) and voting interest
entity (VOE) consolidation models. The amendments in this ASU are effective, for fiscal years and for interim periods within
those fiscal years, beginning after December 15, 2015, with early adoption permitted. The Company believes the adoption of
this ASU will not have a material impact on its consolidated financial statements.
In January 2015, the FASB issued ASU No. 2015-01, “Income Statement—Extraordinary and Unusual Items.” This update
eliminates from GAAP the concept of extraordinary items. ASU 2015-01 is effective for the first interim period within fiscal
years beginning after December 15, 2015, with early adoption permitted provided that the guidance is applied from the
beginning of the fiscal year of adoption. A reporting entity may apply the amendments prospectively or retrospectively to all
prior periods presented in the financial statements. The Company believes the adoption of this ASU will not have a material
impact on its consolidated financial statements.
In June 2014, the FASB issued accounting standard update ASU 2014-12, Accounting for Share-Based Payments When the
Terms of an Award Provide That a Performance Target Could Be Achieved after the Requisite Service Period. The update
provides guidance on how to account for certain share-based payment awards where employees would be eligible to vest in the
award regardless of whether the employee is still rendering service on the date the performance target is achieved. The
standard is effective for annual and interim periods with those annual periods beginning after December 15, 2015. Early
adoption is permitted. The Company does not expect the adoption of ASU 2014-12 to have a material impact to its
consolidated results of operation.
In May 2014, the FASB and the International Accounting Standards Board jointly issued a comprehensive new revenue
recognition standard, ASU 2014-09, Revenue from Contract with Customers, that will supersede nearly all existing revenue
recognition guidance under US GAAP and IFRS. The standard’s primary principle is that a company will recognize revenue
when it transfers promised goods or services to customers in an amount that reflects the consideration to which the Company
expects to be entitled in exchange for those goods or services. The original standard was effective for fiscal years beginning
after December 15, 2016; however, in July 2015, the FASB approved a one-year deferral of this standard, with a new effective
date for fiscal years beginning after December 15, 2017. We expect to adopt this standard in the quarter ending September 30,
2018. The Company is continuing to evaluate the impact of adopting ASU 2014-09 on its consolidated financial statements.
2. ACQUISITIONS
The Company’s recent acquisitions are strategically significant to the future growth prospects of the Company, however at the
time of the acquisition and June 30, 2015, we concluded, that historical results of the acquired Companies both individually
and in the aggregate, were immaterial to the Company’s consolidated financial results and therefore additional proforma
disclosures are not presented.
On September 4, 2014, the Company acquired Enginetics Corporation (“Enginetics”), a leading producer of aircraft engine
components for all major aircraft platforms. This investment complements our Engineering Technologies Group and allows us
to provide broader solutions to the aviation market.
The Company paid $55.0 million in cash for 100% of the outstanding stock of MPE Aeroengines Inc, of which Enginetics is a
wholly owned subsidiary and has recorded intangible assets of $10.6 million, consisting of $9.1 million of customer
relationships which are expected to be amortized over a period of fifteen years and $1.5 million of trademarks which are
indefinite-lived. Acquired goodwill of $34.8 million is not deductible for income tax purposes due to the nature of the
transaction. The Company finalized the purchase price allocation during the quarter end June 30, 2015.
The components of the fair value of the Enginetics acquisition, including final allocation of the purchase price and subsequent
measurement period adjustments at June 30, 2015, are as follows (in thousands):
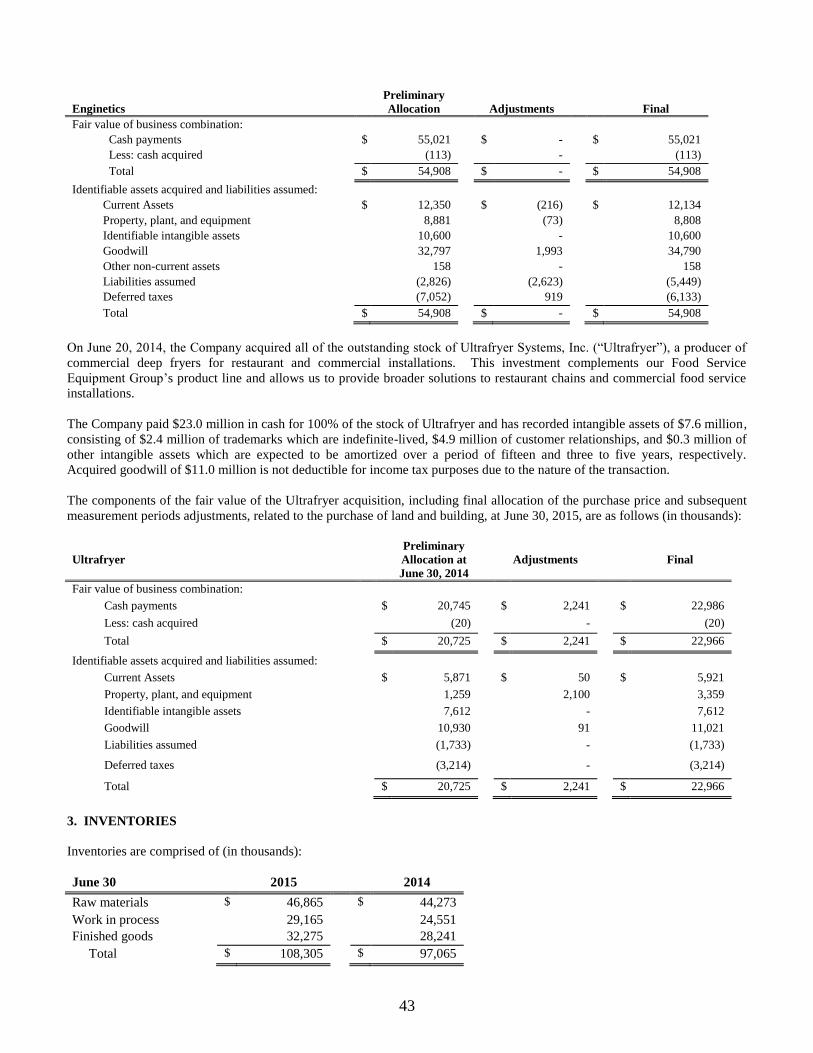
43
Enginetics
Preliminary
Allocation
Adjustments
Final
Fair value of business combination:
Cash payments $ 55,021 $ - $ 55,021
Less: cash acquired (113) - (113)
Total $ 54,908 $ - $ 54,908
Identifiable assets acquired and liabilities assumed:
Current Assets $ 12,350 $ (216) $ 12,134
Property, plant, and equipment 8,881 (73) 8,808
Identifiable intangible assets 10,600 - 10,600
Goodwill 32,797 1,993 34,790
Other non-current assets 158 - 158
Liabilities assumed (2,826) (2,623) (5,449)
Deferred taxes (7,052) 919 (6,133)
Total $ 54,908 $ - $ 54,908
On June 20, 2014, the Company acquired all of the outstanding stock of Ultrafryer Systems, Inc. (“Ultrafryer”), a producer of
commercial deep fryers for restaurant and commercial installations. This investment complements our Food Service
Equipment Group’s product line and allows us to provide broader solutions to restaurant chains and commercial food service
installations.
The Company paid $23.0 million in cash for 100% of the stock of Ultrafryer and has recorded intangible assets of $7.6 million,
consisting of $2.4 million of trademarks which are indefinite-lived, $4.9 million of customer relationships, and $0.3 million of
other intangible assets which are expected to be amortized over a period of fifteen and three to five years, respectively.
Acquired goodwill of $11.0 million is not deductible for income tax purposes due to the nature of the transaction.
The components of the fair value of the Ultrafryer acquisition, including final allocation of the purchase price and subsequent
measurement periods adjustments, related to the purchase of land and building, at June 30, 2015, are as follows (in thousands):
Ultrafryer
Preliminary
Allocation at
June 30, 2014
Adjustments
Final
Fair value of business combination:
Cash payments $ 20,745 $ 2,241 $ 22,986
Less: cash acquired (20) - (20)
Total $ 20,725 $ 2,241 $ 22,966
Identifiable assets acquired and liabilities assumed:
Current Assets $ 5,871 $ 50 $ 5,921
Property, plant, and equipment 1,259 2,100 3,359
Identifiable intangible assets 7,612 - 7,612
Goodwill 10,930 91 11,021
Liabilities assumed (1,733) - (1,733)
Deferred taxes (3,214) - (3,214)
Total $ 20,725 $ 2,241 $ 22,966
3. INVENTORIES
Inventories are comprised of (in thousands):
June 30 2015 2014
Raw materials $ 46,865 $ 44,273
Work in process 29,165 24,551
Finished goods 32,275 28,241
Total $ 108,305 $ 97,065
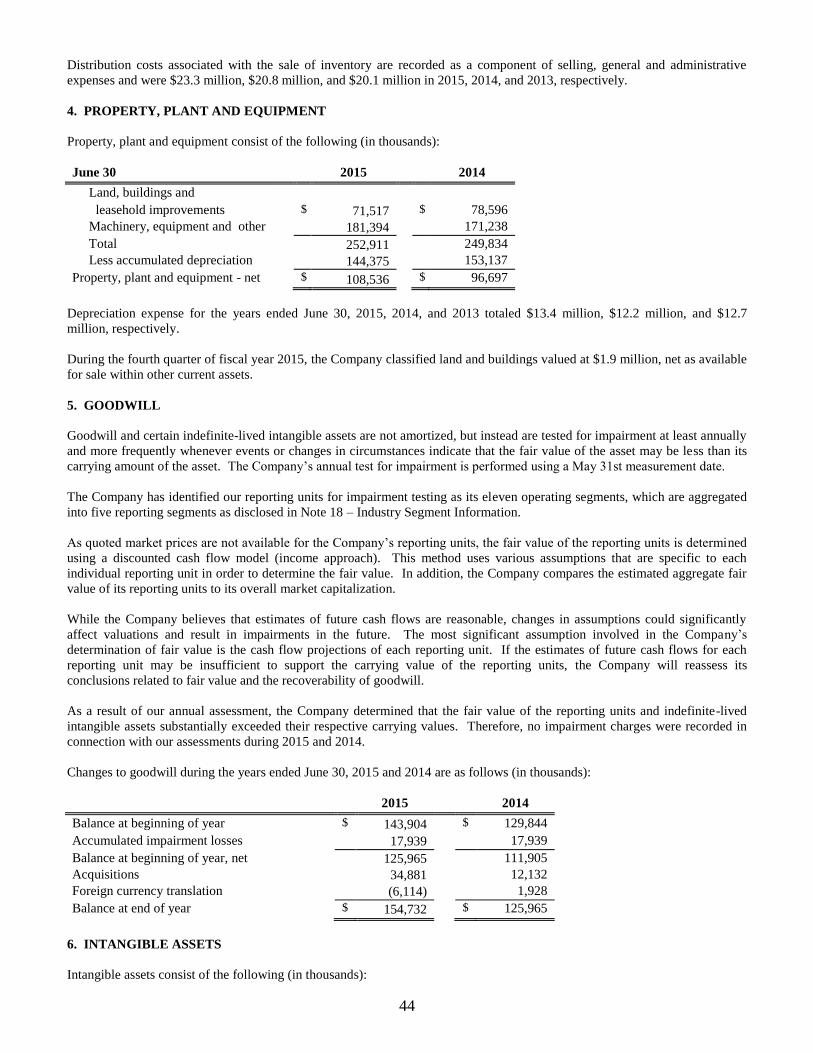
44
Distribution costs associated with the sale of inventory are recorded as a component of selling, general and administrative
expenses and were $23.3 million, $20.8 million, and $20.1 million in 2015, 2014, and 2013, respectively.
4. PROPERTY, PLANT AND EQUIPMENT
Property, plant and equipment consist of the following (in thousands):
June 30 2015 2014
Land, buildings and
leasehold improvements $ 71,517 $ 78,596
Machinery, equipment and other 181,394 171,238
Total 252,911 249,834
Less accumulated depreciation 144,375 153,137
Property, plant and equipment - net $ 108,536 $ 96,697
Depreciation expense for the years ended June 30, 2015, 2014, and 2013 totaled $13.4 million, $12.2 million, and $12.7
million, respectively.
During the fourth quarter of fiscal year 2015, the Company classified land and buildings valued at $1.9 million, net as available
for sale within other current assets.
5. GOODWILL
Goodwill and certain indefinite-lived intangible assets are not amortized, but instead are tested for impairment at least annually
and more frequently whenever events or changes in circumstances indicate that the fair value of the asset may be less than its
carrying amount of the asset. The Company’s annual test for impairment is performed using a May 31st measurement date.
The Company has identified our reporting units for impairment testing as its eleven operating segments, which are aggregated
into five reporting segments as disclosed in Note 18 – Industry Segment Information.
As quoted market prices are not available for the Company’s reporting units, the fair value of the reporting units is determined
using a discounted cash flow model (income approach). This method uses various assumptions that are specific to each
individual reporting unit in order to determine the fair value. In addition, the Company compares the estimated aggregate fair
value of its reporting units to its overall market capitalization.
While the Company believes that estimates of future cash flows are reasonable, changes in assumptions could significantly
affect valuations and result in impairments in the future. The most significant assumption involved in the Company’s
determination of fair value is the cash flow projections of each reporting unit. If the estimates of future cash flows for each
reporting unit may be insufficient to support the carrying value of the reporting units, the Company will reassess its
conclusions related to fair value and the recoverability of goodwill.
As a result of our annual assessment, the Company determined that the fair value of the reporting units and indefinite-lived
intangible assets substantially exceeded their respective carrying values. Therefore, no impairment charges were recorded in
connection with our assessments during 2015 and 2014.
Changes to goodwill during the years ended June 30, 2015 and 2014 are as follows (in thousands):
2015 2014
Balance at beginning of year $ 143,904 $ 129,844
Accumulated impairment losses 17,939 17,939
Balance at beginning of year, net 125,965 111,905
Acquisitions 34,881 12,132
Foreign currency translation (6,114) 1,928
Balance at end of year $ 154,732 $ 125,965
6. INTANGIBLE ASSETS
Intangible assets consist of the following (in thousands):
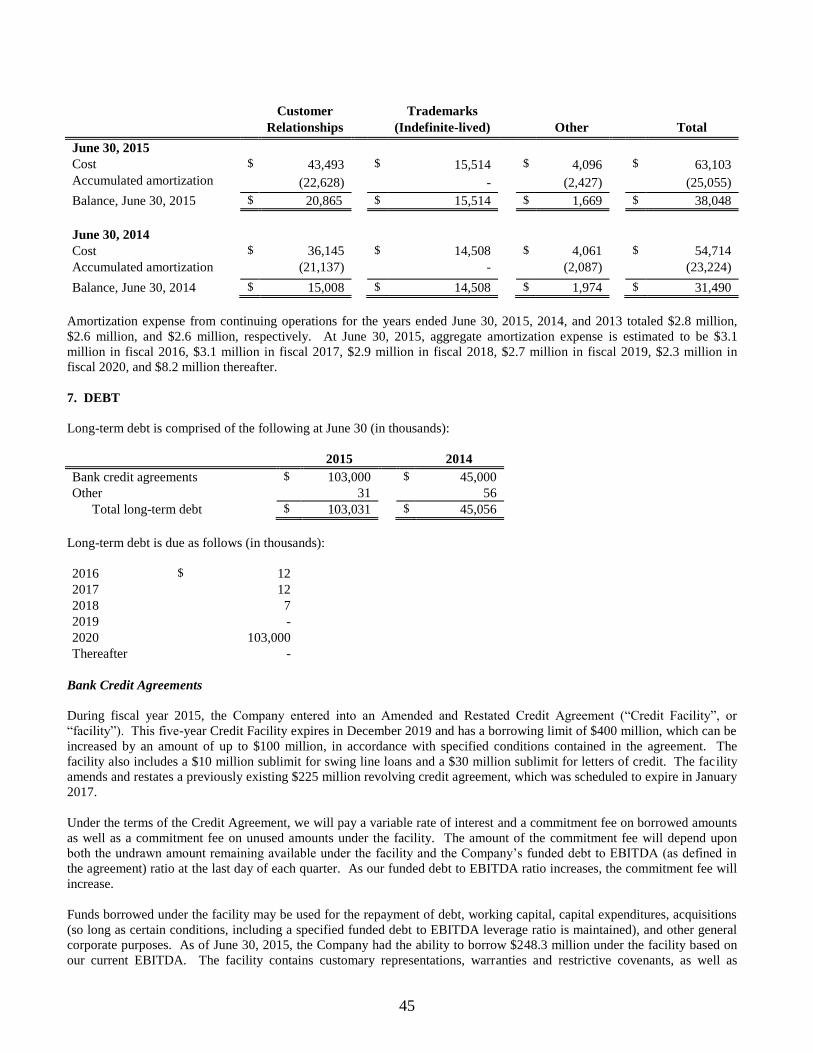
45
Customer Trademarks
Relationships (Indefinite-lived) Other Total
June 30, 2015
Cost $ 43,493 $ 15,514 $ 4,096 $ 63,103
Accumulated amortization (22,628) - (2,427) (25,055)
Balance, June 30, 2015 $ 20,865 $ 15,514 $ 1,669 $ 38,048
June 30, 2014
Cost $ 36,145 $ 14,508 $ 4,061 $ 54,714
Accumulated amortization (21,137) - (2,087) (23,224)
Balance, June 30, 2014 $ 15,008 $ 14,508 $ 1,974 $ 31,490
Amortization expense from continuing operations for the years ended June 30, 2015, 2014, and 2013 totaled $2.8 million,
$2.6 million, and $2.6 million, respectively. At June 30, 2015, aggregate amortization expense is estimated to be $3.1
million in fiscal 2016, $3.1 million in fiscal 2017, $2.9 million in fiscal 2018, $2.7 million in fiscal 2019, $2.3 million in
fiscal 2020, and $8.2 million thereafter.
7. DEBT
Long-term debt is comprised of the following at June 30 (in thousands):
2015 2014
Bank credit agreements $ 103,000 $ 45,000
Other 31 56
Total long-term debt $ 103,031 $ 45,056
Long-term debt is due as follows (in thousands):
2016 $ 12
2017 12
2018 7
2019 -
2020 103,000
Thereafter -
Bank Credit Agreements
During fiscal year 2015, the Company entered into an Amended and Restated Credit Agreement (“Credit Facility”, or
“facility”). This five-year Credit Facility expires in December 2019 and has a borrowing limit of $400 million, which can be
increased by an amount of up to $100 million, in accordance with specified conditions contained in the agreement. The
facility also includes a $10 million sublimit for swing line loans and a $30 million sublimit for letters of credit. The facility
amends and restates a previously existing $225 million revolving credit agreement, which was scheduled to expire in January
2017.
Under the terms of the Credit Agreement, we will pay a variable rate of interest and a commitment fee on borrowed amounts
as well as a commitment fee on unused amounts under the facility. The amount of the commitment fee will depend upon
both the undrawn amount remaining available under the facility and the Company’s funded debt to EBITDA (as defined in
the agreement) ratio at the last day of each quarter. As our funded debt to EBITDA ratio increases, the commitment fee will
increase.
Funds borrowed under the facility may be used for the repayment of debt, working capital, capital expenditures, acquisitions
(so long as certain conditions, including a specified funded debt to EBITDA leverage ratio is maintained), and other general
corporate purposes. As of June 30, 2015, the Company had the ability to borrow $248.3 million under the facility based on
our current EBITDA. The facility contains customary representations, warranties and restrictive covenants, as well as
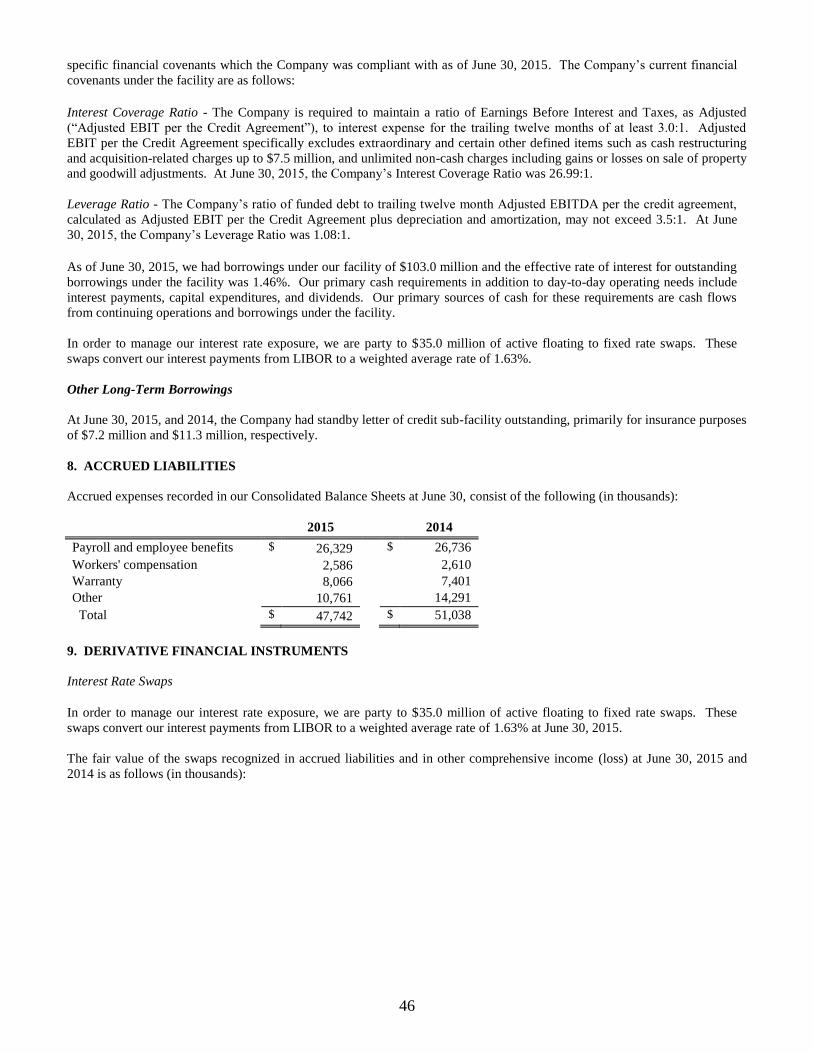
46
specific financial covenants which the Company was compliant with as of June 30, 2015. The Company’s current financial
covenants under the facility are as follows:
Interest Coverage Ratio - The Company is required to maintain a ratio of Earnings Before Interest and Taxes, as Adjusted
(“Adjusted EBIT per the Credit Agreement”), to interest expense for the trailing twelve months of at least 3.0:1. Adjusted
EBIT per the Credit Agreement specifically excludes extraordinary and certain other defined items such as cash restructuring
and acquisition-related charges up to $7.5 million, and unlimited non-cash charges including gains or losses on sale of property
and goodwill adjustments. At June 30, 2015, the Company’s Interest Coverage Ratio was 26.99:1.
Leverage Ratio - The Company’s ratio of funded debt to trailing twelve month Adjusted EBITDA per the credit agreement,
calculated as Adjusted EBIT per the Credit Agreement plus depreciation and amortization, may not exceed 3.5:1. At June
30, 2015, the Company’s Leverage Ratio was 1.08:1.
As of June 30, 2015, we had borrowings under our facility of $103.0 million and the effective rate of interest for outstanding
borrowings under the facility was 1.46%. Our primary cash requirements in addition to day-to-day operating needs include
interest payments, capital expenditures, and dividends. Our primary sources of cash for these requirements are cash flows
from continuing operations and borrowings under the facility.
In order to manage our interest rate exposure, we are party to $35.0 million of active floating to fixed rate swaps. These
swaps convert our interest payments from LIBOR to a weighted average rate of 1.63%.
Other Long-Term Borrowings
At June 30, 2015, and 2014, the Company had standby letter of credit sub-facility outstanding, primarily for insurance purposes
of $7.2 million and $11.3 million, respectively.
8. ACCRUED LIABILITIES
Accrued expenses recorded in our Consolidated Balance Sheets at June 30, consist of the following (in thousands):
2015 2014
Payroll and employee benefits $ 26,329 $ 26,736
Workers' compensation 2,586 2,610
Warranty 8,066 7,401
Other 10,761 14,291
Total $ 47,742 $ 51,038
9. DERIVATIVE FINANCIAL INSTRUMENTS
Interest Rate Swaps
In order to manage our interest rate exposure, we are party to $35.0 million of active floating to fixed rate swaps. These
swaps convert our interest payments from LIBOR to a weighted average rate of 1.63% at June 30, 2015.
The fair value of the swaps recognized in accrued liabilities and in other comprehensive income (loss) at June 30, 2015 and
2014 is as follows (in thousands):
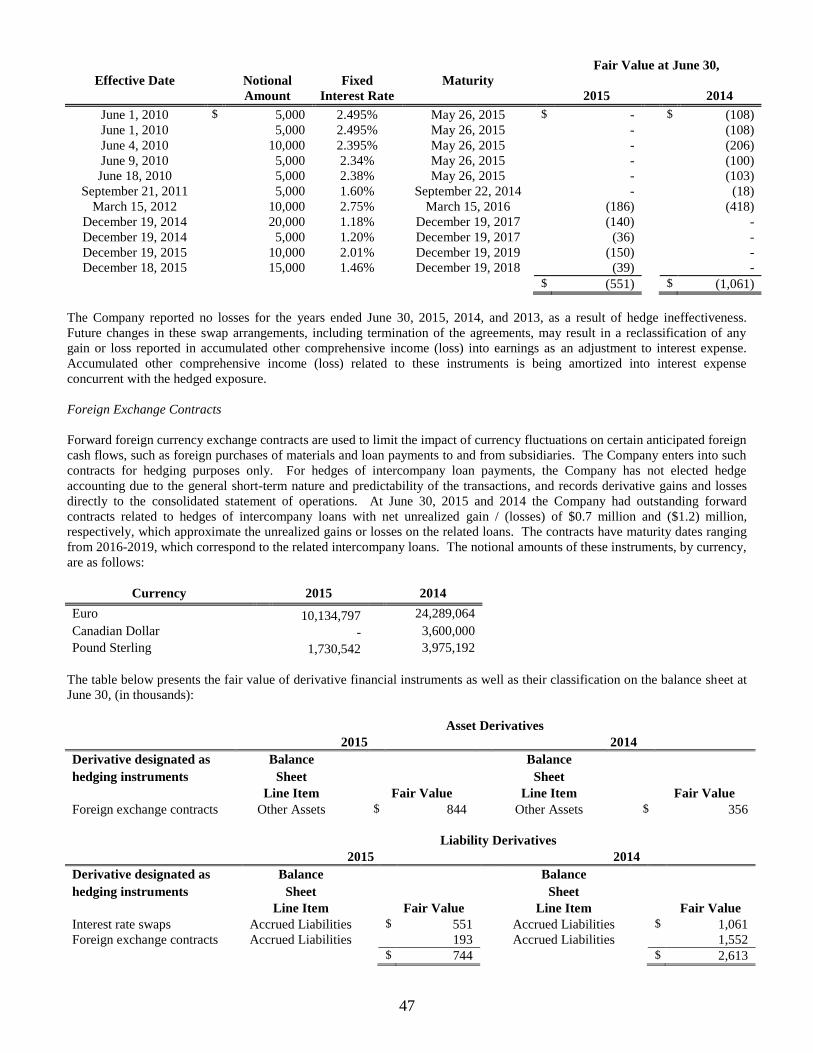
47
Fair Value at June 30,
Effective Date Notional
Amount
Fixed
Interest Rate
Maturity
2015
2014
June 1, 2010 $ 5,000 2.495% May 26, 2015 $ - $ (108)
June 1, 2010 5,000 2.495% May 26, 2015 - (108)
June 4, 2010 10,000 2.395% May 26, 2015 - (206)
June 9, 2010 5,000 2.34% May 26, 2015 - (100)
June 18, 2010 5,000 2.38% May 26, 2015 - (103)
September 21, 2011 5,000 1.60% September 22, 2014 - (18)
March 15, 2012 10,000 2.75% March 15, 2016 (186) (418)
December 19, 2014 20,000 1.18% December 19, 2017 (140) -
December 19, 2014 5,000 1.20% December 19, 2017 (36) -
December 19, 2015 10,000 2.01% December 19, 2019 (150) -
December 18, 2015 15,000 1.46% December 19, 2018 (39) -
$ (551) $ (1,061)
The Company reported no losses for the years ended June 30, 2015, 2014, and 2013, as a result of hedge ineffectiveness.
Future changes in these swap arrangements, including termination of the agreements, may result in a reclassification of any
gain or loss reported in accumulated other comprehensive income (loss) into earnings as an adjustment to interest expense.
Accumulated other comprehensive income (loss) related to these instruments is being amortized into interest expense
concurrent with the hedged exposure.
Foreign Exchange Contracts
Forward foreign currency exchange contracts are used to limit the impact of currency fluctuations on certain anticipated foreign
cash flows, such as foreign purchases of materials and loan payments to and from subsidiaries. The Company enters into such
contracts for hedging purposes only. For hedges of intercompany loan payments, the Company has not elected hedge
accounting due to the general short-term nature and predictability of the transactions, and records derivative gains and losses
directly to the consolidated statement of operations. At June 30, 2015 and 2014 the Company had outstanding forward
contracts related to hedges of intercompany loans with net unrealized gain / (losses) of $0.7 million and ($1.2) million,
respectively, which approximate the unrealized gains or losses on the related loans. The contracts have maturity dates ranging
from 2016-2019, which correspond to the related intercompany loans. The notional amounts of these instruments, by currency,
are as follows:
Currency 2015 2014
Euro 10,134,797 24,289,064
Canadian Dollar - 3,600,000
Pound Sterling 1,730,542 3,975,192
The table below presents the fair value of derivative financial instruments as well as their classification on the balance sheet at
June 30, (in thousands):
Asset Derivatives
2015 2014
Derivative designated as Balance Balance
hedging instruments Sheet Sheet
Line Item Fair Value Line Item Fair Value
Foreign exchange contracts Other Assets $ 844 Other Assets $ 356
Liability Derivatives
2015 2014
Derivative designated as Balance Balance
hedging instruments Sheet Sheet
Line Item Fair Value Line Item Fair Value
Interest rate swaps Accrued Liabilities $ 551 Accrued Liabilities $ 1,061
Foreign exchange contracts Accrued Liabilities 193 Accrued Liabilities 1,552
$ 744 $ 2,613
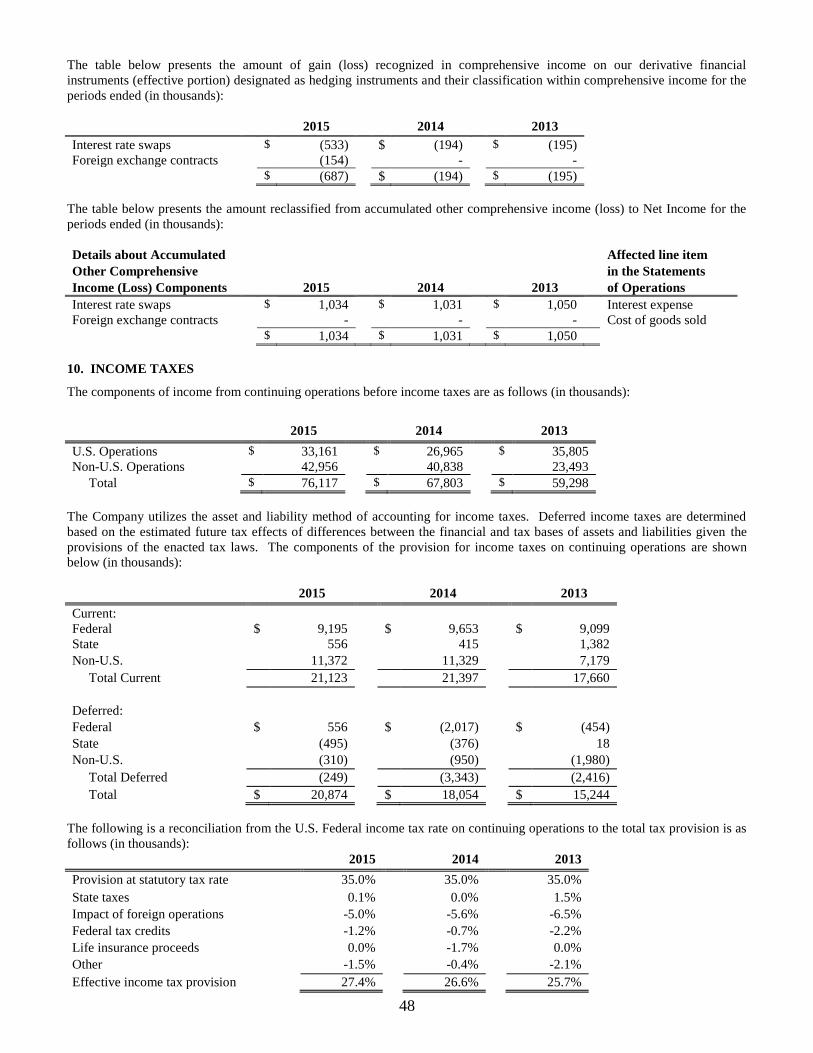
48
The table below presents the amount of gain (loss) recognized in comprehensive income on our derivative financial
instruments (effective portion) designated as hedging instruments and their classification within comprehensive income for the
periods ended (in thousands):
2015 2014 2013
Interest rate swaps $ (533) $ (194) $ (195)
Foreign exchange contracts (154) - -
$ (687) $ (194) $ (195)
The table below presents the amount reclassified from accumulated other comprehensive income (loss) to Net Income for the
periods ended (in thousands):
Details about Accumulated Affected line item
Other Comprehensive in the Statements
Income (Loss) Components 2015 2014 2013 of Operations
Interest rate swaps $ 1,034 $ 1,031 $ 1,050 Interest expense
Foreign exchange contracts - - - Cost of goods sold
$ 1,034 $ 1,031 $ 1,050
10. INCOME TAXES
The components of income from continuing operations before income taxes are as follows (in thousands):
2015 2014 2013
U.S. Operations $ 33,161 $ 26,965 $ 35,805
Non-U.S. Operations 42,956 40,838 23,493
Total $ 76,117 $ 67,803 $ 59,298
The Company utilizes the asset and liability method of accounting for income taxes. Deferred income taxes are determined
based on the estimated future tax effects of differences between the financial and tax bases of assets and liabilities given the
provisions of the enacted tax laws. The components of the provision for income taxes on continuing operations are shown
below (in thousands):
2015 2014 2013
Current:
Federal $ 9,195 $ 9,653 $ 9,099
State 556 415 1,382
Non-U.S. 11,372 11,329 7,179
Total Current 21,123 21,397 17,660
Deferred:
Federal $ 556 $ (2,017) $ (454)
State (495) (376) 18
Non-U.S. (310) (950) (1,980)
Total Deferred (249) (3,343) (2,416)
Total $ 20,874 $ 18,054 $ 15,244
The following is a reconciliation from the U.S. Federal income tax rate on continuing operations to the total tax provision is as
follows (in thousands):
2015 2014 2013
Provision at statutory tax rate 35.0% 35.0% 35.0%
State taxes 0.1% 0.0% 1.5%
Impact of foreign operations -5.0% -5.6% -6.5%
Federal tax credits -1.2% -0.7% -2.2%
Life insurance proceeds 0.0% -1.7% 0.0%
Other -1.5% -0.4% -2.1%
Effective income tax provision 27.4% 26.6% 25.7%
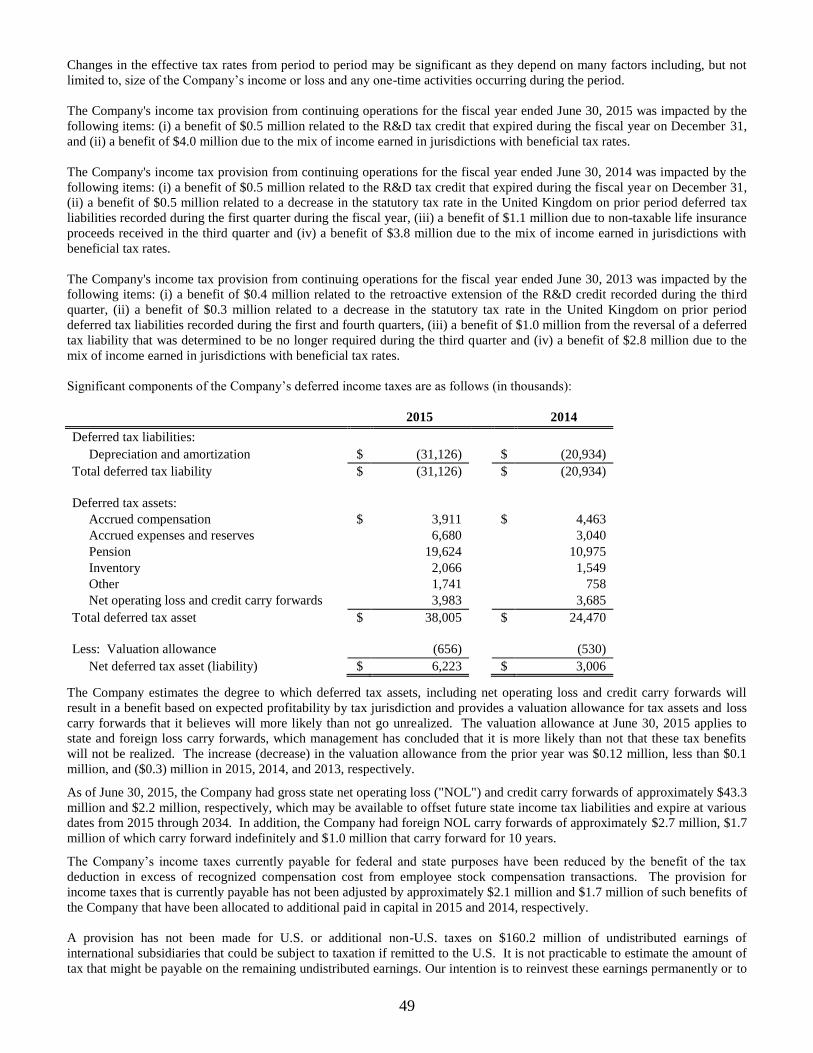
49
Changes in the effective tax rates from period to period may be significant as they depend on many factors including, but not
limited to, size of the Company’s income or loss and any one-time activities occurring during the period.
The Company's income tax provision from continuing operations for the fiscal year ended June 30, 2015 was impacted by the
following items: (i) a benefit of $0.5 million related to the R&D tax credit that expired during the fiscal year on December 31,
and (ii) a benefit of $4.0 million due to the mix of income earned in jurisdictions with beneficial tax rates.
The Company's income tax provision from continuing operations for the fiscal year ended June 30, 2014 was impacted by the
following items: (i) a benefit of $0.5 million related to the R&D tax credit that expired during the fiscal year on December 31,
(ii) a benefit of $0.5 million related to a decrease in the statutory tax rate in the United Kingdom on prior period deferred tax
liabilities recorded during the first quarter during the fiscal year, (iii) a benefit of $1.1 million due to non-taxable life insurance
proceeds received in the third quarter and (iv) a benefit of $3.8 million due to the mix of income earned in jurisdictions with
beneficial tax rates.
The Company's income tax provision from continuing operations for the fiscal year ended June 30, 2013 was impacted by the
following items: (i) a benefit of $0.4 million related to the retroactive extension of the R&D credit recorded during the third
quarter, (ii) a benefit of $0.3 million related to a decrease in the statutory tax rate in the United Kingdom on prior period
deferred tax liabilities recorded during the first and fourth quarters, (iii) a benefit of $1.0 million from the reversal of a deferred
tax liability that was determined to be no longer required during the third quarter and (iv) a benefit of $2.8 million due to the
mix of income earned in jurisdictions with beneficial tax rates.
Significant components of the Company’s deferred income taxes are as follows (in thousands):
2015 2014
Deferred tax liabilities:
Depreciation and amortization $ (31,126) $ (20,934)
Total deferred tax liability $ (31,126) $ (20,934)
Deferred tax assets:
Accrued compensation $ 3,911 $ 4,463
Accrued expenses and reserves 6,680 3,040
Pension 19,624 10,975
Inventory 2,066 1,549
Other 1,741 758
Net operating loss and credit carry forwards 3,983 3,685
Total deferred tax asset $ 38,005 $ 24,470
Less: Valuation allowance (656) (530)
Net deferred tax asset (liability) $ 6,223 $ 3,006
The Company estimates the degree to which deferred tax assets, including net operating loss and credit carry forwards will
result in a benefit based on expected profitability by tax jurisdiction and provides a valuation allowance for tax assets and loss
carry forwards that it believes will more likely than not go unrealized. The valuation allowance at June 30, 2015 applies to
state and foreign loss carry forwards, which management has concluded that it is more likely than not that these tax benefits
will not be realized. The increase (decrease) in the valuation allowance from the prior year was $0.12 million, less than $0.1
million, and ($0.3) million in 2015, 2014, and 2013, respectively.
As of June 30, 2015, the Company had gross state net operating loss ("NOL") and credit carry forwards of approximately $43.3
million and $2.2 million, respectively, which may be available to offset future state income tax liabilities and expire at various
dates from 2015 through 2034. In addition, the Company had foreign NOL carry forwards of approximately $2.7 million, $1.7
million of which carry forward indefinitely and $1.0 million that carry forward for 10 years.
The Company’s income taxes currently payable for federal and state purposes have been reduced by the benefit of the tax
deduction in excess of recognized compensation cost from employee stock compensation transactions. The provision for
income taxes that is currently payable has not been adjusted by approximately $2.1 million and $1.7 million of such benefits of
the Company that have been allocated to additional paid in capital in 2015 and 2014, respectively.
A provision has not been made for U.S. or additional non-U.S. taxes on $160.2 million of undistributed earnings of
international subsidiaries that could be subject to taxation if remitted to the U.S. It is not practicable to estimate the amount of
tax that might be payable on the remaining undistributed earnings. Our intention is to reinvest these earnings permanently or to
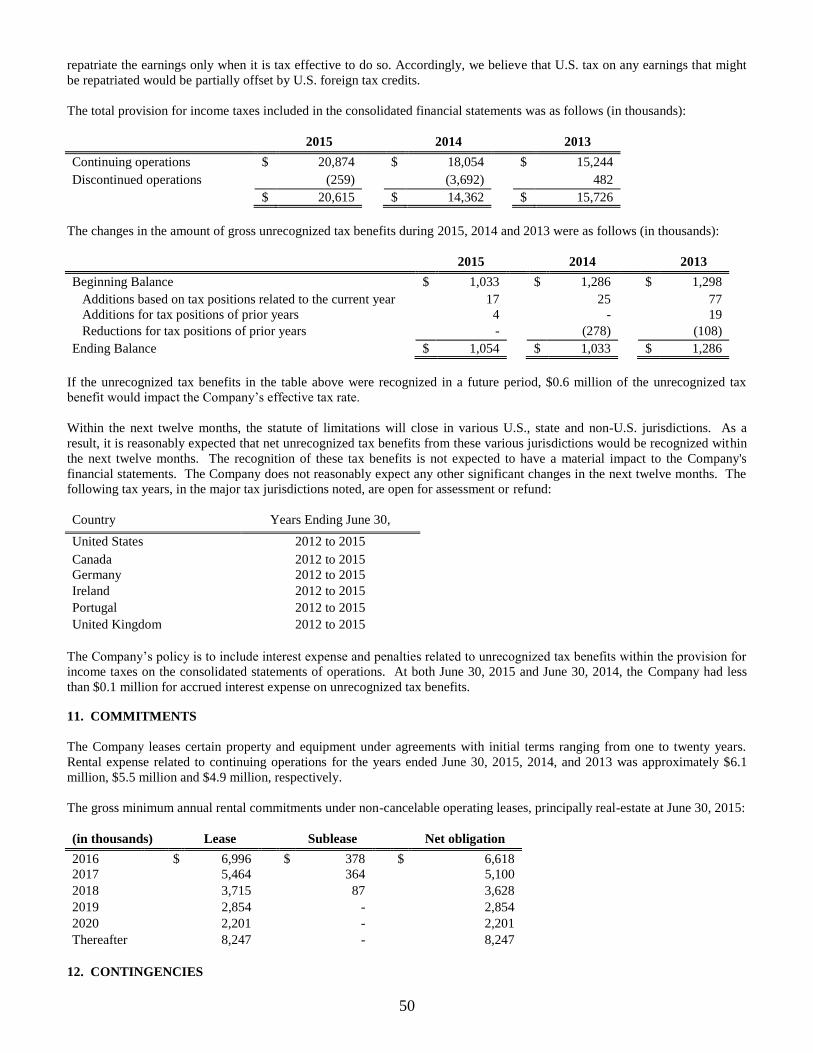
50
repatriate the earnings only when it is tax effective to do so. Accordingly, we believe that U.S. tax on any earnings that might
be repatriated would be partially offset by U.S. foreign tax credits.
The total provision for income taxes included in the consolidated financial statements was as follows (in thousands):
2015 2014 2013
Continuing operations $ 20,874 $ 18,054 $ 15,244
Discontinued operations (259) (3,692) 482
$ 20,615 $ 14,362 $ 15,726
The changes in the amount of gross unrecognized tax benefits during 2015, 2014 and 2013 were as follows (in thousands):
2015 2014 2013
Beginning Balance $ 1,033 $ 1,286 $ 1,298
Additions based on tax positions related to the current year 17 25 77
Additions for tax positions of prior years 4 - 19
Reductions for tax positions of prior years - (278) (108)
Ending Balance $ 1,054 $ 1,033 $ 1,286
If the unrecognized tax benefits in the table above were recognized in a future period, $0.6 million of the unrecognized tax
benefit would impact the Company’s effective tax rate.
Within the next twelve months, the statute of limitations will close in various U.S., state and non-U.S. jurisdictions. As a
result, it is reasonably expected that net unrecognized tax benefits from these various jurisdictions would be recognized within
the next twelve months. The recognition of these tax benefits is not expected to have a material impact to the Company's
financial statements. The Company does not reasonably expect any other significant changes in the next twelve months. The
following tax years, in the major tax jurisdictions noted, are open for assessment or refund:
Country Years Ending June 30,
United States 2012 to 2015
Canada 2012 to 2015
Germany 2012 to 2015
Ireland 2012 to 2015
Portugal 2012 to 2015
United Kingdom 2012 to 2015
The Company’s policy is to include interest expense and penalties related to unrecognized tax benefits within the provision for
income taxes on the consolidated statements of operations. At both June 30, 2015 and June 30, 2014, the Company had less
than $0.1 million for accrued interest expense on unrecognized tax benefits.
11. COMMITMENTS
The Company leases certain property and equipment under agreements with initial terms ranging from one to twenty years.
Rental expense related to continuing operations for the years ended June 30, 2015, 2014, and 2013 was approximately $6.1
million, $5.5 million and $4.9 million, respectively.
The gross minimum annual rental commitments under non-cancelable operating leases, principally real-estate at June 30, 2015:
(in thousands) Lease Sublease Net obligation
2016 $ 6,996 $ 378 $ 6,618
2017 5,464 364 5,100
2018 3,715 87 3,628
2019 2,854 - 2,854
2020 2,201 - 2,201
Thereafter 8,247 - 8,247
12. CONTINGENCIES
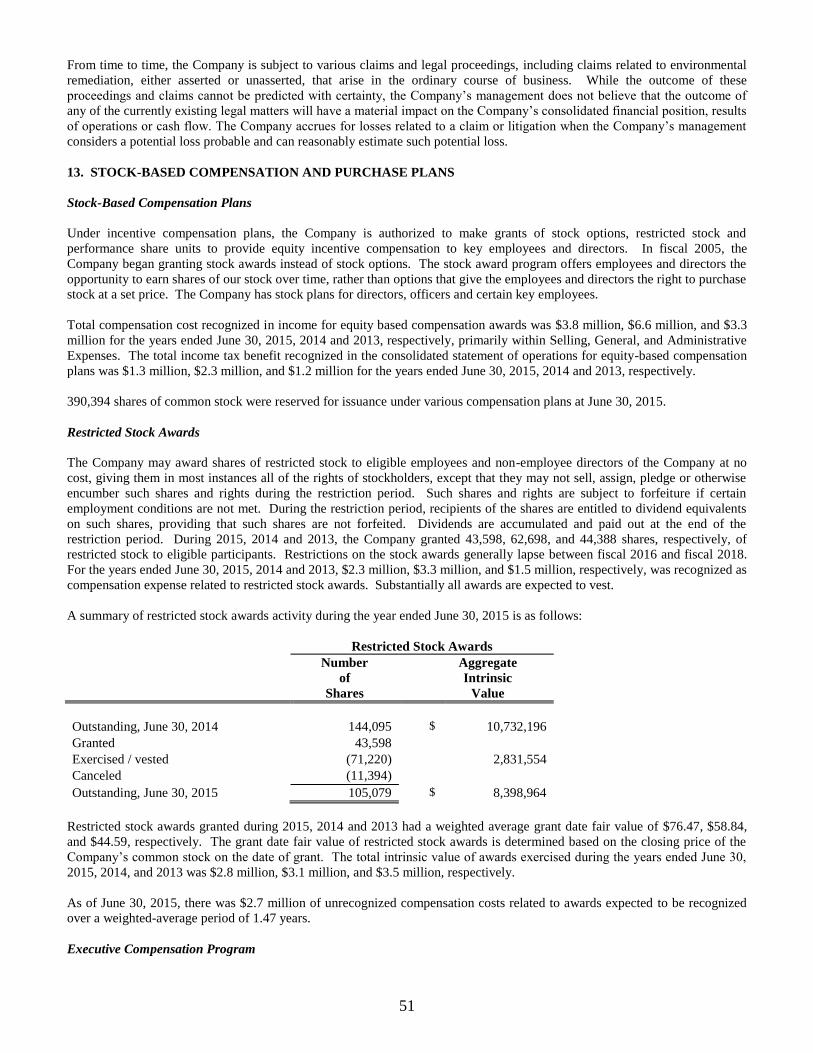
51
From time to time, the Company is subject to various claims and legal proceedings, including claims related to environmental
remediation, either asserted or unasserted, that arise in the ordinary course of business. While the outcome of these
proceedings and claims cannot be predicted with certainty, the Company’s management does not believe that the outcome of
any of the currently existing legal matters will have a material impact on the Company’s consolidated financial position, results
of operations or cash flow. The Company accrues for losses related to a claim or litigation when the Company’s management
considers a potential loss probable and can reasonably estimate such potential loss.
13. STOCK-BASED COMPENSATION AND PURCHASE PLANS
Stock-Based Compensation Plans
Under incentive compensation plans, the Company is authorized to make grants of stock options, restricted stock and
performance share units to provide equity incentive compensation to key employees and directors. In fiscal 2005, the
Company began granting stock awards instead of stock options. The stock award program offers employees and directors the
opportunity to earn shares of our stock over time, rather than options that give the employees and directors the right to purchase
stock at a set price. The Company has stock plans for directors, officers and certain key employees.
Total compensation cost recognized in income for equity based compensation awards was $3.8 million, $6.6 million, and $3.3
million for the years ended June 30, 2015, 2014 and 2013, respectively, primarily within Selling, General, and Administrative
Expenses. The total income tax benefit recognized in the consolidated statement of operations for equity-based compensation
plans was $1.3 million, $2.3 million, and $1.2 million for the years ended June 30, 2015, 2014 and 2013, respectively.
390,394 shares of common stock were reserved for issuance under various compensation plans at June 30, 2015.
Restricted Stock Awards
The Company may award shares of restricted stock to eligible employees and non-employee directors of the Company at no
cost, giving them in most instances all of the rights of stockholders, except that they may not sell, assign, pledge or otherwise
encumber such shares and rights during the restriction period. Such shares and rights are subject to forfeiture if certain
employment conditions are not met. During the restriction period, recipients of the shares are entitled to dividend equivalents
on such shares, providing that such shares are not forfeited. Dividends are accumulated and paid out at the end of the
restriction period. During 2015, 2014 and 2013, the Company granted 43,598, 62,698, and 44,388 shares, respectively, of
restricted stock to eligible participants. Restrictions on the stock awards generally lapse between fiscal 2016 and fiscal 2018.
For the years ended June 30, 2015, 2014 and 2013, $2.3 million, $3.3 million, and $1.5 million, respectively, was recognized as
compensation expense related to restricted stock awards. Substantially all awards are expected to vest.
A summary of restricted stock awards activity during the year ended June 30, 2015 is as follows:
Restricted Stock Awards
Number Aggregate
of Intrinsic
Shares Value
Outstanding, June 30, 2014 144,095 $ 10,732,196
Granted 43,598
Exercised / vested (71,220) 2,831,554
Canceled (11,394)
Outstanding, June 30, 2015 105,079 $ 8,398,964
Restricted stock awards granted during 2015, 2014 and 2013 had a weighted average grant date fair value of $76.47, $58.84,
and $44.59, respectively. The grant date fair value of restricted stock awards is determined based on the closing price of the
Company’s common stock on the date of grant. The total intrinsic value of awards exercised during the years ended June 30,
2015, 2014, and 2013 was $2.8 million, $3.1 million, and $3.5 million, respectively.
As of June 30, 2015, there was $2.7 million of unrecognized compensation costs related to awards expected to be recognized
over a weighted-average period of 1.47 years.
Executive Compensation Program
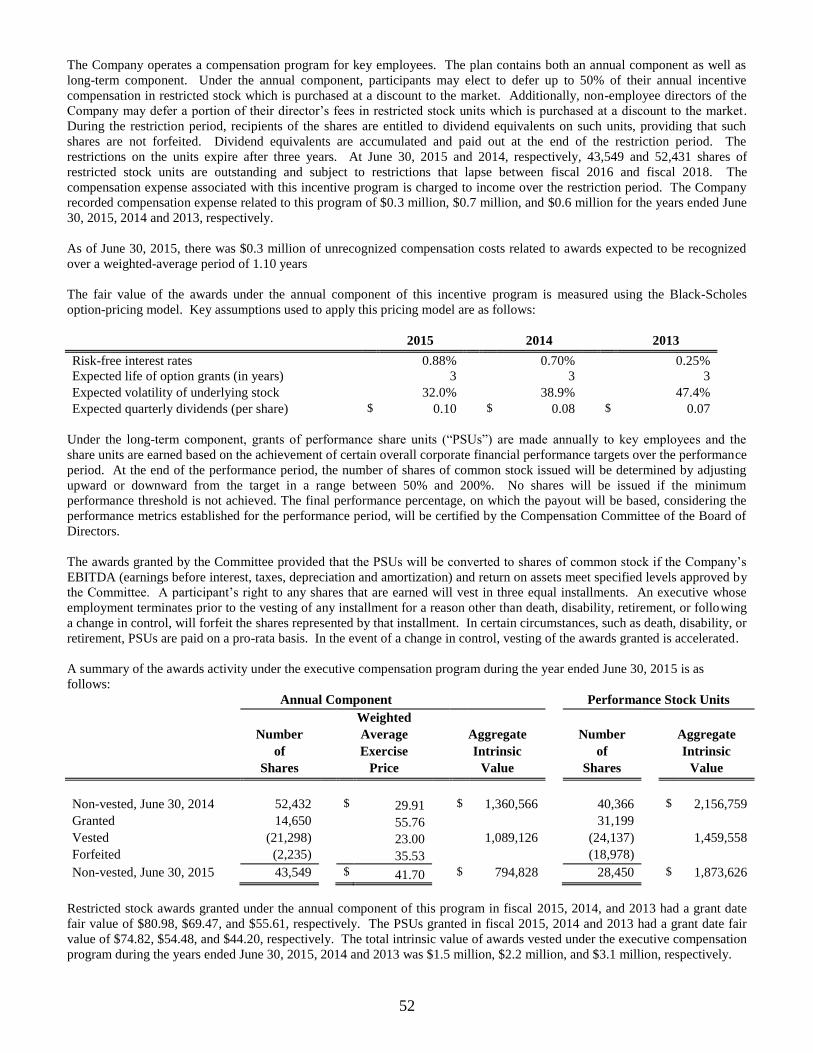
52
The Company operates a compensation program for key employees. The plan contains both an annual component as well as
long-term component. Under the annual component, participants may elect to defer up to 50% of their annual incentive
compensation in restricted stock which is purchased at a discount to the market. Additionally, non-employee directors of the
Company may defer a portion of their director’s fees in restricted stock units which is purchased at a discount to the market.
During the restriction period, recipients of the shares are entitled to dividend equivalents on such units, providing that such
shares are not forfeited. Dividend equivalents are accumulated and paid out at the end of the restriction period. The
restrictions on the units expire after three years. At June 30, 2015 and 2014, respectively, 43,549 and 52,431 shares of
restricted stock units are outstanding and subject to restrictions that lapse between fiscal 2016 and fiscal 2018. The
compensation expense associated with this incentive program is charged to income over the restriction period. The Company
recorded compensation expense related to this program of $0.3 million, $0.7 million, and $0.6 million for the years ended June
30, 2015, 2014 and 2013, respectively.
As of June 30, 2015, there was $0.3 million of unrecognized compensation costs related to awards expected to be recognized
over a weighted-average period of 1.10 years
The fair value of the awards under the annual component of this incentive program is measured using the Black-Scholes
option-pricing model. Key assumptions used to apply this pricing model are as follows:
2015 2014 2013
Risk-free interest rates 0.88% 0.70% 0.25%
Expected life of option grants (in years) 3 3 3
Expected volatility of underlying stock 32.0% 38.9% 47.4%
Expected quarterly dividends (per share) $ 0.10 $ 0.08 $ 0.07
Under the long-term component, grants of performance share units (“PSUs”) are made annually to key employees and the
share units are earned based on the achievement of certain overall corporate financial performance targets over the performance
period. At the end of the performance period, the number of shares of common stock issued will be determined by adjusting
upward or downward from the target in a range between 50% and 200%. No shares will be issued if the minimum
performance threshold is not achieved. The final performance percentage, on which the payout will be based, considering the
performance metrics established for the performance period, will be certified by the Compensation Committee of the Board of
Directors.
The awards granted by the Committee provided that the PSUs will be converted to shares of common stock if the Company’s
EBITDA (earnings before interest, taxes, depreciation and amortization) and return on assets meet specified levels approved by
the Committee. A participant’s right to any shares that are earned will vest in three equal installments. An executive whose
employment terminates prior to the vesting of any installment for a reason other than death, disability, retirement, or following
a change in control, will forfeit the shares represented by that installment. In certain circumstances, such as death, disability, or
retirement, PSUs are paid on a pro-rata basis. In the event of a change in control, vesting of the awards granted is accelerated.
A summary of the awards activity under the executive compensation program during the year ended June 30, 2015 is as
follows:
Annual Component Performance Stock Units
Weighted
Number Average Aggregate Number Aggregate
of Exercise Intrinsic of Intrinsic
Shares Price Value Shares Value
Non-vested, June 30, 2014 52,432 $ 29.91 $ 1,360,566 40,366 $ 2,156,759
Granted 14,650 55.76 31,199
Vested (21,298) 23.00 1,089,126 (24,137) 1,459,558
Forfeited (2,235) 35.53 (18,978)
Non-vested, June 30, 2015 43,549 $ 41.70 $ 794,828 28,450 $ 1,873,626
Restricted stock awards granted under the annual component of this program in fiscal 2015, 2014, and 2013 had a grant date
fair value of $80.98, $69.47, and $55.61, respectively. The PSUs granted in fiscal 2015, 2014 and 2013 had a grant date fair
value of $74.82, $54.48, and $44.20, respectively. The total intrinsic value of awards vested under the executive compensation
program during the years ended June 30, 2015, 2014 and 2013 was $1.5 million, $2.2 million, and $3.1 million, respectively.
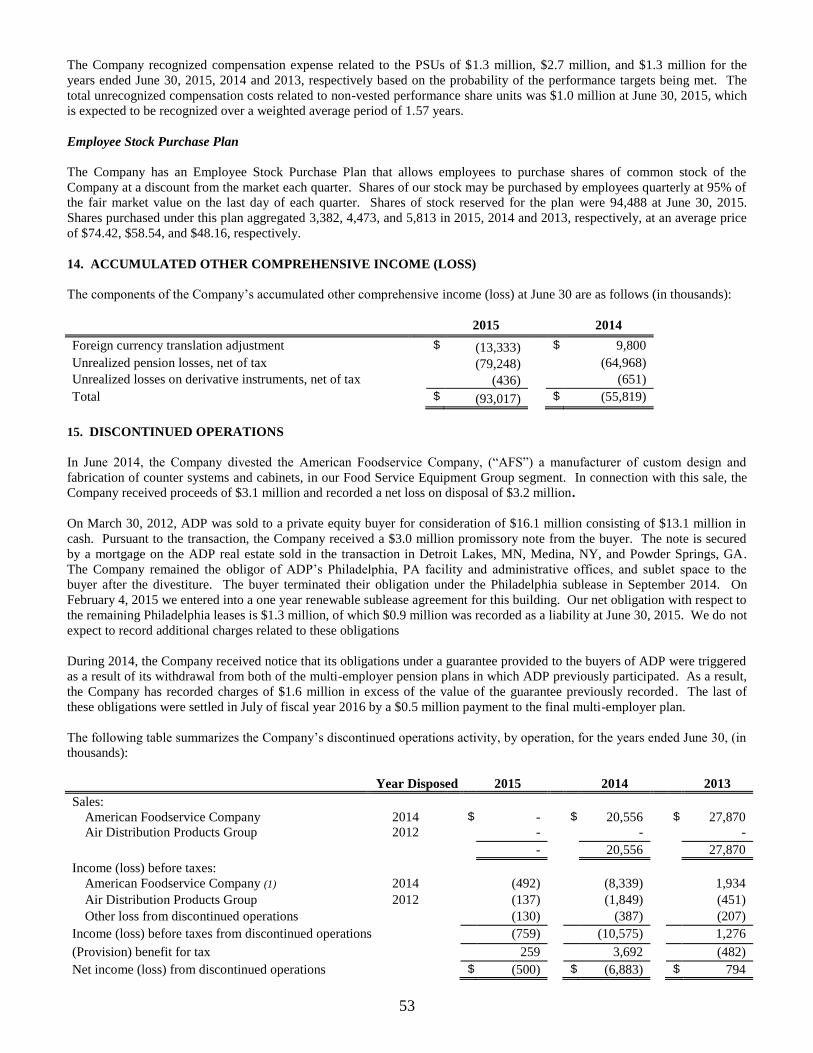
53
The Company recognized compensation expense related to the PSUs of $1.3 million, $2.7 million, and $1.3 million for the
years ended June 30, 2015, 2014 and 2013, respectively based on the probability of the performance targets being met. The
total unrecognized compensation costs related to non-vested performance share units was $1.0 million at June 30, 2015, which
is expected to be recognized over a weighted average period of 1.57 years.
Employee Stock Purchase Plan
The Company has an Employee Stock Purchase Plan that allows employees to purchase shares of common stock of the
Company at a discount from the market each quarter. Shares of our stock may be purchased by employees quarterly at 95% of
the fair market value on the last day of each quarter. Shares of stock reserved for the plan were 94,488 at June 30, 2015.
Shares purchased under this plan aggregated 3,382, 4,473, and 5,813 in 2015, 2014 and 2013, respectively, at an average price
of $74.42, $58.54, and $48.16, respectively.
14. ACCUMULATED OTHER COMPREHENSIVE INCOME (LOSS)
The components of the Company’s accumulated other comprehensive income (loss) at June 30 are as follows (in thousands):
2015 2014
Foreign currency translation adjustment $ (13,333) $ 9,800
Unrealized pension losses, net of tax (79,248) (64,968)
Unrealized losses on derivative instruments, net of tax (436) (651)
Total $ (93,017) $ (55,819)
15. DISCONTINUED OPERATIONS
In June 2014, the Company divested the American Foodservice Company, (“AFS”) a manufacturer of custom design and
fabrication of counter systems and cabinets, in our Food Service Equipment Group segment. In connection with this sale, the
Company received proceeds of $3.1 million and recorded a net loss on disposal of $3.2 million.
On March 30, 2012, ADP was sold to a private equity buyer for consideration of $16.1 million consisting of $13.1 million in
cash. Pursuant to the transaction, the Company received a $3.0 million promissory note from the buyer. The note is secured
by a mortgage on the ADP real estate sold in the transaction in Detroit Lakes, MN, Medina, NY, and Powder Springs, GA.
The Company remained the obligor of ADP’s Philadelphia, PA facility and administrative offices, and sublet space to the
buyer after the divestiture. The buyer terminated their obligation under the Philadelphia sublease in September 2014. On
February 4, 2015 we entered into a one year renewable sublease agreement for this building. Our net obligation with respect to
the remaining Philadelphia leases is $1.3 million, of which $0.9 million was recorded as a liability at June 30, 2015. We do not
expect to record additional charges related to these obligations
During 2014, the Company received notice that its obligations under a guarantee provided to the buyers of ADP were triggered
as a result of its withdrawal from both of the multi-employer pension plans in which ADP previously participated. As a result,
the Company has recorded charges of $1.6 million in excess of the value of the guarantee previously recorded. The last of
these obligations were settled in July of fiscal year 2016 by a $0.5 million payment to the final multi-employer plan.
The following table summarizes the Company’s discontinued operations activity, by operation, for the years ended June 30, (in
thousands):
Year Disposed 2015 2014 2013
Sales: American Foodservice Company 2014 $ - $ 20,556 $ 27,870
Air Distribution Products Group 2012 - - -
- 20,556 27,870
Income (loss) before taxes: American Foodservice Company (1) 2014 (492) (8,339) 1,934
Air Distribution Products Group 2012 (137) (1,849) (451)
Other loss from discontinued operations (130) (387) (207)
Income (loss) before taxes from discontinued operations (759) (10,575) 1,276
(Provision) benefit for tax 259 3,692 (482)
Net income (loss) from discontinued operations $ (500) $ (6,883) $ 794
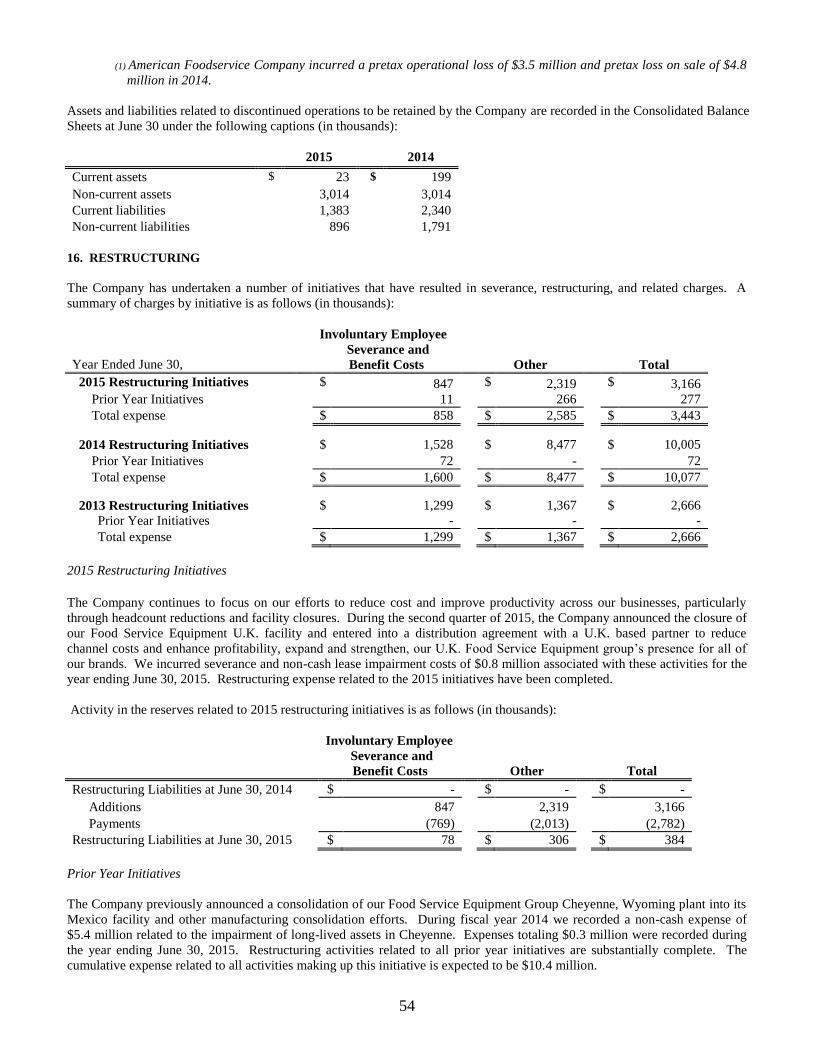
54
(1) American Foodservice Company incurred a pretax operational loss of $3.5 million and pretax loss on sale of $4.8
million in 2014.
Assets and liabilities related to discontinued operations to be retained by the Company are recorded in the Consolidated Balance
Sheets at June 30 under the following captions (in thousands):
2015 2014
Current assets $ 23 $ 199
Non-current assets 3,014 3,014
Current liabilities 1,383 2,340
Non-current liabilities 896 1,791
16. RESTRUCTURING
The Company has undertaken a number of initiatives that have resulted in severance, restructuring, and related charges. A
summary of charges by initiative is as follows (in thousands):
Involuntary Employee
Severance and
Year Ended June 30, Benefit Costs Other Total
2015 Restructuring Initiatives $ 847 $ 2,319 $ 3,166
Prior Year Initiatives 11 266 277
Total expense $ 858 $ 2,585 $ 3,443
2014 Restructuring Initiatives $ 1,528 $ 8,477 $ 10,005
Prior Year Initiatives 72 - 72
Total expense $ 1,600 $ 8,477 $ 10,077
2013 Restructuring Initiatives $ 1,299 $ 1,367 $ 2,666
Prior Year Initiatives - - -
Total expense $ 1,299 $ 1,367 $ 2,666
2015 Restructuring Initiatives
The Company continues to focus on our efforts to reduce cost and improve productivity across our businesses, particularly
through headcount reductions and facility closures. During the second quarter of 2015, the Company announced the closure of
our Food Service Equipment U.K. facility and entered into a distribution agreement with a U.K. based partner to reduce
channel costs and enhance profitability, expand and strengthen, our U.K. Food Service Equipment group’s presence for all of
our brands. We incurred severance and non-cash lease impairment costs of $0.8 million associated with these activities for the
year ending June 30, 2015. Restructuring expense related to the 2015 initiatives have been completed.
Activity in the reserves related to 2015 restructuring initiatives is as follows (in thousands):
Involuntary Employee Severance and Benefit Costs Other Total
Restructuring Liabilities at June 30, 2014 $ - $ - $ -
Additions 847 2,319 3,166
Payments (769) (2,013) (2,782)
Restructuring Liabilities at June 30, 2015 $ 78 $ 306 $ 384
Prior Year Initiatives
The Company previously announced a consolidation of our Food Service Equipment Group Cheyenne, Wyoming plant into its
Mexico facility and other manufacturing consolidation efforts. During fiscal year 2014 we recorded a non-cash expense of
$5.4 million related to the impairment of long-lived assets in Cheyenne. Expenses totaling $0.3 million were recorded during
the year ending June 30, 2015. Restructuring activities related to all prior year initiatives are substantially complete. The
cumulative expense related to all activities making up this initiative is expected to be $10.4 million.
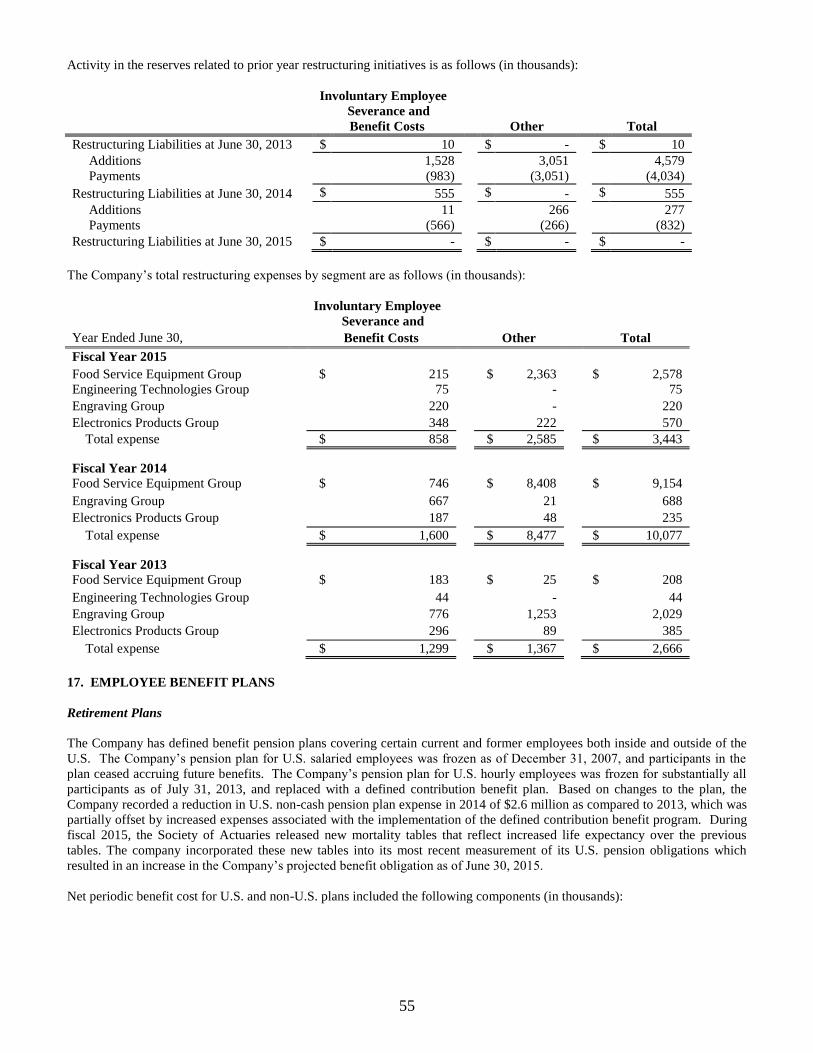
55
Activity in the reserves related to prior year restructuring initiatives is as follows (in thousands):
Involuntary Employee Severance and Benefit Costs Other Total
Restructuring Liabilities at June 30, 2013 $ 10 $ - $ 10
Additions 1,528 3,051 4,579
Payments (983) (3,051) (4,034)
Restructuring Liabilities at June 30, 2014 $ 555 $ - $ 555
Additions 11 266 277
Payments (566) (266) (832)
Restructuring Liabilities at June 30, 2015 $ - $ - $ -
The Company’s total restructuring expenses by segment are as follows (in thousands):
Involuntary Employee
Severance and
Year Ended June 30, Benefit Costs Other Total
Fiscal Year 2015
Food Service Equipment Group $ 215 $ 2,363 $ 2,578
Engineering Technologies Group 75 - 75
Engraving Group 220 - 220
Electronics Products Group 348 222 570
Total expense $ 858 $ 2,585 $ 3,443
Fiscal Year 2014
Food Service Equipment Group $ 746 $ 8,408 $ 9,154
Engraving Group 667 21 688
Electronics Products Group 187 48 235
Total expense $ 1,600 $ 8,477 $ 10,077
Fiscal Year 2013
Food Service Equipment Group $ 183 $ 25 $ 208
Engineering Technologies Group 44 - 44
Engraving Group 776 1,253 2,029
Electronics Products Group 296 89 385
Total expense $ 1,299 $ 1,367 $ 2,666
17. EMPLOYEE BENEFIT PLANS
Retirement Plans
The Company has defined benefit pension plans covering certain current and former employees both inside and outside of the
U.S. The Company’s pension plan for U.S. salaried employees was frozen as of December 31, 2007, and participants in the
plan ceased accruing future benefits. The Company’s pension plan for U.S. hourly employees was frozen for substantially all
participants as of July 31, 2013, and replaced with a defined contribution benefit plan. Based on changes to the plan, the
Company recorded a reduction in U.S. non-cash pension plan expense in 2014 of $2.6 million as compared to 2013, which was
partially offset by increased expenses associated with the implementation of the defined contribution benefit program. During
fiscal 2015, the Society of Actuaries released new mortality tables that reflect increased life expectancy over the previous
tables. The company incorporated these new tables into its most recent measurement of its U.S. pension obligations which
resulted in an increase in the Company’s projected benefit obligation as of June 30, 2015.
Net periodic benefit cost for U.S. and non-U.S. plans included the following components (in thousands):
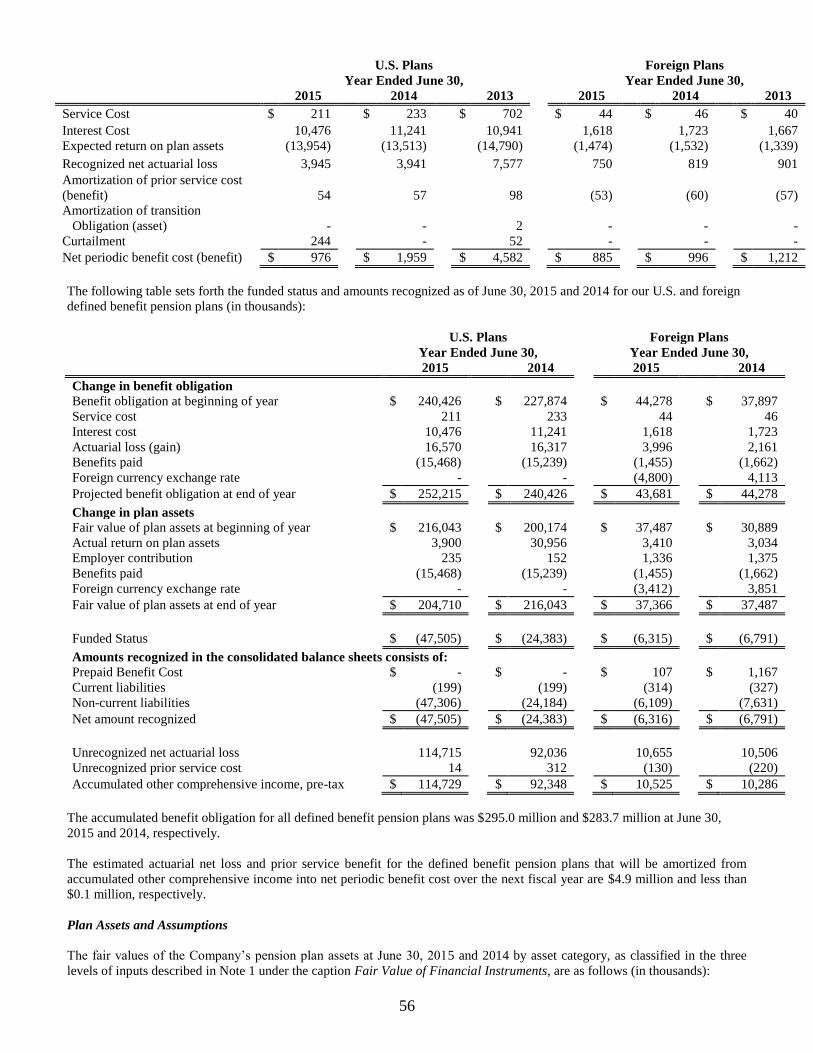
56
U.S. Plans Foreign Plans
Year Ended June 30, Year Ended June 30,
2015 2014 2013 2015 2014 2013
Service Cost $ 211 $ 233 $ 702 $ 44 $ 46 $ 40
Interest Cost 10,476 11,241 10,941 1,618 1,723 1,667
Expected return on plan assets (13,954) (13,513) (14,790) (1,474) (1,532) (1,339)
Recognized net actuarial loss 3,945 3,941 7,577 750 819 901
Amortization of prior service cost
(benefit)
54
57
98
(53)
(60)
(57)
Amortization of transition
Obligation (asset)
-
-
2
-
-
-
Curtailment 244 - 52 - - -
Net periodic benefit cost (benefit) $ 976 $ 1,959 $ 4,582 $ 885 $ 996 $ 1,212
The following table sets forth the funded status and amounts recognized as of June 30, 2015 and 2014 for our U.S. and foreign
defined benefit pension plans (in thousands):
U.S. Plans Foreign Plans
Year Ended June 30, Year Ended June 30,
2015 2014 2015 2014
Change in benefit obligation
Benefit obligation at beginning of year $ 240,426 $ 227,874 $ 44,278 $ 37,897
Service cost 211 233 44 46
Interest cost 10,476 11,241 1,618 1,723
Actuarial loss (gain) 16,570 16,317 3,996 2,161
Benefits paid (15,468) (15,239) (1,455) (1,662)
Foreign currency exchange rate - - (4,800) 4,113
Projected benefit obligation at end of year $ 252,215 $ 240,426 $ 43,681 $ 44,278
Change in plan assets
Fair value of plan assets at beginning of year $ 216,043 $ 200,174 $ 37,487 $ 30,889
Actual return on plan assets 3,900 30,956 3,410 3,034
Employer contribution 235 152 1,336 1,375
Benefits paid (15,468) (15,239) (1,455) (1,662)
Foreign currency exchange rate - - (3,412) 3,851
Fair value of plan assets at end of year $ 204,710 $ 216,043 $ 37,366 $ 37,487
Funded Status $ (47,505) $ (24,383) $ (6,315) $ (6,791)
Amounts recognized in the consolidated balance sheets consists of: Prepaid Benefit Cost $ - $ - $ 107 $ 1,167
Current liabilities (199) (199) (314) (327)
Non-current liabilities (47,306) (24,184) (6,109) (7,631)
Net amount recognized $ (47,505) $ (24,383) $ (6,316) $ (6,791)
Unrecognized net actuarial loss 114,715 92,036 10,655 10,506
Unrecognized prior service cost 14 312 (130) (220)
Accumulated other comprehensive income, pre-tax $ 114,729 $ 92,348 $ 10,525 $ 10,286
The accumulated benefit obligation for all defined benefit pension plans was $295.0 million and $283.7 million at June 30,
2015 and 2014, respectively.
The estimated actuarial net loss and prior service benefit for the defined benefit pension plans that will be amortized from
accumulated other comprehensive income into net periodic benefit cost over the next fiscal year are $4.9 million and less than
$0.1 million, respectively.
Plan Assets and Assumptions
The fair values of the Company’s pension plan assets at June 30, 2015 and 2014 by asset category, as classified in the three
levels of inputs described in Note 1 under the caption Fair Value of Financial Instruments, are as follows (in thousands):
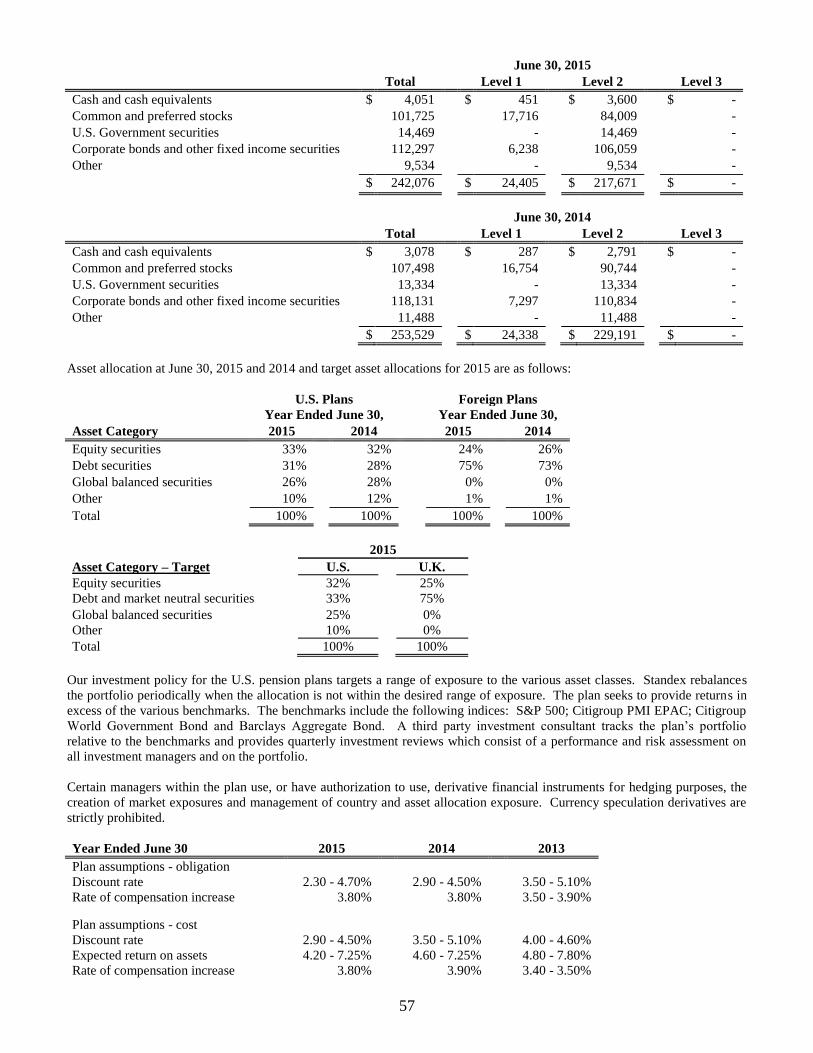
57
June 30, 2015
Total Level 1 Level 2 Level 3
Cash and cash equivalents $ 4,051 $ 451 $ 3,600 $ -
Common and preferred stocks 101,725 17,716 84,009 -
U.S. Government securities 14,469 - 14,469 -
Corporate bonds and other fixed income securities 112,297 6,238 106,059 -
Other 9,534 - 9,534 -
$ 242,076 $ 24,405 $ 217,671 $ -
June 30, 2014
Total Level 1 Level 2 Level 3
Cash and cash equivalents $ 3,078 $ 287 $ 2,791 $ -
Common and preferred stocks 107,498 16,754 90,744 -
U.S. Government securities 13,334 - 13,334 -
Corporate bonds and other fixed income securities 118,131 7,297 110,834 -
Other 11,488 - 11,488 -
$ 253,529 $ 24,338 $ 229,191 $ -
Asset allocation at June 30, 2015 and 2014 and target asset allocations for 2015 are as follows:
U.S. Plans Foreign Plans
Year Ended June 30, Year Ended June 30,
Asset Category 2015 2014 2015 2014
Equity securities 33% 32% 24% 26%
Debt securities 31% 28% 75% 73%
Global balanced securities 26% 28% 0% 0%
Other 10% 12% 1% 1%
Total 100% 100% 100% 100%
2015
Asset Category – Target U.S. U.K.
Equity securities 32% 25%
Debt and market neutral securities 33% 75%
Global balanced securities 25% 0%
Other 10% 0%
Total 100% 100%
Our investment policy for the U.S. pension plans targets a range of exposure to the various asset classes. Standex rebalances
the portfolio periodically when the allocation is not within the desired range of exposure. The plan seeks to provide returns in
excess of the various benchmarks. The benchmarks include the following indices: S&P 500; Citigroup PMI EPAC; Citigroup
World Government Bond and Barclays Aggregate Bond. A third party investment consultant tracks the plan’s portfolio
relative to the benchmarks and provides quarterly investment reviews which consist of a performance and risk assessment on
all investment managers and on the portfolio.
Certain managers within the plan use, or have authorization to use, derivative financial instruments for hedging purposes, the
creation of market exposures and management of country and asset allocation exposure. Currency speculation derivatives are
strictly prohibited.
Year Ended June 30 2015 2014 2013
Plan assumptions - obligation
Discount rate 2.30 - 4.70% 2.90 - 4.50% 3.50 - 5.10%
Rate of compensation increase 3.80% 3.80% 3.50 - 3.90%
Plan assumptions - cost Discount rate 2.90 - 4.50% 3.50 - 5.10% 4.00 - 4.60%
Expected return on assets 4.20 - 7.25% 4.60 - 7.25% 4.80 - 7.80%
Rate of compensation increase 3.80% 3.90% 3.40 - 3.50%
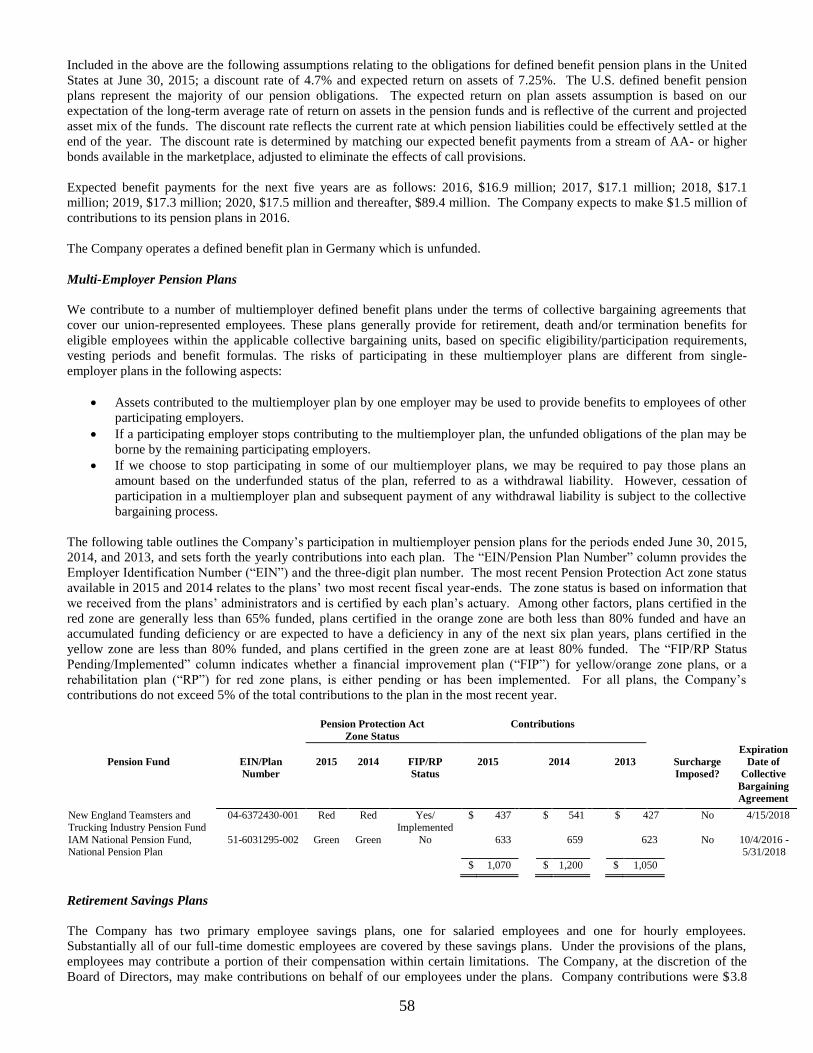
58
Included in the above are the following assumptions relating to the obligations for defined benefit pension plans in the United
States at June 30, 2015; a discount rate of 4.7% and expected return on assets of 7.25%. The U.S. defined benefit pension
plans represent the majority of our pension obligations. The expected return on plan assets assumption is based on our
expectation of the long-term average rate of return on assets in the pension funds and is reflective of the current and projected
asset mix of the funds. The discount rate reflects the current rate at which pension liabilities could be effectively settled at the
end of the year. The discount rate is determined by matching our expected benefit payments from a stream of AA- or higher
bonds available in the marketplace, adjusted to eliminate the effects of call provisions.
Expected benefit payments for the next five years are as follows: 2016, $16.9 million; 2017, $17.1 million; 2018, $17.1
million; 2019, $17.3 million; 2020, $17.5 million and thereafter, $89.4 million. The Company expects to make $1.5 million of
contributions to its pension plans in 2016.
The Company operates a defined benefit plan in Germany which is unfunded.
Multi-Employer Pension Plans
We contribute to a number of multiemployer defined benefit plans under the terms of collective bargaining agreements that
cover our union-represented employees. These plans generally provide for retirement, death and/or termination benefits for
eligible employees within the applicable collective bargaining units, based on specific eligibility/participation requirements,
vesting periods and benefit formulas. The risks of participating in these multiemployer plans are different from single-
employer plans in the following aspects:
Assets contributed to the multiemployer plan by one employer may be used to provide benefits to employees of other
participating employers.
If a participating employer stops contributing to the multiemployer plan, the unfunded obligations of the plan may be
borne by the remaining participating employers.
If we choose to stop participating in some of our multiemployer plans, we may be required to pay those plans an
amount based on the underfunded status of the plan, referred to as a withdrawal liability. However, cessation of
participation in a multiemployer plan and subsequent payment of any withdrawal liability is subject to the collective
bargaining process.
The following table outlines the Company’s participation in multiemployer pension plans for the periods ended June 30, 2015,
2014, and 2013, and sets forth the yearly contributions into each plan. The “EIN/Pension Plan Number” column provides the
Employer Identification Number (“EIN”) and the three-digit plan number. The most recent Pension Protection Act zone status
available in 2015 and 2014 relates to the plans’ two most recent fiscal year-ends. The zone status is based on information that
we received from the plans’ administrators and is certified by each plan’s actuary. Among other factors, plans certified in the
red zone are generally less than 65% funded, plans certified in the orange zone are both less than 80% funded and have an
accumulated funding deficiency or are expected to have a deficiency in any of the next six plan years, plans certified in the
yellow zone are less than 80% funded, and plans certified in the green zone are at least 80% funded. The “FIP/RP Status
Pending/Implemented” column indicates whether a financial improvement plan (“FIP”) for yellow/orange zone plans, or a
rehabilitation plan (“RP”) for red zone plans, is either pending or has been implemented. For all plans, the Company’s
contributions do not exceed 5% of the total contributions to the plan in the most recent year.
Pension Protection Act
Zone Status
Contributions
Pension Fund
EIN/Plan
Number
2015
2014
FIP/RP
Status
2015
2014
2013
Surcharge
Imposed?
Expiration
Date of
Collective
Bargaining
Agreement
New England Teamsters and
Trucking Industry Pension Fund
04-6372430-001 Red Red Yes/
Implemented
$ 437 $ 541 $ 427 No 4/15/2018
IAM National Pension Fund, National Pension Plan
51-6031295-002 Green Green No 633 659 623 No 10/4/2016 - 5/31/2018
$ 1,070 $ 1,200 $ 1,050
Retirement Savings Plans
The Company has two primary employee savings plans, one for salaried employees and one for hourly employees.
Substantially all of our full-time domestic employees are covered by these savings plans. Under the provisions of the plans,
employees may contribute a portion of their compensation within certain limitations. The Company, at the discretion of the
Board of Directors, may make contributions on behalf of our employees under the plans. Company contributions were $3.8
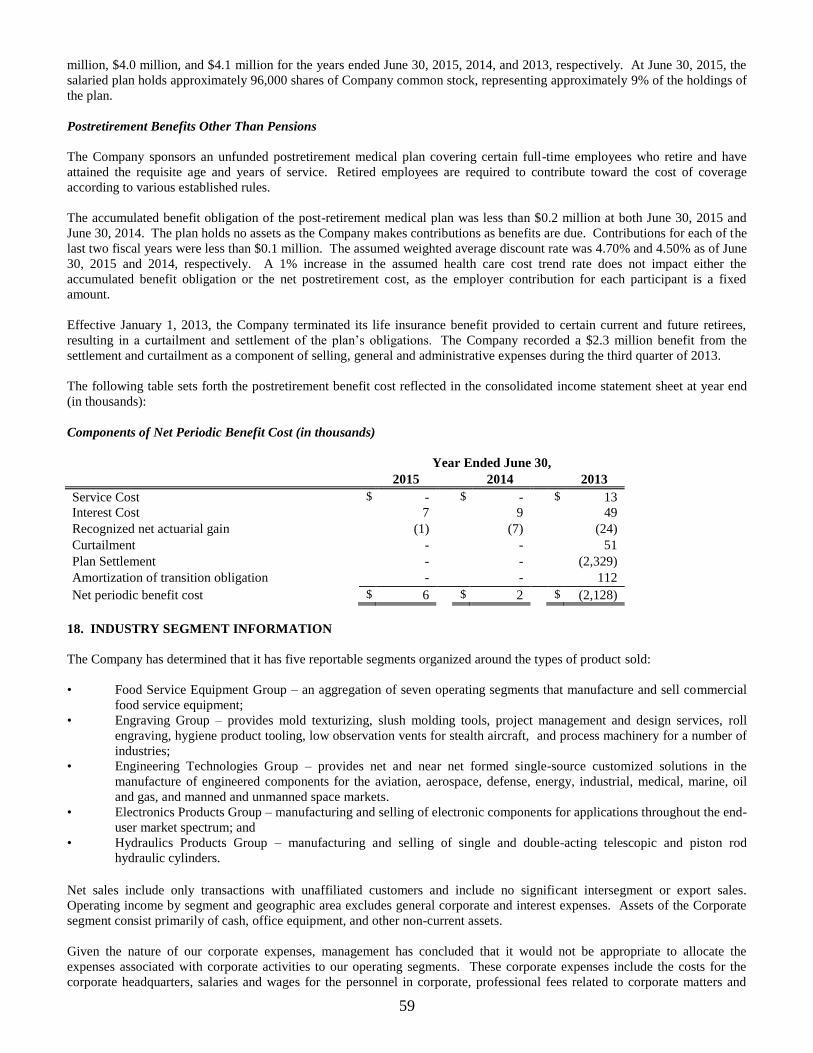
59
million, $4.0 million, and $4.1 million for the years ended June 30, 2015, 2014, and 2013, respectively. At June 30, 2015, the
salaried plan holds approximately 96,000 shares of Company common stock, representing approximately 9% of the holdings of
the plan.
Postretirement Benefits Other Than Pensions
The Company sponsors an unfunded postretirement medical plan covering certain full-time employees who retire and have
attained the requisite age and years of service. Retired employees are required to contribute toward the cost of coverage
according to various established rules.
The accumulated benefit obligation of the post-retirement medical plan was less than $0.2 million at both June 30, 2015 and
June 30, 2014. The plan holds no assets as the Company makes contributions as benefits are due. Contributions for each of the
last two fiscal years were less than $0.1 million. The assumed weighted average discount rate was 4.70% and 4.50% as of June
30, 2015 and 2014, respectively. A 1% increase in the assumed health care cost trend rate does not impact either the
accumulated benefit obligation or the net postretirement cost, as the employer contribution for each participant is a fixed
amount.
Effective January 1, 2013, the Company terminated its life insurance benefit provided to certain current and future retirees,
resulting in a curtailment and settlement of the plan’s obligations. The Company recorded a $2.3 million benefit from the
settlement and curtailment as a component of selling, general and administrative expenses during the third quarter of 2013.
The following table sets forth the postretirement benefit cost reflected in the consolidated income statement sheet at year end
(in thousands):
Components of Net Periodic Benefit Cost (in thousands)
Year Ended June 30,
2015 2014 2013
Service Cost $ - $ - $ 13
Interest Cost 7 9 49
Recognized net actuarial gain (1) (7) (24)
Curtailment - - 51
Plan Settlement - - (2,329)
Amortization of transition obligation - - 112
Net periodic benefit cost $ 6 $ 2 $ (2,128)
18. INDUSTRY SEGMENT INFORMATION
The Company has determined that it has five reportable segments organized around the types of product sold:
• Food Service Equipment Group – an aggregation of seven operating segments that manufacture and sell commercial
food service equipment;
• Engraving Group – provides mold texturizing, slush molding tools, project management and design services, roll
engraving, hygiene product tooling, low observation vents for stealth aircraft, and process machinery for a number of
industries;
• Engineering Technologies Group – provides net and near net formed single-source customized solutions in the
manufacture of engineered components for the aviation, aerospace, defense, energy, industrial, medical, marine, oil
and gas, and manned and unmanned space markets.
• Electronics Products Group – manufacturing and selling of electronic components for applications throughout the end-
user market spectrum; and
• Hydraulics Products Group – manufacturing and selling of single and double-acting telescopic and piston rod
hydraulic cylinders.
Net sales include only transactions with unaffiliated customers and include no significant intersegment or export sales.
Operating income by segment and geographic area excludes general corporate and interest expenses. Assets of the Corporate
segment consist primarily of cash, office equipment, and other non-current assets.
Given the nature of our corporate expenses, management has concluded that it would not be appropriate to allocate the
expenses associated with corporate activities to our operating segments. These corporate expenses include the costs for the
corporate headquarters, salaries and wages for the personnel in corporate, professional fees related to corporate matters and
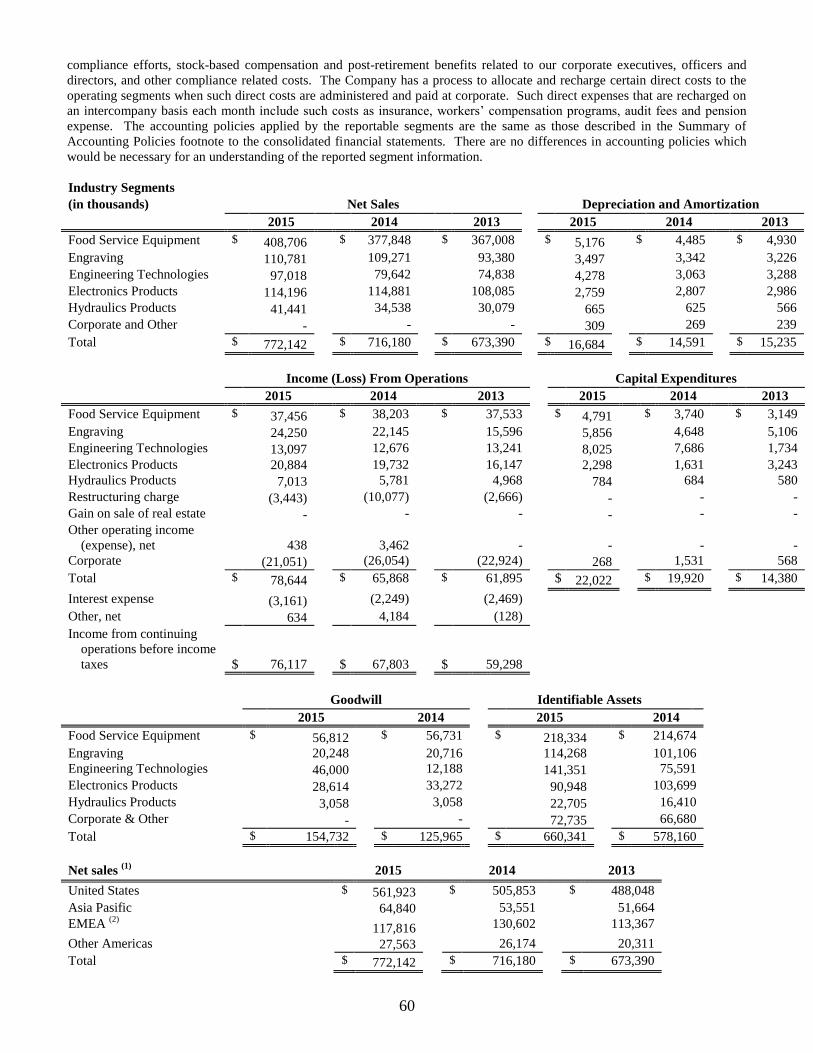
60
compliance efforts, stock-based compensation and post-retirement benefits related to our corporate executives, officers and
directors, and other compliance related costs. The Company has a process to allocate and recharge certain direct costs to the
operating segments when such direct costs are administered and paid at corporate. Such direct expenses that are recharged on
an intercompany basis each month include such costs as insurance, workers’ compensation programs, audit fees and pension
expense. The accounting policies applied by the reportable segments are the same as those described in the Summary of
Accounting Policies footnote to the consolidated financial statements. There are no differences in accounting policies which
would be necessary for an understanding of the reported segment information.
Industry Segments
(in thousands) Net Sales Depreciation and Amortization
2015 2014 2013 2015 2014 2013
Food Service Equipment $ 408,706 $ 377,848 $ 367,008 $ 5,176 $ 4,485 $ 4,930
Engraving 110,781 109,271 93,380 3,497 3,342 3,226
Engineering Technologies 97,018 79,642 74,838 4,278 3,063 3,288
Electronics Products 114,196 114,881 108,085 2,759 2,807 2,986
Hydraulics Products 41,441 34,538 30,079 665 625 566
Corporate and Other - - - 309 269 239
Total $ 772,142 $ 716,180 $ 673,390 $ 16,684 $ 14,591 $ 15,235
Income (Loss) From Operations Capital Expenditures
2015 2014 2013 2015 2014 2013
Food Service Equipment $ 37,456 $ 38,203 $ 37,533 $ 4,791 $ 3,740 $ 3,149
Engraving 24,250 22,145 15,596 5,856 4,648 5,106
Engineering Technologies 13,097 12,676 13,241 8,025 7,686 1,734
Electronics Products 20,884 19,732 16,147 2,298 1,631 3,243
Hydraulics Products 7,013 5,781 4,968 784 684 580
Restructuring charge (3,443) (10,077) (2,666) - - -
Gain on sale of real estate - - - - - -
Other operating income
(expense), net
438
3,462
-
-
-
-
Corporate (21,051) (26,054) (22,924) 268 1,531 568
Total $ 78,644 $ 65,868 $ 61,895 $ 22,022 $ 19,920 $ 14,380
Interest expense (3,161) (2,249) (2,469)
Other, net 634 4,184 (128)
Income from continuing
operations before income
taxes
$ 76,117
$
67,803
$
59,298
Goodwill Identifiable Assets
2015 2014 2015 2014
Food Service Equipment $ 56,812 $ 56,731 $ 218,334 $ 214,674
Engraving 20,248 20,716 114,268 101,106
Engineering Technologies 46,000 12,188 141,351 75,591
Electronics Products 28,614 33,272 90,948 103,699
Hydraulics Products 3,058 3,058 22,705 16,410
Corporate & Other - - 72,735 66,680
Total $ 154,732 $ 125,965 $ 660,341 $ 578,160
Net sales (1)
2015 2014 2013
United States $ 561,923 $ 505,853 $ 488,048
Asia Pasific 64,840 53,551 51,664
EMEA (2) 117,816 130,602 113,367
Other Americas 27,563 26,174 20,311
Total $ 772,142 $ 716,180 $ 673,390
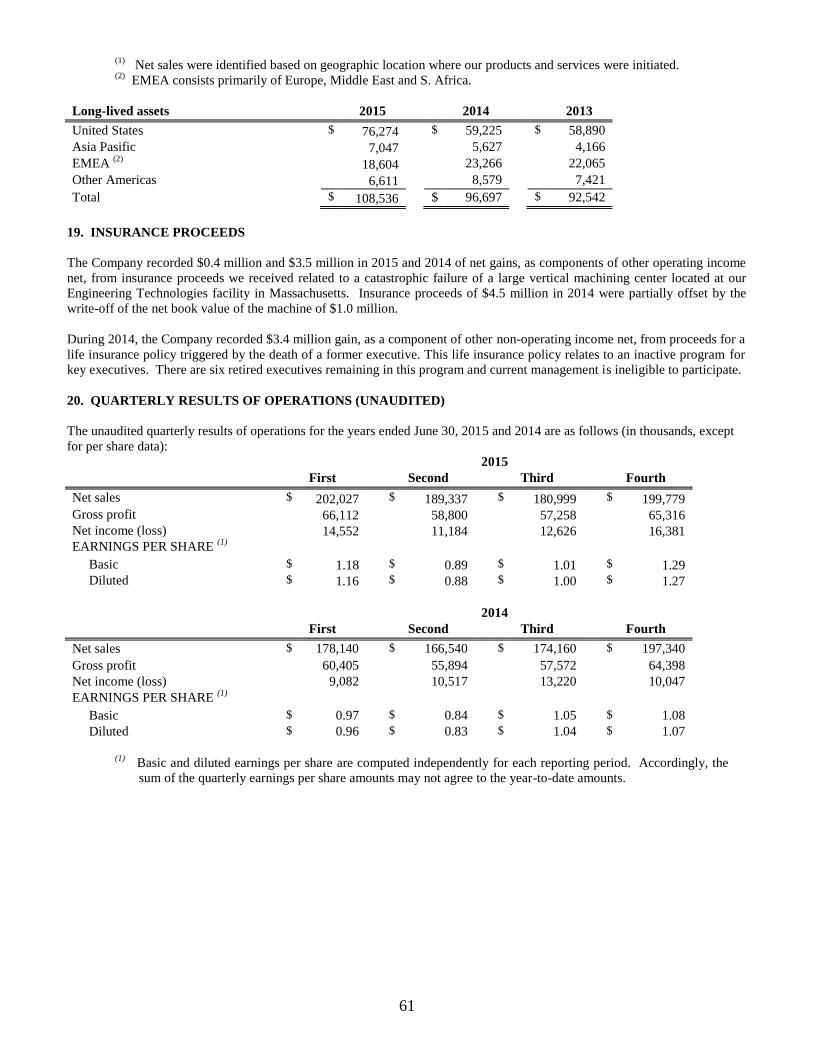
61
(1) Net sales were identified based on geographic location where our products and services were initiated.
(2) EMEA consists primarily of Europe, Middle East and S. Africa.
Long-lived assets 2015 2014 2013
United States $ 76,274 $ 59,225 $ 58,890
Asia Pasific 7,047 5,627 4,166
EMEA (2) 18,604 23,266 22,065
Other Americas 6,611 8,579 7,421
Total $ 108,536 $ 96,697 $ 92,542
19. INSURANCE PROCEEDS
The Company recorded $0.4 million and $3.5 million in 2015 and 2014 of net gains, as components of other operating income
net, from insurance proceeds we received related to a catastrophic failure of a large vertical machining center located at our
Engineering Technologies facility in Massachusetts. Insurance proceeds of $4.5 million in 2014 were partially offset by the
write-off of the net book value of the machine of $1.0 million.
During 2014, the Company recorded $3.4 million gain, as a component of other non-operating income net, from proceeds for a
life insurance policy triggered by the death of a former executive. This life insurance policy relates to an inactive program for
key executives. There are six retired executives remaining in this program and current management is ineligible to participate.
20. QUARTERLY RESULTS OF OPERATIONS (UNAUDITED)
The unaudited quarterly results of operations for the years ended June 30, 2015 and 2014 are as follows (in thousands, except
for per share data):
2015
First Second Third Fourth
Net sales $ 202,027 $ 189,337 $ 180,999 $ 199,779
Gross profit 66,112 58,800 57,258 65,316
Net income (loss) 14,552 11,184 12,626 16,381
EARNINGS PER SHARE (1)
Basic $ 1.18 $ 0.89 $ 1.01 $ 1.29
Diluted $ 1.16 $ 0.88 $ 1.00 $ 1.27
2014
First Second Third Fourth
Net sales $ 178,140 $ 166,540 $ 174,160 $ 197,340
Gross profit 60,405 55,894 57,572 64,398
Net income (loss) 9,082 10,517 13,220 10,047
EARNINGS PER SHARE (1)
Basic $ 0.97 $ 0.84 $ 1.05 $ 1.08
Diluted $ 0.96 $ 0.83 $ 1.04 $ 1.07
(1)
Basic and diluted earnings per share are computed independently for each reporting period. Accordingly, the
sum of the quarterly earnings per share amounts may not agree to the year-to-date amounts.
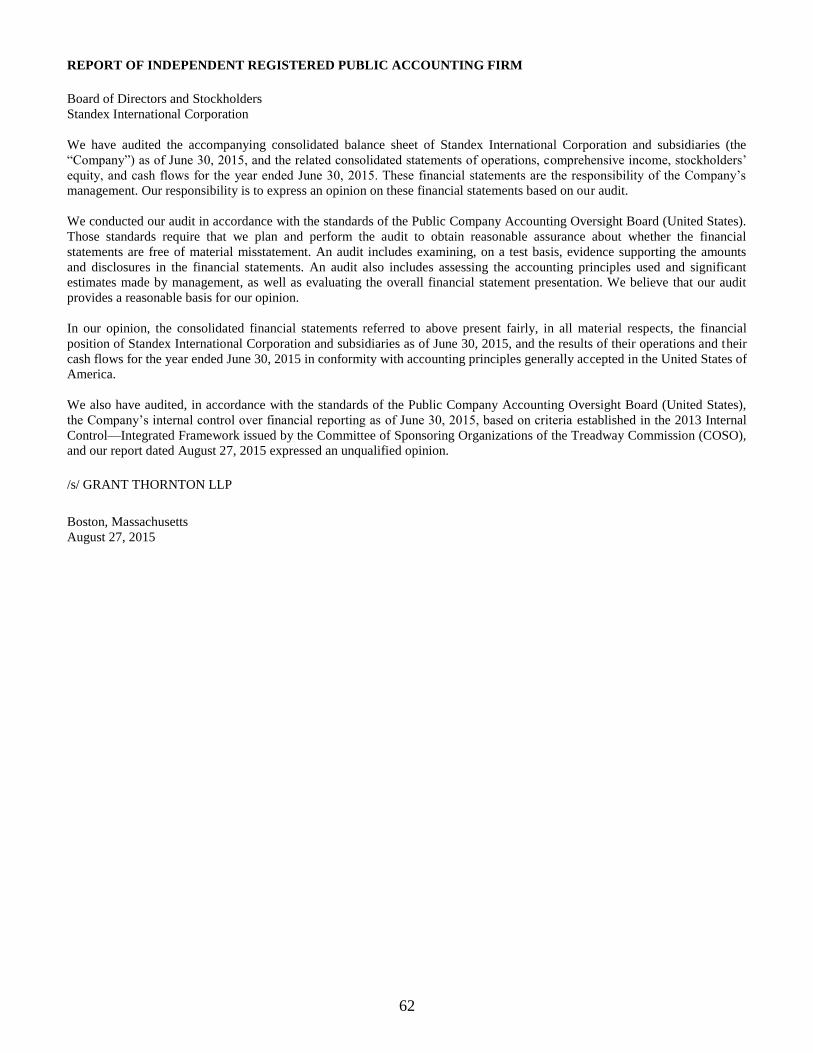
62
REPORT OF INDEPENDENT REGISTERED PUBLIC ACCOUNTING FIRM
Board of Directors and Stockholders
Standex International Corporation
We have audited the accompanying consolidated balance sheet of Standex International Corporation and subsidiaries (the
“Company”) as of June 30, 2015, and the related consolidated statements of operations, comprehensive income, stockholders’
equity, and cash flows for the year ended June 30, 2015. These financial statements are the responsibility of the Company’s
management. Our responsibility is to express an opinion on these financial statements based on our audit.
We conducted our audit in accordance with the standards of the Public Company Accounting Oversight Board (United States).
Those standards require that we plan and perform the audit to obtain reasonable assurance about whether the financial
statements are free of material misstatement. An audit includes examining, on a test basis, evidence supporting the amounts
and disclosures in the financial statements. An audit also includes assessing the accounting principles used and significant
estimates made by management, as well as evaluating the overall financial statement presentation. We believe that our audit
provides a reasonable basis for our opinion.
In our opinion, the consolidated financial statements referred to above present fairly, in all material respects, the financial
position of Standex International Corporation and subsidiaries as of June 30, 2015, and the results of their operations and their
cash flows for the year ended June 30, 2015 in conformity with accounting principles generally accepted in the United States of
America.
We also have audited, in accordance with the standards of the Public Company Accounting Oversight Board (United States),
the Company’s internal control over financial reporting as of June 30, 2015, based on criteria established in the 2013 Internal
Control—Integrated Framework issued by the Committee of Sponsoring Organizations of the Treadway Commission (COSO),
and our report dated August 27, 2015 expressed an unqualified opinion.
/s/ GRANT THORNTON LLP
Boston, Massachusetts
August 27, 2015
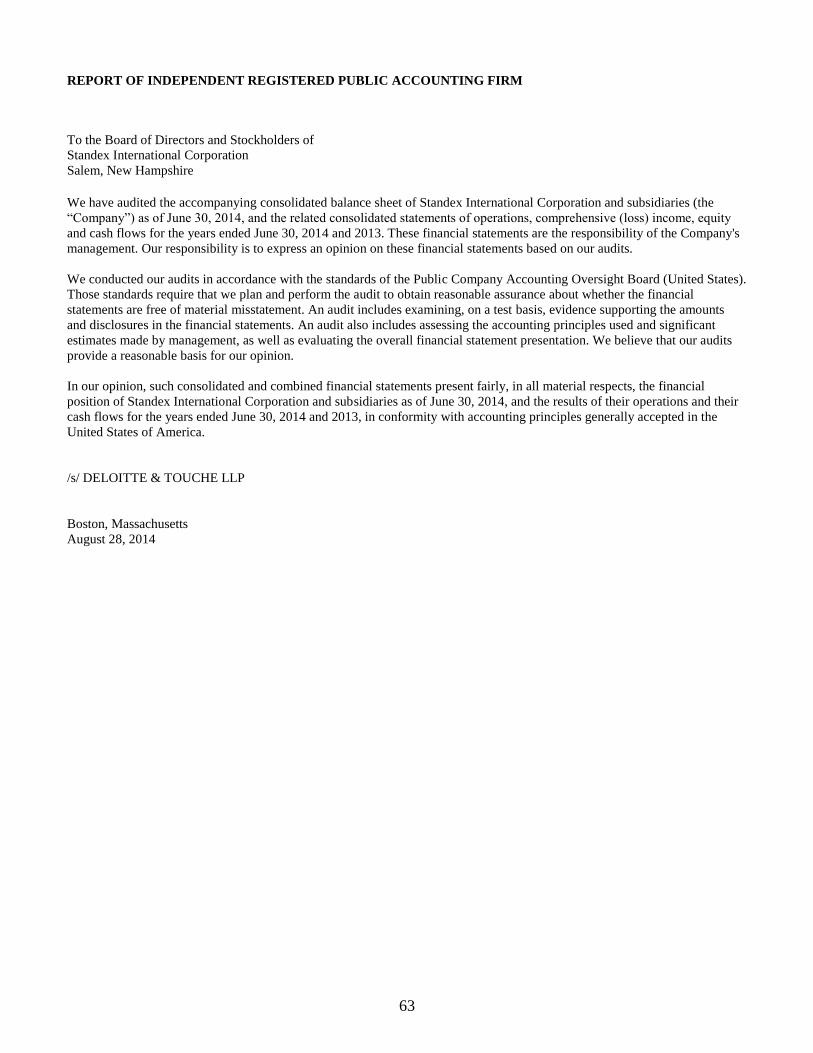
63
REPORT OF INDEPENDENT REGISTERED PUBLIC ACCOUNTING FIRM
To the Board of Directors and Stockholders of
Standex International Corporation
Salem, New Hampshire
We have audited the accompanying consolidated balance sheet of Standex International Corporation and subsidiaries (the
“Company”) as of June 30, 2014, and the related consolidated statements of operations, comprehensive (loss) income, equity
and cash flows for the years ended June 30, 2014 and 2013. These financial statements are the responsibility of the Company's
management. Our responsibility is to express an opinion on these financial statements based on our audits.
We conducted our audits in accordance with the standards of the Public Company Accounting Oversight Board (United States).
Those standards require that we plan and perform the audit to obtain reasonable assurance about whether the financial
statements are free of material misstatement. An audit includes examining, on a test basis, evidence supporting the amounts
and disclosures in the financial statements. An audit also includes assessing the accounting principles used and significant
estimates made by management, as well as evaluating the overall financial statement presentation. We believe that our audits
provide a reasonable basis for our opinion.
In our opinion, such consolidated and combined financial statements present fairly, in all material respects, the financial
position of Standex International Corporation and subsidiaries as of June 30, 2014, and the results of their operations and their
cash flows for the years ended June 30, 2014 and 2013, in conformity with accounting principles generally accepted in the
United States of America.
/s/ DELOITTE & TOUCHE LLP
Boston, Massachusetts
August 28, 2014
64
Item 9. Changes In and Disagreements with Accountants on Accounting and Financial Disclosure
Not Applicable
Item 9A. Controls and Procedures
The management of the Company including its Chief Executive Officer, and Chief Financial Officer, have conducted an
evaluation of the effectiveness of the Company’s disclosure controls and procedures (as such term is defined in Rules 13a-
15(e) and 15(d)-15(e) under the Securities Exchange Act of 1934, as amended, (the “Exchange Act”) as of the end of the period
covered by this report. Based on that evaluation, the Chief Executive Officer and Chief Financial Officer concluded as of June
30, 2015, that the disclosure controls and procedures are effective in ensuring that the information required to be disclosed by
the Company in reports that it files or submits under the Exchange Act is (i) recorded, processed, summarized and reported
within the time periods specified in the Commission's rules and forms and (ii) that such information is accumulated and
communicated to the Company’s management, including its Chief Executive Officer and Chief Financial Officer as appropriate
to allow timely decisions regarding required disclosure.
SEC guidance permits the exclusion of an evaluation of the effectiveness of a registrant's disclosure controls and procedures as
they relate to the internal control over financial reporting for an acquired business during the first year following such
acquisition. As discussed in Note 2 to the consolidated financial statements contained in this Report; the Company acquired all
of the outstanding stock of MPE Aeroengines, Inc. including its wholly owned subsidiary Enginetics Corporation,
(“Enginetics”) on September 4, 2014. Enginetics represents 3.1% of the Company's consolidated revenue for the year ended
June 30, 2015 and approximately 10.1% of the Company's consolidated assets at June 30, 2015. Management's evaluation and
conclusion as to the effectiveness of the design and operation of the Company’s disclosure controls and procedures as of
June 30, 2015 excludes any evaluation of the internal control over financial reporting of Enginetics.
There were no changes in the Company’s internal control over financial reporting identified in connection with management’s
evaluation that occurred during the fourth quarter of our fiscal year (ended June 30, 2015) that has materially affected, or is
reasonably likely to materially affect our internal control over financial reporting.
Management's Report on Internal Control over Financial Reporting
The management of Standex is responsible for establishing and maintaining adequate internal control over financial reporting
(as defined in Section 240.13a-15(f) of the Exchange Act). The Company’s internal control over financial reporting is
designed to provide reasonable assurance as to the reliability of the Company’s financial reporting and the preparation of
financial statements for external purposes in accordance with generally accepted accounting principles. Management,
including the Chief Executive Officer and the Chief Financial Officer, assessed the effectiveness of our internal control over
financial reporting as of the end of the fiscal year covered by this report on Form 10-K. In making this assessment,
management used the criteria established by the Committee of Sponsoring Organizations of the Treadway Commission in
“Internal Control-Integrated Framework (2013).” These criteria are in the areas of control environment, risk assessment,
control activities, information and communication and monitoring. Management’s assessment included documenting,
evaluating and testing the design and operating effectiveness of our internal control over financial reporting.
Based on the Company’s processes, as described above, management, including the Chief Executive Officer and the Chief
Financial Officer, has concluded that our internal control over financial reporting was effective as of June 30, 2015 to provide
reasonable assurance of achieving its objectives. These results were reviewed with the Audit Committee of the Board of
Directors. Grant Thornton, LLP, the independent registered public accounting firm that audited our consolidated financial
statements included in this Annual Report on Form 10-K, has issued an unqualified attestation report on the Company’s
internal control over financial reporting, which is included below.
Inherent Limitation on Effectiveness of Controls
No matter how well designed, internal control over financial reporting has inherent limitations. Internal control over financial
reporting determined to be effective can provide only reasonable, not absolute, assurance with respect to financial statement
preparation and may not prevent or detect all misstatements that might be due to error or fraud. In addition, a design of a
control system must reflect the fact that there are resource constraints, and the benefits of controls must be considered relative
to their costs. Because of the inherent limitations in all control systems, no evaluation of controls can provide absolute
assurance that all control issues and instances of fraud, if any, within the Company have been detected.
65
REPORT OF INDEPENDENT REGISTERED PUBLIC ACCOUNTING FIRM
Board of Directors and Stockholders
Standex International Corporation
We have audited the internal control over financial reporting of Standex International Corporation and subsidiaries (the
“Company”) as of June 30, 2015, based on criteria established in the 2013 Internal Control—Integrated Framework issued by
the Committee of Sponsoring Organizations of the Treadway Commission (COSO). The Company’s management is
responsible for maintaining effective internal control over financial reporting and for its assessment of the effectiveness of
internal control over financial reporting, included in the accompanying Management’s Report on Internal Control over
Financial Reporting (“Management’s Report”). Our responsibility is to express an opinion on the Company’s internal control
over financial reporting based on our audit. Our audit of, and opinion on, the Company’s internal control over financial
reporting does not include the internal control over financial reporting of Enginetics Corporation, a wholly-owned subsidiary,
whose financial statements reflect total assets and revenues constituting 10% and 4% percent, respectively, of the related
consolidated financial statement amounts as of and for the year ended June 30, 2015. As indicated in Management’s Report,
Enginetics Corporation was acquired during the year ended June 30, 2015. Management’s assertion on the effectiveness of the
Company’s internal control over financial reporting excluded internal control over financial reporting of Enginetics
Corporation.
We conducted our audit in accordance with the standards of the Public Company Accounting Oversight Board (United States).
Those standards require that we plan and perform the audit to obtain reasonable assurance about whether effective internal
control over financial reporting was maintained in all material respects. Our audit included obtaining an understanding of
internal control over financial reporting, assessing the risk that a material weakness exists, testing and evaluating the design
and operating effectiveness of internal control based on the assessed risk, and performing such other procedures as we
considered necessary in the circumstances. We believe that our audit provides a reasonable basis for our opinion.
A company’s internal control over financial reporting is a process designed to provide reasonable assurance regarding the
reliability of financial reporting and the preparation of financial statements for external purposes in accordance with generally
accepted accounting principles. A company’s internal control over financial reporting includes those policies and procedures
that (1) pertain to the maintenance of records that, in reasonable detail, accurately and fairly reflect the transactions and
dispositions of the assets of the company; (2) provide reasonable assurance that transactions are recorded as necessary to
permit preparation of financial statements in accordance with generally accepted accounting principles, and that receipts and
expenditures of the company are being made only in accordance with authorizations of management and directors of the
company; and (3) provide reasonable assurance regarding prevention or timely detection of unauthorized acquisition, use, or
disposition of the company’s assets that could have a material effect on the financial statements.
Because of its inherent limitations, internal control over financial reporting may not prevent or detect misstatements. Also,
projections of any evaluation of effectiveness to future periods are subject to the risk that controls may become inadequate
because of changes in conditions, or that the degree of compliance with the policies or procedures may deteriorate.
In our opinion, the Company maintained, in all material respects, effective internal control over financial reporting as of June
30, 2015, based on criteria established in the 2013 Internal Control—Integrated Framework issued by COSO.
We also have audited, in accordance with the standards of the Public Company Accounting Oversight Board (United States),
the consolidated financial statements of the Company as of and for the year ended June 30, 2015, and our report dated
August 27, 2015 expressed an unqualified opinion on those financial statements.
/s/ GRANT THORNTON LLP
Boston, Massachusetts
August 27, 2015

66
Item 9B. Other Information
None
PART III
Item 10. Directors, Executive Officers and Corporate Governance
The Company will file with the Securities and Exchange Commission (“SEC”) a definitive Proxy Statement no later than 120
days after the close of the fiscal year ended June 30, 2015 (the “Proxy Statement”). The information required by this item and
not provided in Part 1 of this report under Item 1 “Executive Officers of Standex” is incorporated by reference from the Proxy
Statement under the captions “Election of Directors,” “Stock Ownership in the Company,” “Other Information Concerning the
Company, Board of Directors and its Committees” and “Section 16(a) Beneficial Ownership Reporting Compliance.”
There have been no material changes to the procedures by which security holders may recommend nominees to our Board of
Directors. Information regarding the process for identifying and evaluating candidates for director are set forth and
incorporated in reference to the information in the Proxy Statement under the caption “Corporate Governance/Nominating
Committee Report.”
Information regarding the Audit Committee Financial Expert and the identification of the Audit Committee is incorporated by
reference to the information in the Proxy Statement under the caption “Other Information Concerning the Company Board of
Directors and its Committee, Audit Committee.” The Audit Committee is established in accordance with Section 3(a)(58)(A)
of the Securities Exchange Act.
We maintain a corporate governance section on our website, which includes our code of ethics for senior financial
management that applies to our chief executive officer, principal financial officer, principal accounting officer, controller or
persons performing similar functions. Our corporate governance section also includes our code of business conduct and ethics
for all employees. In addition, we will promptly post any amendments to or waivers of the code of ethics for senior financial
management on our website. You can find this and other corporate governance information at www.standex.com.
Item 11. Executive Compensation
Information regarding executive compensation is incorporated by reference from the Proxy Statement under the captions and
sub-captions: “Executive Compensation,” “Compensation Discussion and Analysis,” “Report of the Compensation
Committee,” “2015 Summary Compensation Table,” “Other Information Concerning the Company Board of Directors and Its
Committees,” and “Directors Compensation.”
Item 12. Security Ownership of Certain Beneficial Owners and Management and Related Stockholder Matters
The stock ownership of each person known to Standex to be the beneficial owner of more than 5% of its Common Stock is
incorporated by reference in the Proxy Statement under the caption “Stock Ownership of Certain Beneficial Owners.” The
beneficial ownership of Standex Common Stock of all directors and executive officers of the Company is incorporated by
reference in the Proxy Statement under the caption and sub-caption “Stock Ownership in the Company” and “Stock
Ownership by Directors, Nominees for Directors and Executive Officers,” respectively.
The Equity Compensation Plan table below represents information regarding the Company’s equity based compensation plan
at June 30, 2015.
(A) (B) (C)
Number of Securities To Weighted-Average Number of Securities Remaining
Be Issued Upon Exercise Exercise Price Of Available For Future Issuance Under
Of Outstanding Options, Outstanding Options, Equity Compensation Plans (Excluding
Plan Category Warrants And Rights Warrants And Rights Securities reflected in Column (A))
Equity compensation plans
approved by stockholders
201,132
$ 9.03
390,394
Equity compensation plans not
approved by stockholders
-
-
-
Total 201,132 $ 9.03 390,394
The Company has one equity compensation plan, approved by stockholders, under which equity securities of the Company
67
have been authorized for issuance to employees and non-employee directors. This plan is further described in the “Notes to
Consolidated Financial Statements” under the heading “Stock-Based Compensation and Purchase Plans.”
Item 13. Certain Relationships and Related Transactions and Director Independence
Information regarding certain relationships and related transactions is incorporated by reference in the Proxy Statement under
the caption and sub-caption “Certain Relationships and Related Transactions” And “Stock Ownership by Directors, Nominees
for Director and Executive Officers,” respectively.
Information regarding director independence is incorporated by reference in the Proxy Statement under the caption “Election
of Directors - Determination of Independence.”
Item 14. Principal Accountant Fees and Services
This Information in addition to information regarding aggregate fees billed for each of the last two fiscal years for professional
services rendered by the professional accountant for audit of the Company’s annual financial statements and review of financial
statements included in the Company’s Form 10-K as well as others are incorporated by reference in the Proxy Statement under
the caption “Independent Auditors’ Fees.”
PART IV
Item 15. Exhibits and Financial Statement Schedules
(a)(1) Financial Statements
Financial Statements covered by the Reports of Independent Registered Public Accounting Firm
(A) Consolidated Statements of Operations for the fiscal years ended June 30, 2015, 2014 and 2013
(B) Consolidated Balance Sheets as of June 30, 2015 and 2014
(C) Consolidated Statements of Stockholders’ Equity and Comprehensive Income for the fiscal years ended
June 30, 2015, 2014 and 2013
(D) Consolidated Statements of Cash Flows for the fiscal years ended June 30, 2015, 2014 and 2013
(E) Notes to Consolidated Financial Statements
(2) Financial Statements Schedule
The following financial statement schedule is included as required by Item 8 to this report on Form 10-K
Schedule II – Valuation and Qualifying Accounts is included in the Notes to Consolidated Financial Statements
All other schedules are not required and have been omitted
(3) Exhibits
Incorporated
Exhibit by Reference Filed
Number Exhibit Description Form Date Herewith
(b) 3. (i) Restated Certificate of Incorporation of Standex, 10-Q 12/31/1998
dated October 27, 1998 filed as Exhibit 3(i).
(ii) By-Laws of Standex, as amended, and restated 8-K 2/4/2015
effective January 30, 2015 filed as Item 5.03, Exhibit 3.1
4. (a) Agreement of the Company, dated September 15, 1981, 10-K 6/30/1981
to furnish a copy of any instrument with respect to
certain other long-term debt to the Securities and
Exchange Commission upon its request filed as
Exhibit 4.
10. (a) Amended and Restated Employment Agreement 10-K 6/30/2010
dated August 25, 2010 between the Company
68
and Roger L. Fix*
(b) Non-Competition Agreement between the 8-K 12/3/2014
Company and John Abbott dated December 1, 2014
Filed as Item 5.02(e), Exhibit 10*
(c) Amended and Restated Employment Agreement 10-K 6/30/2010
dated August 25, 2010 between the Company
and John Abbott*
(d) Amended and Restated Employment Agreement 10-K 6/30/2010
dated August 25, 2010 between the Company
and Thomas D. DeByle*
(e) Amended and Restated Employment Agreement 10-K 6/30/2010
dated August 25, 2010 between the Company
and Deborah A. Rosen*
(f) Employment Agreement dated 10-Q 9/30/2013
August 2, 2012 between the Company
And Michael A. Patterson*
(g) Standex International Corporation Amended and 10-K 6/30/2012
And Restated 2008 Long Term Incentive Plan,
effective October 28, 2008. Filed as Exhibit 10.*
(h) Standex International Corporation Executive 10-Q 3/31/2001
Security Program, as amended and restated on
January 31, 2001 filed as Exhibit 10(a).*
(i) Standex International Corporation Executive Life 10-K 6/30/2001
Insurance Plan effective April 27, 1994 and as
Amended and restated on April 25, 2001 filed
as Exhibit 10(k).*
(j) Standex International Corporation Supplemental 10-K 6/30/1995
Retirement Plan adopted April 26, 1995 and
Amended on July 26, 1995 filed as Exhibit 10(n).*
(k) Form of Indemnification Agreement for directors 8-K 5/5/2008
and executive officers of the Company filed as
Item 1.01, Exhibit 10.*
(l) Executive Officer long-term performance share 8-K 8/28/2008
Unit awards filed as Item 5.02.*
(m) Standex Deferred Compensation Plan for highly 8-K 1/31/2008
compensated employees filed as Item 5.02.*
(n) Restricted Stock Unit Award granted to Roger L. 8-K 1/27/2006
Fix dated January 25, 2006 filed as Item 1.01.*
(o) Amended and Restated Credit Agreement 8-K 12/19/2014
Dated December 19, 2014 by and among
Standex International Corporation, Citizens Bank, N.A.;
Bank of America, N.A.; TD Bank, N.A.;
JPMorgan Chase Bank, N.A.; Branch Banking
& Trust Company and Santander Bank, N.A.
Filed as Item 1.01, Exhibit 10
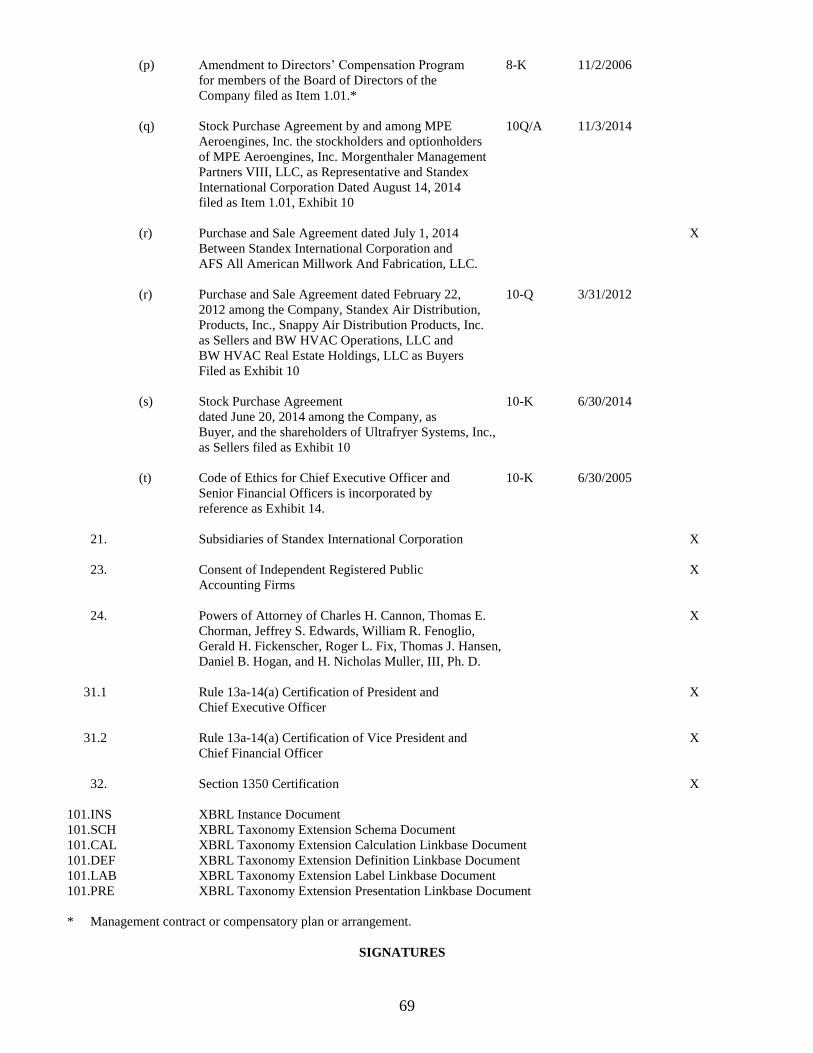
69
(p) Amendment to Directors’ Compensation Program 8-K 11/2/2006
for members of the Board of Directors of the
Company filed as Item 1.01.*
(q) Stock Purchase Agreement by and among MPE 10Q/A 11/3/2014
Aeroengines, Inc. the stockholders and optionholders
of MPE Aeroengines, Inc. Morgenthaler Management
Partners VIII, LLC, as Representative and Standex
International Corporation Dated August 14, 2014
filed as Item 1.01, Exhibit 10
(r) Purchase and Sale Agreement dated July 1, 2014 X
Between Standex International Corporation and
AFS All American Millwork And Fabrication, LLC.
(r) Purchase and Sale Agreement dated February 22, 10-Q 3/31/2012
2012 among the Company, Standex Air Distribution,
Products, Inc., Snappy Air Distribution Products, Inc.
as Sellers and BW HVAC Operations, LLC and
BW HVAC Real Estate Holdings, LLC as Buyers
Filed as Exhibit 10
(s) Stock Purchase Agreement 10-K 6/30/2014
dated June 20, 2014 among the Company, as
Buyer, and the shareholders of Ultrafryer Systems, Inc.,
as Sellers filed as Exhibit 10
(t) Code of Ethics for Chief Executive Officer and 10-K 6/30/2005
Senior Financial Officers is incorporated by
reference as Exhibit 14.
21. Subsidiaries of Standex International Corporation X
23. Consent of Independent Registered Public X
Accounting Firms
24. Powers of Attorney of Charles H. Cannon, Thomas E. X
Chorman, Jeffrey S. Edwards, William R. Fenoglio,
Gerald H. Fickenscher, Roger L. Fix, Thomas J. Hansen,
Daniel B. Hogan, and H. Nicholas Muller, III, Ph. D.
31.1 Rule 13a-14(a) Certification of President and X
Chief Executive Officer
31.2 Rule 13a-14(a) Certification of Vice President and X
Chief Financial Officer
32. Section 1350 Certification X
101.INS XBRL Instance Document
101.SCH XBRL Taxonomy Extension Schema Document
101.CAL XBRL Taxonomy Extension Calculation Linkbase Document
101.DEF XBRL Taxonomy Extension Definition Linkbase Document
101.LAB XBRL Taxonomy Extension Label Linkbase Document
101.PRE XBRL Taxonomy Extension Presentation Linkbase Document
* Management contract or compensatory plan or arrangement.
SIGNATURES
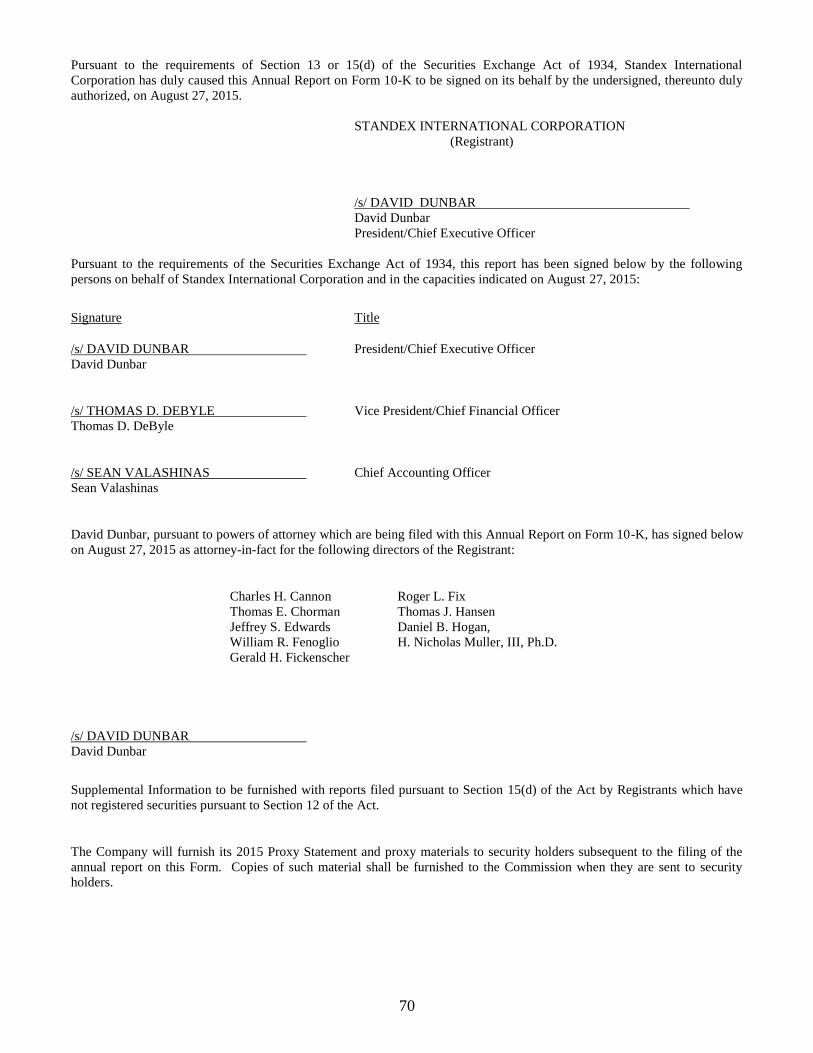
70
Pursuant to the requirements of Section 13 or 15(d) of the Securities Exchange Act of 1934, Standex International
Corporation has duly caused this Annual Report on Form 10-K to be signed on its behalf by the undersigned, thereunto duly
authorized, on August 27, 2015.
STANDEX INTERNATIONAL CORPORATION
(Registrant)
/s/ DAVID DUNBAR
David Dunbar
President/Chief Executive Officer
Pursuant to the requirements of the Securities Exchange Act of 1934, this report has been signed below by the following
persons on behalf of Standex International Corporation and in the capacities indicated on August 27, 2015:
Signature Title
/s/ DAVID DUNBAR President/Chief Executive Officer
David Dunbar
/s/ THOMAS D. DEBYLE Vice President/Chief Financial Officer
Thomas D. DeByle
/s/ SEAN VALASHINAS Chief Accounting Officer
Sean Valashinas
David Dunbar, pursuant to powers of attorney which are being filed with this Annual Report on Form 10-K, has signed below
on August 27, 2015 as attorney-in-fact for the following directors of the Registrant:
Charles H. Cannon Roger L. Fix
Thomas E. Chorman Thomas J. Hansen
Jeffrey S. Edwards Daniel B. Hogan,
William R. Fenoglio H. Nicholas Muller, III, Ph.D.
Gerald H. Fickenscher
/s/ DAVID DUNBAR
David Dunbar
Supplemental Information to be furnished with reports filed pursuant to Section 15(d) of the Act by Registrants which have
not registered securities pursuant to Section 12 of the Act.
The Company will furnish its 2015 Proxy Statement and proxy materials to security holders subsequent to the filing of the
annual report on this Form. Copies of such material shall be furnished to the Commission when they are sent to security
holders.
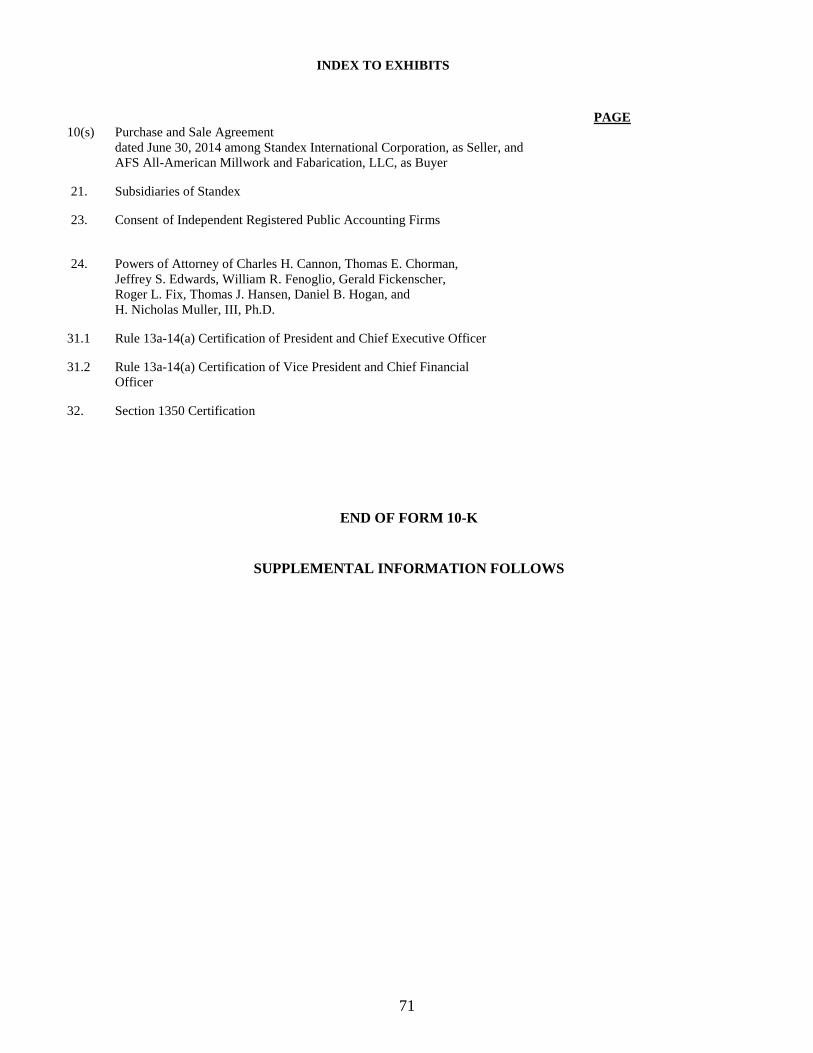
71
INDEX TO EXHIBITS
PAGE
10(s) Purchase and Sale Agreement
dated June 30, 2014 among Standex International Corporation, as Seller, and
AFS All-American Millwork and Fabarication, LLC, as Buyer
21. Subsidiaries of Standex
23. Consent of Independent Registered Public Accounting Firms
24. Powers of Attorney of Charles H. Cannon, Thomas E. Chorman,
Jeffrey S. Edwards, William R. Fenoglio, Gerald Fickenscher,
Roger L. Fix, Thomas J. Hansen, Daniel B. Hogan, and
H. Nicholas Muller, III, Ph.D.
31.1 Rule 13a-14(a) Certification of President and Chief Executive Officer
31.2 Rule 13a-14(a) Certification of Vice President and Chief Financial
Officer
32. Section 1350 Certification
END OF FORM 10-K
SUPPLEMENTAL INFORMATION FOLLOWS
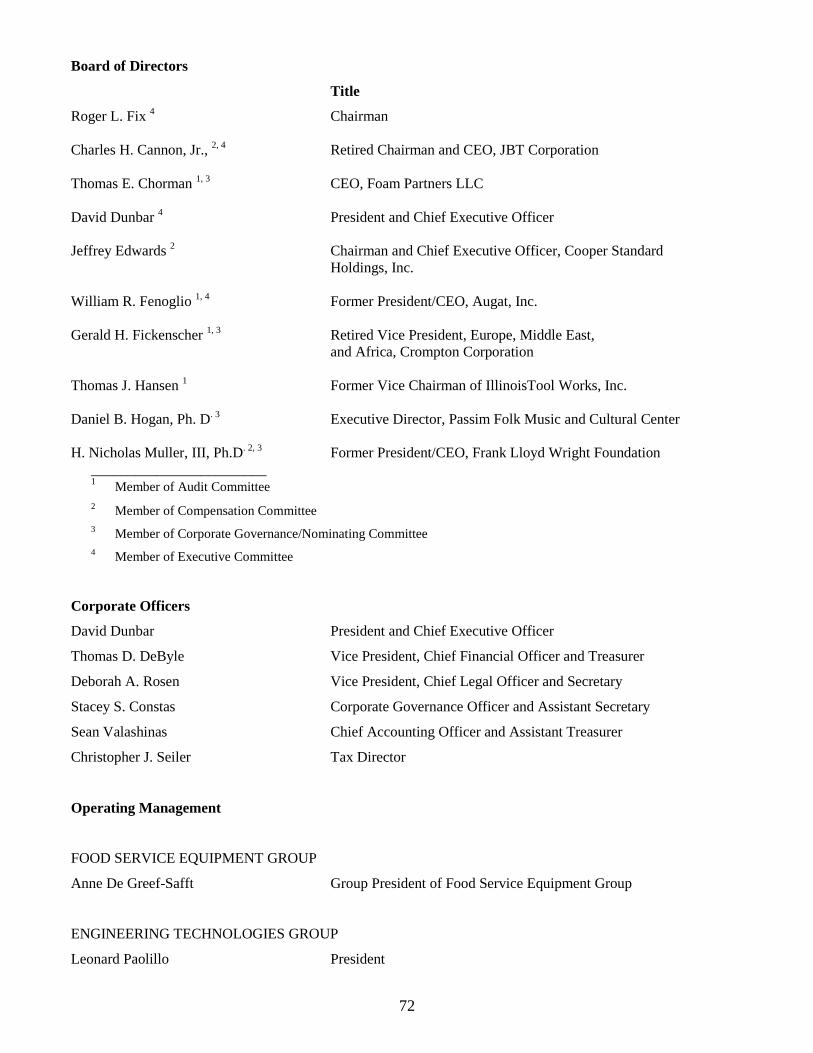
72
Board of Directors
Title
Roger L. Fix 4
Chairman
Charles H. Cannon, Jr., 2, 4
Retired Chairman and CEO, JBT Corporation
Thomas E. Chorman 1, 3
CEO, Foam Partners LLC
David Dunbar 4 President and Chief Executive Officer
Jeffrey Edwards 2 Chairman and Chief Executive Officer, Cooper Standard
Holdings, Inc.
William R. Fenoglio 1, 4
Former President/CEO, Augat, Inc.
Gerald H. Fickenscher 1, 3
Retired Vice President, Europe, Middle East,
and Africa, Crompton Corporation
Thomas J. Hansen 1 Former Vice Chairman of IllinoisTool Works, Inc.
Daniel B. Hogan, Ph. D. 3
Executive Director, Passim Folk Music and Cultural Center
H. Nicholas Muller, III, Ph.D. 2, 3
Former President/CEO, Frank Lloyd Wright Foundation
________________________ 1
Member of Audit Committee
2 Member of Compensation Committee
3 Member of Corporate Governance/Nominating Committee
4 Member of Executive Committee
Corporate Officers
David Dunbar President and Chief Executive Officer
Thomas D. DeByle Vice President, Chief Financial Officer and Treasurer
Deborah A. Rosen Vice President, Chief Legal Officer and Secretary
Stacey S. Constas Corporate Governance Officer and Assistant Secretary
Sean Valashinas Chief Accounting Officer and Assistant Treasurer
Christopher J. Seiler Tax Director
Operating Management
FOOD SERVICE EQUIPMENT GROUP
Anne De Greef-Safft Group President of Food Service Equipment Group
ENGINEERING TECHNOLOGIES GROUP
Leonard Paolillo President
73
ENGRAVING GROUP
Phillip R. Whisman President
ELECTRONICS PRODUCTS GROUP
John Meeks President
HYDRAULICS PRODUCTS GROUP
Richard Hiltunen President
Shareholder Information
Corporate Headquarters Standex International Corporation
11 Keewaydin Drive
Salem, NH 03079
(603) 893-9701
Facsimile: (603) 893-7324
www.standex.com
Common Stock Listed on the New York Stock Exchange
(Ticker symbol: SXI)
Transfer Agent and Registrar Computershare
250 Royall Street
Canton, MA 07021
(800) 368-5948
www.Computershare.com
Independent Auditors Grant Thornton LLP
75 State Street, 13th Floor
Boston, MA 02109-1827
Shareholder Services Stockholders should contact Standex’s Transfer Agent
(Computershare, 250 Royall Street, Canton, MA 02021) regarding
changes in name, address or ownership of stock; lost certificates of
dividends; and consolidation of accounts.
Stockholders’ Meeting The Annual Meeting of Stockholders will be held at 11:00 a.m. on
Wednesday, October 28, 2015 at the Burlington Marriott, One
Burlington Mall Road, Burlington, MA 01803.