1. features - sensor technology: humidity, co2, flow...
TRANSCRIPT

1EEH110 v1.0 / Modification rights reserved
Well proven humidity sensor element, state-of-the-art ASIC technology and highly
EEH110
accurate humidity and temperature adjustment represent the basis for outstanding performance of the digital humidity and temperature sensor EEH110. The proprietary E+E coating protects the sensor against dirt and corrosion, which leads to excellent long-term stability even in polluted environment. The measured values are available on the digital interfaces I2C, PWM and PDM as well as on an analogue voltage output.
1. Features
• Multipoint humidity / temperature factory calibration• Excellent long term stability due to the E+E proprietary
coating • Long standing proven sensor technology
• DFN enclosure 3.6 x 2.8 x 0.75 mm• 3 digital interfaces: I2C, PWM and PDM + analogue
humidity voltage output• Supply voltage 5 V
E+E Multipoint humidity / temperature calibration
Integrated sensor protection
10 PIN, DFN enclosure
FRONT BACK
Figure 1: Description
2. Dimensions (mm/inch)
2.8 (0.11)
3.6
(0.1
4)
1.285 (0.05)
1.28
5 (0
.05)
2.77
(0.1
1)
0.8 (0.03)
0.75(0.03)
0.2 (0.008)
0.3 (0.012)
3.1
(0.1
2)
1.7(0.067)
0.3
(0.0
12)
2.8 (0.11)
0.75
(0.0
3)
0.65
(0
.026
)
0.35
(0
.014
)
Figure 2: Dimensions
eeh110 Digital humidity and temperature sensor

v1.0 / Modification rights reserved 2 EEH110
3. sensor PerFormance
EEH110 is a relative humidity sensor and temperature sensor with band gap circuit, it contains oscillator, A/D convertor, regulator, D/A convertor, NVM, digital processing unit and calibration circuit.
3.1. relative humiDity sensor
ParamEtEr ConDition min tyP max unitsResolution1) 12 bit 0.04 % RH
8 bit 0.7 % RHAccuracy Tolerance2) typ ±2.0 % RHRepeatability 12 bit ±0.1 % RHHysteresis ±1 % RHResponse Time3) 10 secOperating Range extended4) 0 100 % RHLong Term Drift5) 0.5 % RH/yr
table 1: Relative Humidity Sensor
1. Default resolution is 14 bit (temperature) / 12 bit (humidity). It can be reduced to 12/8 bit, 11/11 bit or 13/10 bit by command.
2. Accuracies are tested at Outgoing Quality Control at 25 °C and 5.0 V. Values exclude hysteresis and long term drift and are applicable to non-condensing environments only.
3. Time for achieving 63 % of a step function, valid at 25 °C and 1m/s airflow.
4. Standard operating range: 0-80 % RH, beyond this limit sensor may read a reversible offset with slow kinetics (+3 % RH after 60h at humidity >80 % RH).
5. Value may be higher in environments with vaporized solvents, out-gassing tapes, adhesives, packaging materials, etc. For more details please refer to Handling Instructions.
Figure 3: Typical and maximal tolerance at 25 °C for relative humidity.
3.2. temPerature sensor
ParamEtEr ConDition min tyP max unitsResolution1) 14 bit 0.01 °C
12 bit 0.04 °CAccuracy Tolerance 14 bit ±0.3 °CRepeatability 12 bit ±0.1 °CResponse Time2) 30(TBD) secOperating Range extended3) -40 125 °CLong Term Drift 0.05 °C/yr
table 2: Temperature Sensor
1. Default resolution is 14 bit (temperature) / 12 bit (humidity). It can be reduced to 12/8 bit, 11/11 bit or 13/10 bit by command.
2. Response time depends on heat conductivity of sensor substrate.
3. Standard operating range: -30 ~ +85 °C, exposure to beyond this normal operating range for extended periods may affect the device reliability.

3EEH110 v1.0 / Modification rights reserved
Figure 4: Typical and maximal tolerance for temperature
3.3. oPerating range
The standard working range with regard to the humidity / temperature limits is shown by the dark gray area in Figure 5. The relative humidity signal may offset temporarily as a result of continuous exposure to conditions outside the dark gray region, especially at humidity > 80 % RH. If the sensor is brought back to the standard working range, the initial values will recover. Applications with high humidity at high temperatures will result in slower recovery. Reconditioning procedures (see 8.5) can accelerate this process. Although the sensors would not fail beyond standard working range limits, the specification is guaranteed within the standard working range only.
Figure 5: Working range
20
0
60
80
100
40
0 20 40 80 100 12060-20-40Temperature [°C]
Rel
ativ
e H
umid
ity [%
]
standard working range extended
working range
4. electrical characteristics
4.1. absolute maximum ratings
The absolute maximum ratings as given in Table 3 are stress ratings only and give additional information. Functional operation of the device at these conditions is not implied. Exposure to absolute maximum rating conditions for extended periods may affect the device reliability (e.g. hot carrier degradation, oxide breakdown).
symBoL ParamEtEr min max unitVCC Power Supply -0.3 6 VVLOGIC Digital I/O Pins (SDA, SCL, SEL[1:0] ) -0.3 VCC + 0.3 VVANALOG Analog Output Pins (HTOUT) -0.3 VCC + 0.3 VIIN Input Current on any Pin -100 100 mATSTG Storage Temperature -55 150 °CTOP Operation Temperature -40 125 °C
table 3: Absolute maximum ratings

v1.0 / Modification rights reserved 4 EEH110
4.2. electrical sPeciFication
The electrical characteristics such as power consumption, low and high level input and output voltages depend on the supply voltage. For proper communication with the sensor it is essential to make sure that signal design is strictly within the limits given in Table 4, Table 5 and Figure 6.
ParamEtEr ConDition min tyP max unitsSupply Voltage VCC 4.5 5.0 5.25 V
Current Dissipation
Sleep 65 uAMeasuring, SEL[1:0]=11 270 uAAverage 8 bit, SEL[1:0]=11 68 uAHTOUT enable, SEL[1:0]=00 300 uA
PWM Freq. SEL[1:0]=01 120 HzMeasure Freq. SEL[1:0]=00,01 2 HzDriving Load HTOUT, Capacitive Load - - 10 uF
HTOUT, Resistive Load 1K - - ΩCommunication Digital 2-wire interface, I2C, SEL[1:0]
table 4: DC characteristics of digital input/output pads. VCC = 5 V, T = 25 °C, unless otherwise noted.
ParamEtEr ConDition min tyP max unitsOutput Low Voltage, VOL 0 - 0.4 VOutput High Voltage, VOH VCC X 0.7 - VCC VInput Low Voltage, VIL 0 - VCC X 0.3 VInput High Voltage, VIH VCC X 0.7 - VCC VSCL Frequency, fSCL 0 - 0.4 MHzSCL High Time, tSCLH 0.6 - - μsSCL Low Time, tSCLL 1.3 - - μsSDA Set-Up Time, tSU 100 - - nsSDA Hold Time, tHD 0 - 900 nsSDA Valid Time, tVD 0 - 400 nsSCL/SDA Fall Time, tF 0 - 100 nsSCL/SDA Rise Time, tR 0 - 300 nsCapacitive Load on Bus Line 0 - 400 pF
table 5: Timing specifications of digital input/output pads for I2C fast mode. Entities are displayed in Figure 4. VCC = 5 V, T = 25 °C, unless otherwise noted.
Figure 6: Timing Diagram for Digital Input / Output Pads, abbreviations are explained in Table 5. SDA directions are seen from the sensor. Bold SDA line is controlled by the sensor, plain SDA line is controlled by the micro-controller. Note that SDA valid read time is triggered by falling edge of anterior toggle.
5EEH110 v1.0 / Modification rights reserved
5. interFace
5.1. Pin conFiguration
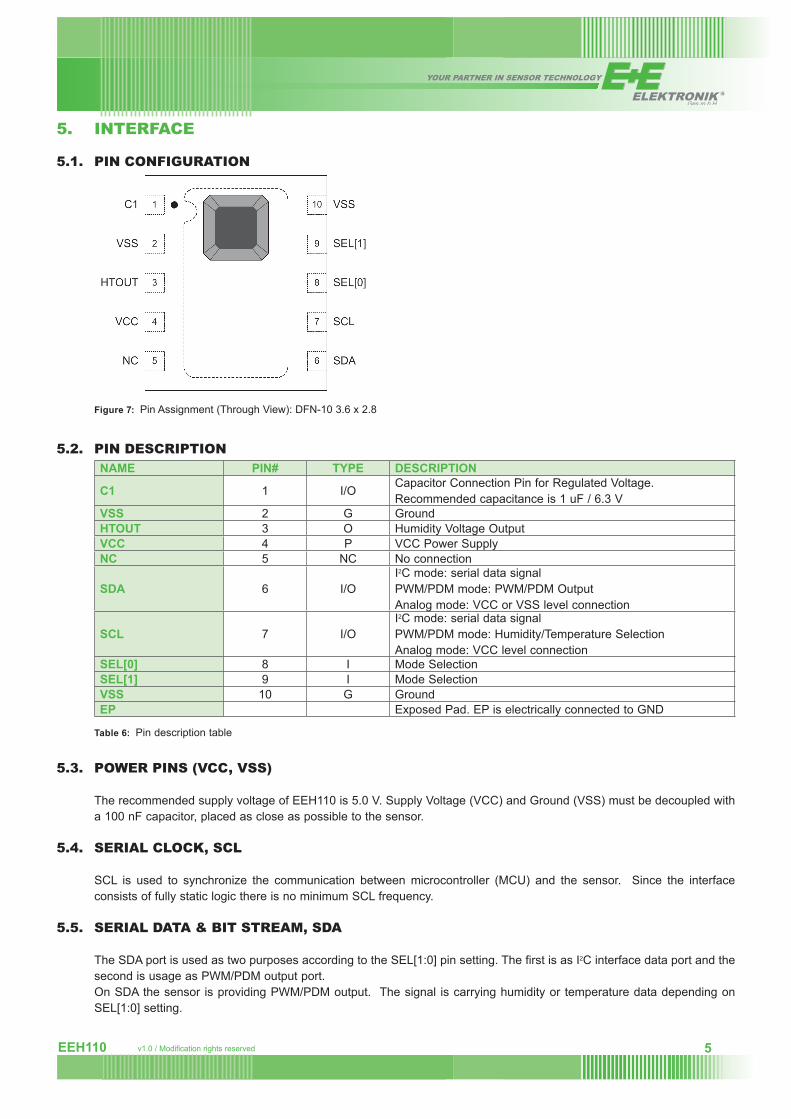
Figure 7: Pin Assignment (Through View): DFN-10 3.6 x 2.8
5.2. Pin DescriPtionnamE Pin# tyPE DEsCriPtion
C1 1 I/OCapacitor Connection Pin for Regulated Voltage.Recommended capacitance is 1 uF / 6.3 V
Vss 2 G GroundHtout 3 O Humidity Voltage OutputVCC 4 P VCC Power SupplynC 5 NC No connection
sDa 6 I/OI2C mode: serial data signalPWM/PDM mode: PWM/PDM OutputAnalog mode: VCC or VSS level connection
sCL 7 I/OI2C mode: serial data signalPWM/PDM mode: Humidity/Temperature SelectionAnalog mode: VCC level connection
sEL[0] 8 I Mode SelectionsEL[1] 9 I Mode SelectionVss 10 G GroundEP Exposed Pad. EP is electrically connected to GND
table 6: Pin description table
5.3. Power Pins (vcc, vss)
The recommended supply voltage of EEH110 is 5.0 V. Supply Voltage (VCC) and Ground (VSS) must be decoupled with a 100 nF capacitor, placed as close as possible to the sensor.
5.4. serial clock, scl
SCL is used to synchronize the communication between microcontroller (MCU) and the sensor. Since the interface consists of fully static logic there is no minimum SCL frequency.
5.5. serial Data & bit stream, sDa
The SDA port is used as two purposes according to the SEL[1:0] pin setting. The first is as I2C interface data port and the second is usage as PWM/PDM output port. On SDA the sensor is providing PWM/PDM output. The signal is carrying humidity or temperature data depending on SEL[1:0] setting.
v1.0 / Modification rights reserved 6 EEH110
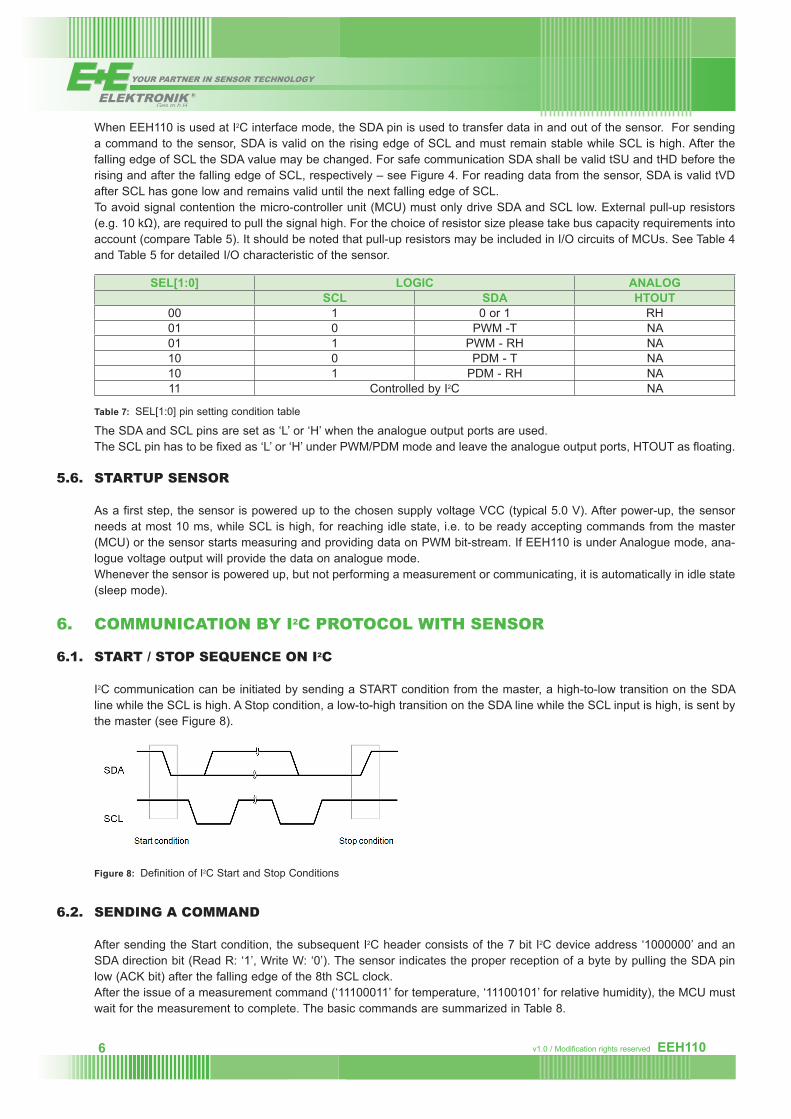
When EEH110 is used at I2C interface mode, the SDA pin is used to transfer data in and out of the sensor. For sending a command to the sensor, SDA is valid on the rising edge of SCL and must remain stable while SCL is high. After the falling edge of SCL the SDA value may be changed. For safe communication SDA shall be valid tSU and tHD before the rising and after the falling edge of SCL, respectively – see Figure 4. For reading data from the sensor, SDA is valid tVD after SCL has gone low and remains valid until the next falling edge of SCL. To avoid signal contention the micro-controller unit (MCU) must only drive SDA and SCL low. External pull-up resistors (e.g.10kΩ),arerequiredtopullthesignalhigh.Forthechoiceofresistorsizepleasetakebuscapacityrequirementsintoaccount (compare Table 5). It should be noted that pull-up resistors may be included in I/O circuits of MCUs. See Table 4 and Table 5 for detailed I/O characteristic of the sensor.
sEL[1:0] LoGiC anaLoGsCL sDa Htout
00 1 0 or 1 RH01 0 PWM -T NA01 1 PWM - RH NA10 0 PDM - T NA10 1 PDM - RH NA11 Controlled by I2C NA
table 7: SEL[1:0] pin setting condition table
The SDA and SCL pins are set as ‘L’ or ‘H’ when the analogue output ports are used.The SCL pin has to be fixed as ‘L’ or ‘H’ under PWM/PDM mode and leave the analogue output ports, HTOUT as floating.
5.6. startuP sensor
As a first step, the sensor is powered up to the chosen supply voltage VCC (typical 5.0 V). After power-up, the sensor needs at most 10 ms, while SCL is high, for reaching idle state, i.e. to be ready accepting commands from the master (MCU) or the sensor starts measuring and providing data on PWM bit-stream. If EEH110 is under Analogue mode, ana-logue voltage output will provide the data on analogue mode.Whenever the sensor is powered up, but not performing a measurement or communicating, it is automatically in idle state (sleep mode).
6. communication by i2c Protocol with sensor
6.1. start / stoP sequence on i2c
I2C communication can be initiated by sending a START condition from the master, a high-to-low transition on the SDA line while the SCL is high. A Stop condition, a low-to-high transition on the SDA line while the SCL input is high, is sent by the master (see Figure 8).
Figure 8: Definition of I2C Start and Stop Conditions
6.2. senDing a commanD
After sending the Start condition, the subsequent I2C header consists of the 7 bit I2C device address ‘1000000’ and an SDA direction bit (Read R: ‘1’, Write W: ‘0’). The sensor indicates the proper reception of a byte by pulling the SDA pin low (ACK bit) after the falling edge of the 8th SCL clock.After the issue of a measurement command (‘11100011’ for temperature, ‘11100101’ for relative humidity), the MCU must wait for the measurement to complete. The basic commands are summarized in Table 8.

7EEH110 v1.0 / Modification rights reserved
CommanD CommEnt CoDETrigger T measurement hold master 11100011Trigger RH measurement hold master 11100101Trigger T measurement no hold master 11110011Trigger RH measurement no hold master 11110101Write User Register 11100110Read User Register 11100111Soft Reset 11111110
table 8: Basic command set, RH stands for relative humidity, and T stands for temperature.
6.3. holD / no holD master moDe
There are two different operation modes to communicate with the sensor: Hold Master mode or No Hold Master mode. In the first case the SCL line is blocked (controlled by sensor) during measurement process while in the latter case the SCL line remains open for other communication while the sensor is processing the measurement.No hold master mode allows for processing other I2C communication tasks on a bus while the sensor is measuring. A communication sequence of the two modes is displayed in Figure 9 and Figure 10, respectively.In the hold master mode, the EEH110 pulls down the SCL line while measuring to force the master into a wait state. By releasing the SCL line the sensor indicates that internal processing is terminated and that transmission may be continued.
Figure 9: Hold master communication sequence – grey blocks are controlled by EEH110. Bit 45 may be changed to NACK followed by Stop condition (P) to omit checksum transmission.
In no hold master mode, the MCU has to poll for the termination of the internal processing of the sensor. This is done by sending a Start condition followed by the I2C header (10000001) as shown in Figure 10. If the internal processing is finished, the sensor acknowledges the poll of the MCU and data can be read by the MCU. If the measurement processing is not finished the sensor answers no ACK bit and the Start condition must be issued once more.For both modes, since the maximum resolution of a measurement is 14 bit, the two last least significant bits (LSBs, bits 43 and 44) are used for transmitting status information. Bit 1 of the two LSBs indicates the measurement type (‘0’:tem-perature, ‘1’:humidity). Bit 0 is currently not assigned.
In the examples given in Figure 9 and Figure 10 the sensor output is DRH = ‘0110’0011’0101’0000’. For the calculation of physical values Status Bits must be set to ‘0’ – see Chapter 5.The maximum duration for measurements depends on the type of measurement and resolution chosen – values are displayed in Table 9. Maximum values shall be chosen for the communication planning of the MCU.
v1.0 / Modification rights reserved 8 EEH110
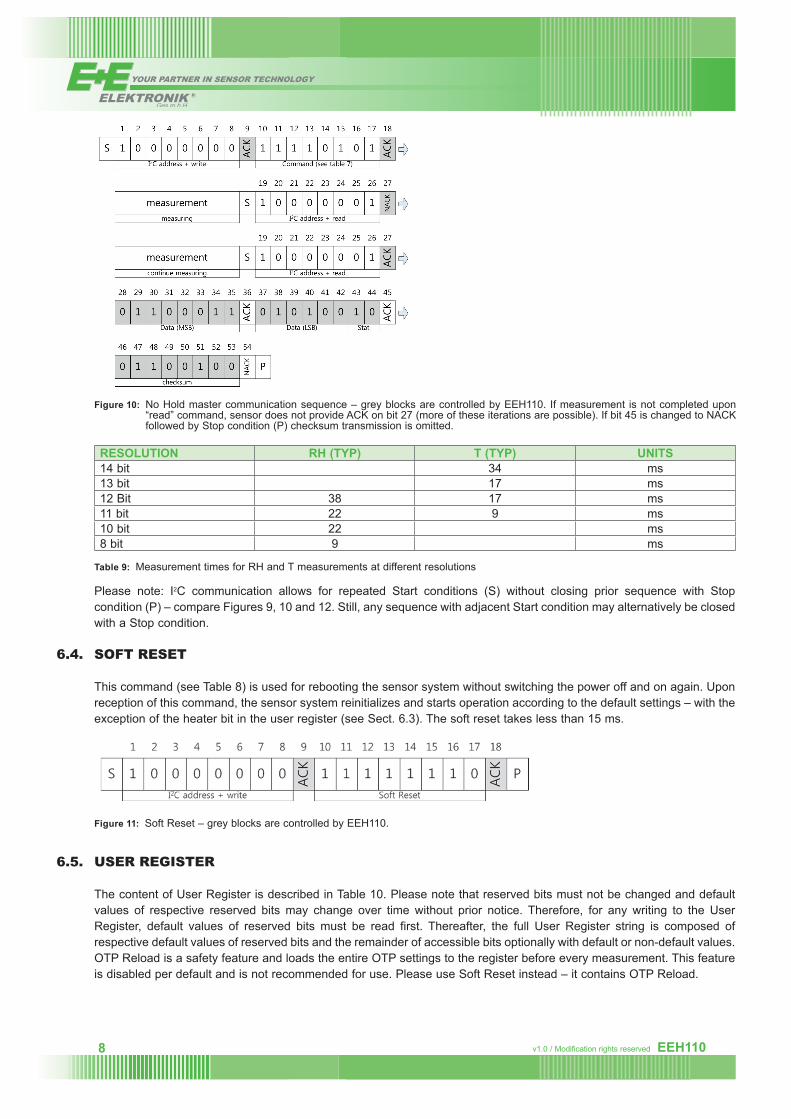
Figure 10: No Hold master communication sequence – grey blocks are controlled by EEH110. If measurement is not completed upon “read” command, sensor does not provide ACK on bit 27 (more of these iterations are possible). If bit 45 is changed to NACK followed by Stop condition (P) checksum transmission is omitted.
rEsoLution rH (tyP) t (tyP) units14 bit 34 ms13 bit 17 ms12 Bit 38 17 ms11 bit 22 9 ms10 bit 22 ms8 bit 9 ms
table 9: Measurement times for RH and T measurements at different resolutions
Please note: I2C communication allows for repeated Start conditions (S) without closing prior sequence with Stop condition (P) – compare Figures 9, 10 and 12. Still, any sequence with adjacent Start condition may alternatively be closed with a Stop condition.
6.4. soFt reset
This command (see Table 8) is used for rebooting the sensor system without switching the power off and on again. Upon reception of this command, the sensor system reinitializes and starts operation according to the default settings – with the exception of the heater bit in the user register (see Sect. 6.3). The soft reset takes less than 15 ms.
Figure 11: Soft Reset – grey blocks are controlled by EEH110.
6.5. user register
The content of User Register is described in Table 10. Please note that reserved bits must not be changed and default values of respective reserved bits may change over time without prior notice. Therefore, for any writing to the User Register, default values of reserved bits must be read first. Thereafter, the full User Register string is composed of respective default values of reserved bits and the remainder of accessible bits optionally with default or non-default values.OTP Reload is a safety feature and loads the entire OTP settings to the register before every measurement. This feature is disabled per default and is not recommended for use. Please use Soft Reset instead – it contains OTP Reload.

9EEH110 v1.0 / Modification rights reserved
Bit #Bits DEsCriPtion / CoDinG DEFauLt
7,0 2
Measurement resolution
00
RH Temp00 12 bit 14 bit01 8 bit 12 bit10 10 bit 13 bit11 11 bit 11 bit
6,5,4,3 4 Reserved 01112 1 Reserved 01 1 Disable OTP reload 1
table 10: User Register. Reserved bits must not be changed. “OTP reload” = ‘0’ loads default settings after each time a measurement command is issued.
An example for I2C communication reading and writing the User Register is given in Figure 12.
Figure 12: Read and write register sequence – grey blocks are controlled by EEH110. In this example, the resolution is set to 8 bit / 12 bit.
6.6. crc checksum
The EEH110 provides a CRC-8 checksum for error detection. The polynomial used is x8 + x5 + x4 +1.
6.7. conversion oF signal outPut
Default resolution is set to 12 bit relative humidity and 14 bit temperature reading.Measured data are transferred in two byte packages, i.e. in frames of 8 bit length where the most significant bit (MSB) is transferred first (left aligned).Each byte is followed by an acknowledge bit. The two status bits, the last bits of LSB, must be set to ‘0’ before calculating physical values. In the example of Figure 9 and Figure 10, the transferred 16 bit relative humidity data is ‘0110001101010000’ = 25424.
relative Humidity Conversion
With the relative humidity data output DRH the relative humidity RH is obtained by the following formula (result in % RH), no matter which resolution is chosen:
RH=-6+125∙DRH
216
In the example given in Figure 9 and Figure 10 the relative humidity results to be 42.5 % RH.
RH=-6+125∙ 2542465536 =42.492≈42.5

v1.0 / Modification rights reserved 10 EEH110
The physical value RH given above corresponds to the relative humidity above liquid water according to World Meteorological Organization (WMO). For relative humidity above ice RHi the values need to be transformed from relative humidity above water RHw at temperature t. The equation is given in the following formular:
RHi = RHW . exp βW . tλW + t( ) / exp
βi . tλi + t( )
Units are % RH for relative humidity and °C for temperature. The corresponding coefficients are defined as follows: βw=17.62,λw=243.12°C,βi=22.46,λi=272.62°C.
temperature Conversion
The temperature T is calculated by inserting temperature data output DT into the following formula (result in °C), no matter which resolution is chosen:
T=-46.85+175.72∙DT
216
7. stanD-alone relative humiDity outPut
7.1. analogue outPut
EEH110 support direct analogue output of relative humidity. By setting SEL[1:0] as ‘00’, analogue output is selected. SCL level setting ‘1’ for humidity output mode is possible. The sensor measures twice per second. Output resolution of RH is set to 10 bit.
Conversion of signal output
The sensor reading is linear and hence it can be converted to a physical value by an easy linear equation.
With the relative humidity signal output the relative humidity RH is obtained by the following formula (result in % RH):
VHOUT(mV)=26.23∙RH(%)+1032
RH(%) = 126.23 ∙(-1032+VHOUT (mV))
The physical value RH given above corresponds to the relative humidity above liquid water according to World Meteorological Organization (WMO).
7.2. Pwm outPut
PWM signal runs on a base frequency of 120 Hz, the data signal is provided on SDA line. By setting SEL[1:0] as ‘01’, the PWM output mode is selected. SCL level setting ‘1’ for humidity and ‘0’ for temperature output mode is possible. The sensor measures twice per second. Output resolution of RH and Temperature are set to 10 bit and 12 bit each.
PWm specification
Pulse Width Modulation runs on a constant frequency and the measured information is provided as duty cycle on that frequency – see Figure 13.
Figure 13: PWM signal. Base frequency runs constantly at approximately 120 Hz. hence tF is about 8.3 ms. The signal is provided on tPW as a ratio of tF.
11EEH110 v1.0 / Modification rights reserved
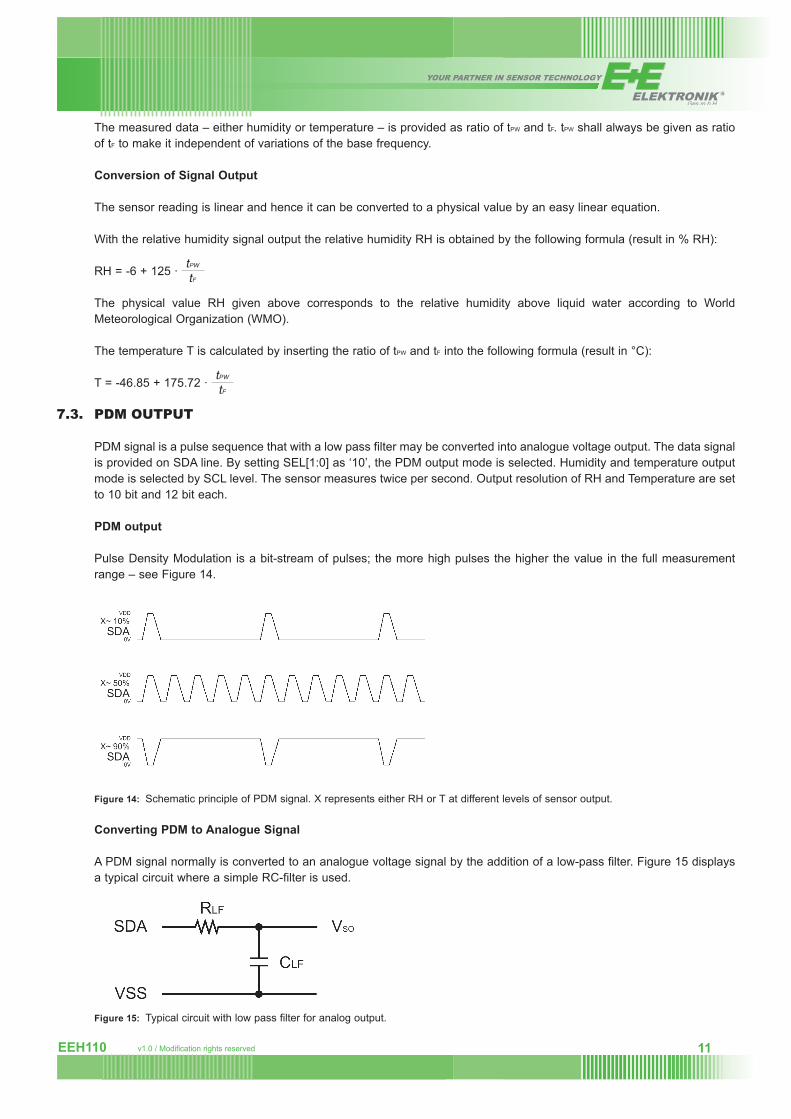
The measured data – either humidity or temperature – is provided as ratio of tPW and tF. tPW shall always be given as ratio of tF to make it independent of variations of the base frequency.
Conversion of signal output
The sensor reading is linear and hence it can be converted to a physical value by an easy linear equation.
With the relative humidity signal output the relative humidity RH is obtained by the following formula (result in % RH):
RH=-6+125∙ tPW
tF
The physical value RH given above corresponds to the relative humidity above liquid water according to World Meteorological Organization (WMO).
The temperature T is calculated by inserting the ratio of tPW and tF into the following formula (result in °C):
T=-46.85+175.72∙ tPW
tF
7.3. PDm outPut
PDM signal is a pulse sequence that with a low pass filter may be converted into analogue voltage output. The data signal is provided on SDA line. By setting SEL[1:0] as ‘10’, the PDM output mode is selected. Humidity and temperature output mode is selected by SCL level. The sensor measures twice per second. Output resolution of RH and Temperature are set to 10 bit and 12 bit each.
PDm output
Pulse Density Modulation is a bit-stream of pulses; the more high pulses the higher the value in the full measurement range – see Figure 14.
Figure 14: Schematic principle of PDM signal. X represents either RH or T at different levels of sensor output.
Converting PDm to analogue signal
A PDM signal normally is converted to an analogue voltage signal by the addition of a low-pass filter. Figure 15 displays a typical circuit where a simple RC-filter is used.
Figure 15: Typical circuit with low pass filter for analog output.
v1.0 / Modification rights reserved 12 EEH110
For an acceptable small ripple of the analogue voltage signal, a cut-off frequency of 3.4 Hz is recommended. Typical valuesforthelowpassfiltercomponentsareR=100kΩandC=470nFforhumiditymode.Thecorrespondingrippleofthe signal is limited to maximal amplitude of ±1 mV for humidity mode. If larger deviations are acceptable the capacitor size can be reduced.
After the low pass filter the sensor provides an output Voltage VSO which as a portion of VDD then is converted into a phys-ical value. The sensor reading is linearized and hence it can be converted to a physical value by an easy linear equation.
With the relative humidity signal output the relative humidity RH is obtained by the following formula (result in % RH):
RH=-6+125∙ VSO
VDD
The temperature T is calculated by inserting temperature signal output ST into the following formula (result in °C):
T=-46.85+175.72∙ VSO
VDD
8. aPPlications
8.1. storage instruction
Moisture Sensitivity Level (MSL) is 1, according to IPC/JEDEC J-STD-020. At the same time, it is recommended to further process the sensors within 1 year after date of delivery.It is of great importance to understand that a humidity sensor is not a normal electronic component and needs to be han-dled with care. Chemical vapors at high concentration in combination with long exposure times may offset the sensor reading.For this reason it is recommended to store the sensors in original packaging including the sealed ESD bag at following conditions: Temperature shall be in the range of 10 °C – 50 °C and humidity at 20 % RH – 60 % RH (sensors that are not stored in ESD bags).
8.2. solDering instructions
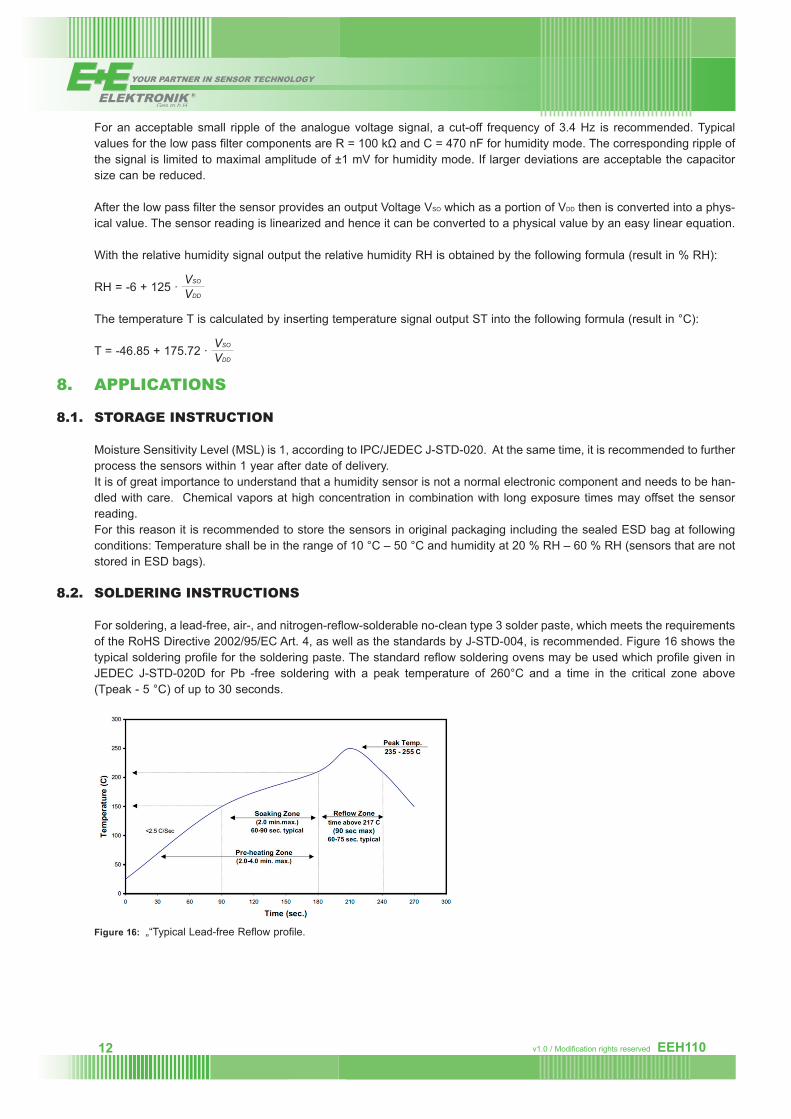
For soldering, a lead-free, air-, and nitrogen-reflow-solderable no-clean type 3 solder paste, which meets the requirements of the RoHS Directive 2002/95/EC Art. 4, as well as the standards by J-STD-004, is recommended. Figure 16 shows the typical soldering profile for the soldering paste. The standard reflow soldering ovens may be used which profile given in JEDEC J-STD-020D for Pb -free soldering with a peak temperature of 260°C and a time in the critical zone above (Tpeak - 5 °C) of up to 30 seconds.
Figure 16: „“Typical Lead-free Reflow profile.
13EEH110 v1.0 / Modification rights reserved
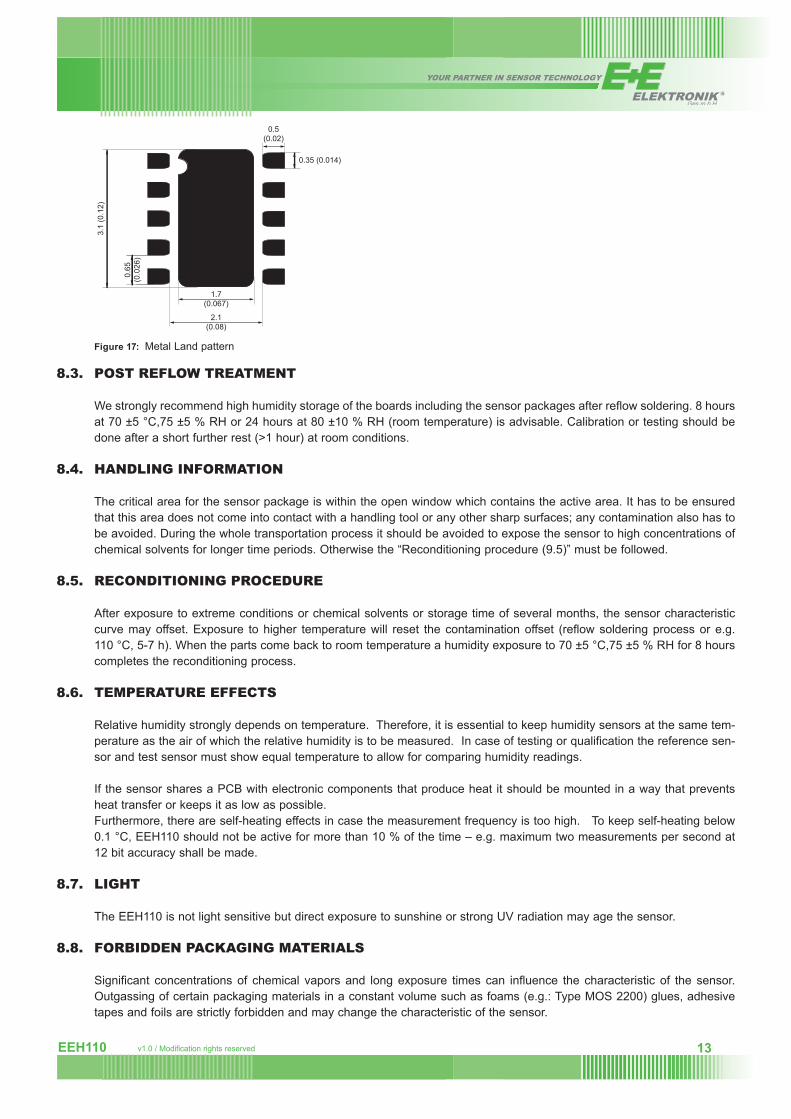
Figure 17: Metal Land pattern
3.1
(0.1
2)
1.7(0.067)
2.1(0.08)
0.65
(0
.026
)
0.35 (0.014)
0.5 (0.02)
8.3. Post reFlow treatment
We strongly recommend high humidity storage of the boards including the sensor packages after reflow soldering. 8 hours at 70 ±5 °C,75 ±5 % RH or 24 hours at 80 ±10 % RH (room temperature) is advisable. Calibration or testing should be done after a short further rest (>1 hour) at room conditions.
8.4. hanDling inFormation
The critical area for the sensor package is within the open window which contains the active area. It has to be ensured that this area does not come into contact with a handling tool or any other sharp surfaces; any contamination also has to be avoided. During the whole transportation process it should be avoided to expose the sensor to high concentrations of chemical solvents for longer time periods. Otherwise the “Reconditioning procedure (9.5)” must be followed.
8.5. reconDitioning ProceDure
After exposure to extreme conditions or chemical solvents or storage time of several months, the sensor characteristic curve may offset. Exposure to higher temperature will reset the contamination offset (reflow soldering process or e.g. 110 °C, 5-7 h). When the parts come back to room temperature a humidity exposure to 70 ±5 °C,75 ±5 % RH for 8 hours completes the reconditioning process.
8.6. temPerature eFFects
Relative humidity strongly depends on temperature. Therefore, it is essential to keep humidity sensors at the same tem-perature as the air of which the relative humidity is to be measured. In case of testing or qualification the reference sen-sor and test sensor must show equal temperature to allow for comparing humidity readings.
If the sensor shares a PCB with electronic components that produce heat it should be mounted in a way that prevents heat transfer or keeps it as low as possible.Furthermore, there are self-heating effects in case the measurement frequency is too high. To keep self-heating below 0.1 °C, EEH110 should not be active for more than 10 % of the time – e.g. maximum two measurements per second at 12 bit accuracy shall be made.
8.7. light
The EEH110 is not light sensitive but direct exposure to sunshine or strong UV radiation may age the sensor.
8.8. ForbiDDen Packaging materials
Significant concentrations of chemical vapors and long exposure times can influence the characteristic of the sensor. Outgassing of certain packaging materials in a constant volume such as foams (e.g.: Type MOS 2200) glues, adhesive tapes and foils are strictly forbidden and may change the characteristic of the sensor.

v1.0 / Modification rights reserved 14 EEH110
8.9. wiring anD signal integrity
When this EEH110 is used under I2C mode, carrying the SCL and SDA signal parallel and in close proximity (e.g. in wires) for more than 10 cm may result in cross talk and loss of communication. Furthermore, slowing down SCL frequency will possibly improve signal integrity. Under analogue output modes, the output pin has to be protected from external noise source to get stable output. Power supply pins (VCC,VSS) must be decoupled with a 100 nF capacitor.
9. Document revision history
DatE r-PaGE rEVisED ContEnts totaL PaGE rEV. no.11 April 2016 - Initial release 14 v1.0