1 evolutionary growth of genomes for the development and replication of multi-cellular organisms...
TRANSCRIPT

1
Evolutionary Growth of Genomesfor the Development and Replication
of Multi-Cellular Organisms with Indirect Encodings
Stefano Nichele and Gunnar Tufte
ICES 2014 - Orlando (USA)December 9-12, 2014
Stefano Nichele, 2014

2
Genomes of biological organisms are not fixed in size
They evolved and diverged into different species acquiring new genes and thus having different lengths
• LUA (Last Universal Ancestor) ~ 3.5 / 3.8 billion years ago• Gene duplication: redundant gene with less selection pressure• Larger genome: genetic novelty, potential for innovation• Complexification: incremental elaboration• ~ 38% Homo Sapiens genome due to gene duplication

3
Artificial EvoDevo systems often have static size genomes
System designer choice:• Trial & error• Estimation / heuristics
Fixed maximum complexity (vs. open-ended in nature)

4
Goal
• Evolutionary growth of genomes (with indirect encodings)– Initialize genomes with a single gene (low dimensionality)– Allow gene duplications (add new degrees of freedom)
• Evo-Devo System based on Cellular Automata– Abstract model of development– Morphogenesis – Replication
• Evolve compact and effective genomes– Compare genome size and success rate– Fully specified genome (complete CA transition tables) vs growing genome

5
EvoDevo Mappings
• Direct• Redundant (neutrality)• Indirect (generative/developmental)
– Full specification of representation– von Neumann replicator: 295
• Fixed length (subset)• Variable length• Complexification
– NEAT (Stanley & Miikkulainen): good for evolving modular structures with direct encodings
6
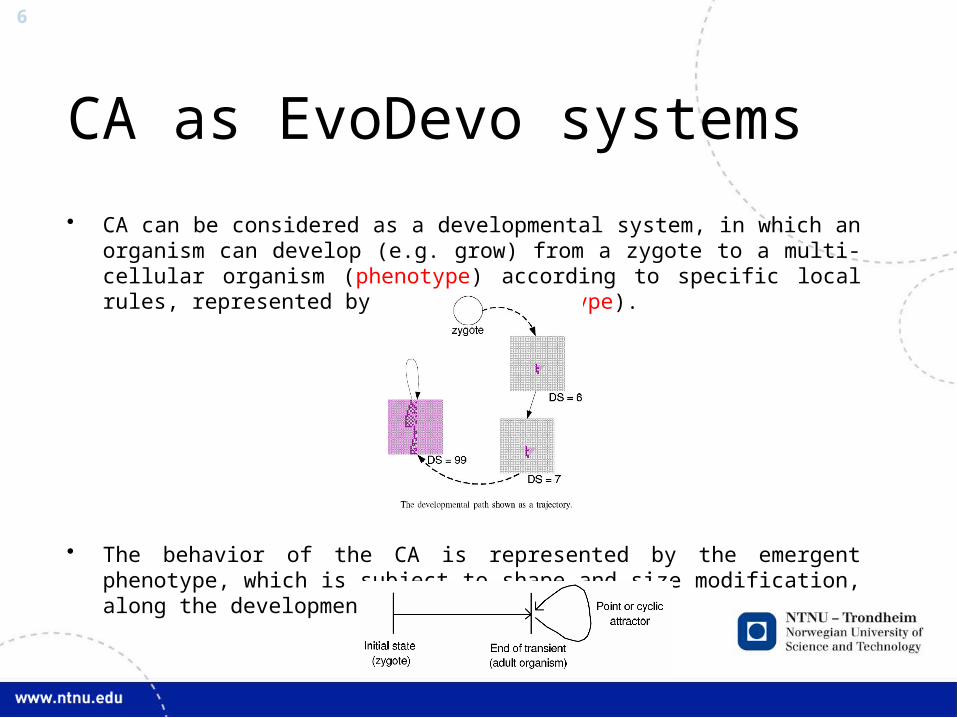
CA as EvoDevo systems
• CA can be considered as a developmental system, in which an organism can develop (e.g. grow) from a zygote to a multi-cellular organism (phenotype) according to specific local rules, represented by a genome (genotype).
• The behavior of the CA is represented by the emergent phenotype, which is subject to shape and size modification, along the developmental process.

7
Traditional CA dev. model
Example CA with 4 cell states and 5 neighbors:Search space = 4^4^5 = 41024 = ~ 3.23 x 10616

8
Previous work
• Evolutionary growth of genomes– CA transition tables– abstract measures of complexity: trajectory / attractor length
• Scalability– Search space, number of cell states, geomerty size (phenotypic resources)
Current:• Different target: phenotypic structures of different complexity• Different mapping: IBD (Instruction-Based Development)
– Not bounded (evolve from one instruction to program)

9
Evolutionary Growth
• A genetic algorithm (details in paper) with 4 regulation mechanisms to control gene duplication:– Upper bound, total number of genes– Duplication rate– Optimization time (before new duplication can occur)– Elitism
• Weighted fitness:– 80% actual fitness– 20% innovation parameter
• Rewards larger genomes• New genes most likely fitness-neutral or negative

10
CA – IBD (Bidlo and Skarvada 2008, Bidlo and Vasicek 2012)
U
L C R
D
Inst. Code
Op1 Op2
gene

11
Benchmark structures

12
Development problem
6 1 3 3 3 1 8 3 4 11 4 3 6 3 0 2 4 3 1 1 4 2 1 4 6 4 1 15 4 3 5 2 0 1 2 4 13 4 0 0 2 0
Operands: U = 0, R = 1, D = 2, L = 3, C = 4.Inst. Code
Op1 Op2
13
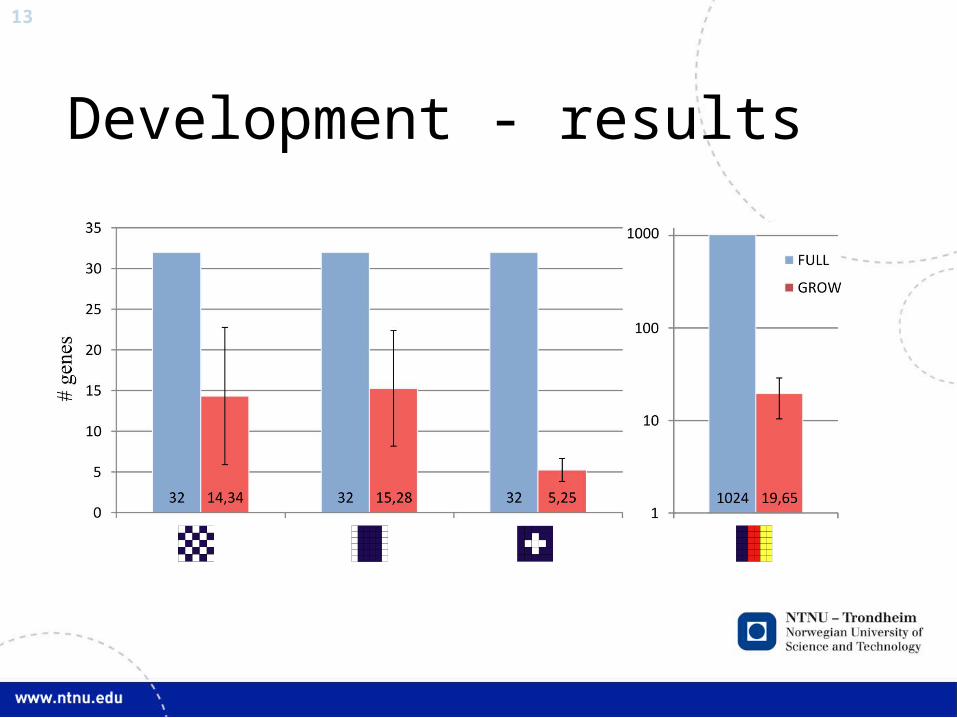
Development - results

14
Rep
licat
ion
prob
lem
time

15
Replication - results

16
Replication of ”French” Flag

17
Success rate
Table-based EvolutionSuccess Rate %
Genotype Size (# genes)Max Avg Min StDev
GenerationsAvg. StDev.
A 58 32 32 32 0 1336 2294
B 69 32 32 32 0 2254 2501
C 19 1024 1024 1024 0 5002 3157
D 23 32 32 32 0 2668 2942
Instruction-based Growing EvolutionSuccess Rate %
Genotype Size (# genes)Max Avg Min StDev
GenerationsAvg. StDev.
A 98 31 14.34 5 8.4318 1257 1152
B 98 31 15.28 5 7.0973 3956 1690
C 46 46 19.65 6 9.2236 6424 1922
D 100 13 5.25 4 1.4097 285 108
Table-based EvolutionSuccess Rate %
Genotype Size (# genes)Max Avg Min StDev
GenerationsAvg. StDev.
A 85 32 32 32 0 775 1393
C 8 1024 1024 1024 0 4331 3576
D 1 32 32 32 0 8259 0
E 0 1024 1024 1024 0 - -
Instruction-based Growing EvolutionSuccess Rate %
Genotype Size (# genes)Max Avg Min StDev
GenerationsAvg. StDev.
A 100 7 2.93 2 1.1742 39.7 19.6
C 100 6 2.84 2 1.1166 39.6 22.3
D 100 8 3.06 2 1.2128 41.8 20.5
E 100 5 1.38 1 0.8012 9.4 10.7
Development (avg. 100 runs) Replication (avg. 100 runs)

18
Conclusion
• Evolutionary growth of genome• Initialize with single gene, allow duplication and
speciation (regulation mechanisms)• Traditional CA mapping vs instruction based
development (unbounded)• Development and replication problems• Compact and effective genotype solutions (not
designed a priori)• Better success rate

19
Future work
• Investigate a major challenge in EvoDevo:– Development of complex morphologies and structures
(potentially at levels of complexity found in nature)
• True complexification– Allow growth of available cell states (unbounded state space)
• Optimization of instructions and instruction set• More benchmarks and tasks (example: circuit design)
• Introduce self-modifying instructions– Allow diversification of programs

20
Stefano Nichelewww.nichele.eu