1 endocrine activities and adipogenic effects of bisphenol
TRANSCRIPT

1
Endocrine Activities and Adipogenic Effects of Bisphenol AF and Its Main Metabolite 1
2
3
Darja Gramec Skledara, Adriana Carinob, Jurij Trontelja, Johanna Trobergc, Eleonora 4
Distruttib, Silvia Marchianòb, Tihomir Tomašiča, Anamarija Zegaa, Moshe Finelc, Stefano 5
Fioruccib, Lucija Peterlin Mašiča* 6
7
8
aFaculty of Pharmacy, University of Ljubljana, Aškerčeva 7, 1000 Ljubljana, Slovenia 9
bDipartimento di Medicina Clinica e Sperimentale, Nuova Facultà di Medicina e Chirurgia, 10
University of Perugia, S. Andrea delle Fratte, 06132 Perugia, Italy 11
cDivision of Pharmaceutical Chemistry, Faculty of Pharmacy, University of Helsinki, 12
Helsinki, Finland 13
14
15
16
*Corresponding author: Lucija Peterlin Mašič 17
Faculty of Pharmacy 18
University of Ljubljana 19
Aškerčeva 7 20
1000 Ljubljana, Slovenia 21
Tel: +386-1-4769635 22
E-mail: [email protected] 23
24

2
Abstract 25
Bisphenol AF (BPAF) is a fluorinated analog of bisphenol A (BPA), and it is a more potent 26
estrogen receptor (ER) agonist. BPAF is mainly metabolized to BPAF-glucuronide (BPAF-27
G), which has been reported to lack ER agonist activity and is believed to be biologically 28
inactive. The main goal of the current study was to examine the influence of the 29
metabolism of BPAF via glucuronidation on its ER activity and adipogenesis. Also, as 30
metabolites can have different biological activities, the effects of BPAF-G on other nuclear 31
receptors were evaluated. First, in-vitro BPAF glucuronidation was investigated using 32
recombinant human enzymes. Specific reporter-gene assays were used to determine 33
BPAF and BPAF-G effects on estrogen, androgen, glucocorticoid, and thyroid receptor 34
pathways, and on PXR, FXR, and PPARγ pathways. Their effects on lipid accumulation and 35
differentiation were determined in murine 3T3L1 preadipocytes using Nile Red, with 36
mRNA expression analysis of the adipogenic markers adiponectin, Fabp4, Cebp, and 37
PPAR. BPAF showed strong agonistic activity for hERα and moderate antagonistic 38
activities for androgen and thyroid receptors, and for PXR. BPAF-G was antagonistic for 39
PXR and PPARγ. BPAF (0.1 µM) and BPAF-G (1.0 µM) induced lipid accumulation and 40
increased expression of key adipogenic markers in murine preadipocytes. BPAF-G is 41
therefore not an inactive metabolite of BPAF. Further toxicological and epidemiological 42
investigations of BPAF effects on human health are warranted, to provide better 43
understanding of the metabolic end-elimination of BPAF. 44
45
Keywords: Bisphenol AF, bisphenol AF glucuronide, glucuronidation, endocrine 46
activities, lipid accumulation 47
48
49
3
Abbreviations 50
BPA, bisphenol A; BPAF, bisphenol AF; BPAF-G, bisphenol AF glucuronide; BPS, bisphenol 51
S; CDCA, chenodeoxycholic acid; DIM, differentiation mix (DMEM, 10% fetal calf serum, 52
517 μM 3-isobutyl-1-methylxanthine, 1 μM dexamethasone, 172 nM insulin); DMEM, 53
Dulbecco’s modified Eagle’s medium; E2, 17--estradiol; ER, estrogen receptor; FXR, 54
farnesoid receptor; HIM, human intestine microsomes; HLM, human liver microsomes; 55
NADPH, β-nicotinamide adenine dinucleotide phosphate; PBS, phosphate-buffered saline; 56
PPAR, peroxisome proliferator-activated receptor; PXR, pregnane X receptor; T3, 57
triiodothyronine; UDPGA, uridine 5’diphosphoglucuronic acid; UGT, 5'-diphospho-58
glucuronosyltransferase 59
60

4
1. Introduction 61
62
Bisphenol AF (BPAF; 1,1,1,3,3,3-hexafluoro-2,2-bis (4-hydroxyphenyl)propane) is a 63
fluorinated analog of the endocrine-disrupting bisphenol A (BPA; Fig. 1). BPAF is 64
extensively used in the production of fluoroelastomers and fluoropolymers, and it has 65
already been detected in various environmental matrices near manufacturing plants, 66
including rivers, soil, and sediment (Song et al., 2012). BPAF has also been detected in 67
sewage sludge (up to 72.2 ng/g dry weight) (Yu et al., 2015), indoor dust (Liao et al., 68
2012), and honey samples (up to 53.5 ng/mL) (Cesen et al., 2016). On the other hand, 69
BPAF was not detected in canned and noncanned beverages (Regueiro and Wenzl, 2015a), 70
nor in ready-made meals (Regueiro and Wenzl, 2015b). Currently, the estimated dietary 71
intake of BPAF is 0.49 ng/kg body weight/day for men and 0.50 ng/kg body weight/day 72
for women (Liao and Kannan, 2013). However, due to the extensive replacement of BPA 73
by its analogs, it is likely that the exposure to BPAF and to the other BPA substitutes will 74
rise in the coming years. 75
In previous in-vitro studies, BPAF showed higher estrogen receptor (ER) agonistic 76
activity than BPA (Table 1). This higher activity was defined using luciferase reporter 77
assays in several cell lines, including MCF7 (Kitamura et al., 2005), MVLN (Song et al., 78
2014), and CV-1 monkey kidney (Teng et al., 2013) cells. Similarly, ER agonistic activities 79
for BPAF were shown in yeast cells (Fic et al., 2014; Ruan et al., 2015; Lei et al., 2016), and 80
in in-vivo vitellogenin assays (Song et al., 2014). 81
Bisphenol AF is mainly metabolized to its corresponding glucuronide (BPAF-G; Fig. 82
1) and sulfate conjugates, both in vivo (Li et al., 2013; Feng et al., 2016) and in vitro 83
(Waidyanatha et al., 2015). Formation of BPAF-G from BPAF in vivo is rapid and efficient. 84
Indeed, for rats treated with 20 mg/kg BPAF, the BPAF-G peak was detected in plasma 30 85
5
min after oral administration (Li et al., 2013). Following oral administration in rats, BPAF-86
G is mainly excreted in bile and is further deconjugated in the intestine to the parent BPAF 87
(Waidyanatha et al., 2015). Li et al. (2013) also tested some uridine 5'-diphospho-88
glucuronosyltransferases (UGTs), and reported that the main UGT involved in BPAF 89
glucuronidation is UGT2B7, followed by UGT1A3, UGT2B15, UGT1A9, UGT2B17, UGT1A1, 90
UGT1A8, and UGT2A4 (Li et al., 2013). As expected, the bisphenol glucuronides evaluated 91
lacked ER agonistic activity; namely, BPA-glucuronide (BPA-G) (Matthews et al., 2001), 92
bisphenol S (BPS)-glucuronide (BPS-G) (Skledar et al., 2016), and BPAF-G (Li et al., 2013). 93
BPA-G has been considered to be an inactive BPA metabolite, although it cannot be 94
regarded as completely inactive as it can induce adipocyte differentiation (Boucher et al., 95
2015). BPA and BPS have metabolic effects and act as environmental obesogens, as they 96
can induce lipid accumulation and increase expression of adipogenic markers in murine 97
preadipocytes through peroxisome proliferator-activated receptor (PPAR)γ activation 98
(Ahmed and Atlas, 2016). However, no such studies have been performed for BPAF, or its 99
main metabolite. 100
In addition to its estrogenic activity, BPAF has in-vitro androgen receptor 101
antagonistic activity at low micromolar concentrations (Table 1), as demonstrated in 102
yeast (Fic et al., 2014), and in NIH3T3 (Kitamura et al., 2005), CV1 (Teng et al., 2013) and 103
MDA-kb2 (Kolšek et al., 2015) cells. BPAF is a relatively weak pregnane X receptor (PXR) 104
activator compared to BPA (Sui et al., 2012). The thyroid hormone activities of bisphenols 105
were evaluated by measuring growth-hormone production in GH3 cells, an assay in which 106
BPAF was inactive (Kitamura et al., 2005). In contrast, using yeast two-hybrid assays, 107
BPAF was shown to have thyroid hormone receptor agonistic activity that was greater 108
than that of BPA (Table 1) (Lei et al., 2016). Additionally, disruption of thyroid hormone 109
activity was shown in zebrafish larvae, which resulted in a robust decrease in thyroid 110

6
hormone levels and disruption of gene transcription in the hypothalamic–pituitary–111
thyroid axis (Tang et al., 2015). 112
Bisphenol AF also has the highest DNA-damaging potential among several 113
bisphenols in human peripheral blood mononuclear cells (Mokra et al., 2016). This was 114
shown using alkaline and neutral versions of the comet assay, where BPA and BPAF 115
induced single-strand breaks in DNA even at 10 ng/mL. BPAF had higher spermatogonial 116
toxicity in comparison to BPA and BPS, which included dose-dependent and time-117
dependent alterations in nuclear morphology, the cell cycle, and DNA damage responses, 118
and perturbation of the cytoskeleton (Liang et al., 2017). In an in-vivo study on aquatic 119
organisms, BPAF had greater toxicity toward Daphnia magna, Danio rerio, and 120
Desmodesmus subspicatus compared to BPA and BPF (Tisler et al., 2016). 121
We have previously used physiologically based pharmacokinetic models models to 122
compare internal exposure to BPA, BPS, BPF, and BPAF after peroral and dermal exposure in 123
different age groups (Karrer et al., 2018). BPAF glucuronidation in microsome preparations 124
from human liver (HLMs) and intestine (HIMs) followed substrate inhibition kinetics, 125
which reached maximum inhibition well below 100 μM. At higher substrate 126
concentrations, the BPAF glucuronidation rate was slower than that of BPA, BPS, and BPF. 127
However, under realistic exposure conditions, the BPAF glucuronidation rate would be 128
expected to be greater than that of other BPA analogs (Karrer et al., 2018). As 129
glucuronidation was reported as the main metabolic pathway for BPAF, in the present 130
study we performed a detailed in-vitro analysis of BPAF glucuronidation using 17 131
recombinant human UGTs, which included UGTs that are not commercially available, with 132
the addition of HLMs and HIMs. As BPAF-G was not commercially available, we performed 133
enzyme-assisted synthesis of BPAF-G using the human recombinant enzyme UGT2A1 (see 134
Data in Brief). To date, BPAF-G has been tested only in terms of its estrogenic activity; 135

7
however, in the present study, we compared the activities of BPA, BPAF, and BPAF-G on 136
ER, androgen receptor, glucocorticoid receptor, and thyroid receptor pathways, and on 137
PXR, PPARγ, and farnesoid receptor (FXR) pathways, using in-vitro reporter gene assays. 138
In addition, the effects of BPAF and BPAF-G on lipid accumulation and differentiation of 139
the murine 3T3L1 preadipocyte cell line were examined. The results of the present study 140
show that BPAF-G is not an inactive metabolite, as it has antagonistic activities toward 141
nuclear receptor pathways, induces lipid accumulation in murine preadipocytes, and 142
increases expression of several key adipogenic markers at the mRNA level. 143
144
2. Materials and methods 145
146
2.1. Materials 147
Bisphenol AF (97%; CAS 1478-61-1), BPA (99%; CAS 80-05-7), β-nicotinamide adenine 148
dinucleotide phosphate (NADPH, reduced tetra(cyclohexylammonium) salt; CAS 100929-149
71-3), L-glutathione (≥98%; CAS 70-18-8), uridine 5’diphosphoglucuronic acid (UDPGA; 150
ammonium salt; 98%-100%, CAS 43195-60-4), alamethicin (CAS 27061-78-5), sodium 151
phosphate monobasic, anhydrous (>98%; CAS 7558-80-7), magnesium chloride (≥98%; 152
CAS 7786-30-3), insulin (CAS I9278), isobutylmethylxanthine (CAS I5879), dimethyl 153
sulfoxide and dexamethasone were all from Sigma-Aldrich (St. Louis, MO, USA). BPAF-G 154
was biosynthesized in the Faculty of Pharmacy, University of Ljubljana (Slovenia), as 155
described in the Data in Brief. Pooled human liver microsomes (HLMs; 20 mg/mL), pooled 156
human intestinal microsomes (HIMs; 20 mg/mL) and recombinant human UGT2B15 157
‘supersomes’ were from BD Biosciences (Franklin Lakes, NJ, USA). Recombinant human 158
UGTs 1A1, 1A3-1A10, 2A1-2A3, 2B4, 2B7, 2B17, and 2B28 were produced in the Division 159
of Pharmaceutical Chemistry, University of Helsinki (Finland). Methanol and acetonitrile 160
8
were liquid chromatography–mass spectrometry grade, and were from Sigma-Aldrich (St. 161
Louis, MO, USA). 17--Estradiol (E2, ≥98%, CAS 50-28-2), dihydrotestosterone (≥98%, 162
CAS 521-18-6), hydrocortisone (≥98%, CAS 50-23-7), flutamide (≥99%, CAS 13311-84-163
7), mifepristone (≥98%, CAS 84371-65-3), 3,3´,5-triiodo-L-thyronine (T3, ≥95%, CAS 164
6893-02-3), ethanolamine (≥99%, CAS 141-43-5), sodium selenite (≥98%, CAS 10102-18-165
8), human apotransferin (≥98%, CAS 11096-37-0), bovine serum albumin (≥98%, CAS 166
9048-46-8), 17--estradiol (≥98%, CAS 57-91-0), corticosterone (≥98.5%, CAS 50-22-6), 167
tamoxifen (≥99%, CAS 10540-29-1) and kanamycin solution from Streptomyces 168
kanamyceticus (10 mg/mL, CAS 25389-94-0) were from Sigma-Aldrich, Germany. HepG2 169
cells were from American Type Culture Collection (ATCC HB-8065; LGC Standards S.r.l., 170
Italy). 3T3-L1 cells were from the Health Protective Agency culture collection, and were 171
supplied by Sigma Aldrich (St. Louis, MO, USA). FuGENE (R) HD Transfection Reagent 172
(E2311) and the Dual-Luciferase(R) Reporter assay system (E1980) were from Promega 173
Italia S.r.l. (Milan, Italy). TRIzol reagent (REF 15596026), DNaseI (REF 18068-015), and 174
SuperScriptII (REF 18064-014) were from Invitrogen. SYBR Select Master Mix (REF 175
4472908) was from Applied Biosystems. Alexafluor488-conjugated phalloidin and Nile 176
Red solution were from ThermoFisher Scientific. 177
178
2.2. Glucuronidation assay 179
Bisphenol AF glucuronidation activity was tested with both recombinant human UGTs 180
and pooled HLMs and HIMs. Stock solutions of BPAF were prepared in methanol. The 181
reaction mixture (final volume, 100 µL) contained 50 mM phosphate buffer, pH 7.4, 10 182
mM MgCl2, 20 µM or 50 µM BPAF, and the enzyme source (final concentration, 0.2 mg 183
protein/mL). To avoid solubility problems, 2% dimethylsulfoxide was also added to the 184
reaction mixture. In assays with microsomes, the reaction mixture also contained 185

9
alamethicin (final concentration, 5% of total microsomal protein concentration). These 186
reaction mixtures were incubated on ice for 30 min, and then at 37 °C for 5 min. The 187
reactions were started by addition of UDPGA (final concentration, 5 mM), and following a 188
60-min incubation at 37 °C, 10 µL 70% perchloric acid was added, to terminate the 189
reaction. The samples were then transferred to ice for 15 min, centrifuged at 16000× g for 190
10 min, and the supernatants were subjected to HPLC analysis. The assays were 191
performed in triplicate. Control samples (i.e., without UDPGA, without substrate) were 192
included in each set of assays. 193
The HPLC-UV analyses were performed using an Agilent 1100 series HPLC system 194
(Agilent Technologies, Palo Alto, CA, USA) equipped with a Poroshell 120 EC-C18 column 195
(4.6 × 100 mm, 2.7 µm; Agilent Technologies) that was maintained at 40 °C, with a flow 196
rate of 1 mL/min. The BPAF and BPAF-G separation was achieved using the mobile phases 197
of 0.1% formic acid (A) and acetonitrile (B), as follows: 03 min, 35% B; 36 min, 198
35%65% B; 68 min, 65% B; 88.1 min, 65%35% B; 8.110 min, 35% B. Detection 199
was performed at 231 nm. The chromatograms were analyzed using the Agilent 200
ChemStation software (rev. B.01.01), in Windows XP Professional. 201
202
2.3. Reporter gene assays 203
The detailed descriptions of the reporter gene assays for determination of activities on 204
several nuclear receptors are given in Supplementary Material S2. 205
206
2.4. 3T3-L1 cell differentiation, RNA isolation and qRT-PCR 207
The 3T3-L1 cells were cultured in Dulbecco’s modified Eagle’s medium (DMEM; 208
Euroclone), supplemented with 10% fetal bovine serum (Euroclone), 1% L-glutamine 209
(Euroclone), 100 U/mL penicillin (Sigma), and 100 µg/mL streptomycin (Sigma), at 37 °C. 210

10
Preadipocytes of 3T3-L1 cells were plated at 1.7 ×10⁶ cells in T75 flasks, and grown to 211
confluence. Two days after reaching confluence (day 0), the cells were stimulated with 212
differentiation mix (DIM), either alone (DMEM, 10% fetal calf serum, 517 μM 3-isobutyl-213
1-methylxanthine, 1 μM dexamethasone, 172 nM insulin), or in combination with 214
increasing concentrations of the bisphenols (final concentrations, 0.1, 1.0, 10 µM). On day 215
2, the DIM was replaced by insulin medium (DMEM, 10% fetal bovine serum, 172 nM 216
insulin) alone or with the bisphenols. The medium was subsequently replaced every 2 217
days until day 8. 218
To evaluate the activation of the lipidogenic and differentiation marker genes, total 219
RNA was isolated using the TRIzol reagent (Invitrogen), according to the manufacturer 220
specifications. One microgram RNA of genomic DNA was purified by DNaseI treatment 221
(Invitrogen), and random reverse-transcribed with Superscript II (Invitrogen; reaction 222
volume, 20 μL). Twenty-five nanogram template was added to a PCR mixture (final 223
volume, 20 μL) containing 0.2 μM each primer and 10 μL 2× SYBR Select Universal ready 224
mix (Invitrogen). All of the reactions were performed in triplicate, and the thermal cycling 225
conditions were: 2 min at 95 °C, followed by 40 cycles of 95 °C for 10 s, 60 °C for 45 s 226
(StepOnePlus instrument; Applied Biosystems). The relative mRNA expression was 227
calculated and is expressed as 2-(DDCt). The following forward and reverse primer 228
sequences were used: mouse glyceraldehyde-3-phosphate dehydrogenase (GAPDH): 229
ctgagtatgtcgtggagtctac and gttggtggtgcaggatgcattg; mouse adiponectin: 230
gacaggagatcttggaatgaca and gaatgggtacattgggaacagt; mouse Fabp4: 231
aaacaccgagatttccttcaaa and tcacgcctttcataacacattc; mouse CEBPα: gacatcagcgcctacatcga 232
and tcggctgtgctggaagag; mouse PPARγ: gccagtttcgatccgtagaa and aatccttggccctctgagat. 233
234
2.5. Nile Red staining 235

11
Differentiated 3T3L1 cells were cultured on 22 × 22 mm glass coverslips, treated, and 236
then washed three times with phosphate-buffered saline (PBS), and fixed for 15 min with 237
4% paraformaldehyde. The cells were then rinsed three times with PBS, and stained with 238
Alexafluor488-conjugated phalloidin (1:100 dilution; ThermoFisher Scientific) and Nile 239
Red solution (1:500, diluted from 5 mg/mL; ThermoFisher Scientific) in PBS. The cells 240
were then washed three times with PBS, and mounted on cover slips using SlowFade Gold 241
mounting medium with DAPI. In-silico fluorescence quantification was carried out 242
(AxioVision software; Zeiss Microscopy) through the co-localization scatter plots 243
dedicated tool. The fluorescence-intensity threshold for the red fluorescent signal (i.e., 244
Nile Red emission) was set to 1000, which is enough to well separate digital noise, cell 245
autofluorescence background, and low-intensity signals (i.e., membranes) from the high-246
intensity signals that are typical of lipid droplets and lipid accumulations. Pixels above the 247
given threshold were then normalized to the control group of cells (set as 100), and 248
plotted using Graph-Pad Prism 7. 249
250
2.6. Data analysis 251
The GraphPad Prism 5.04 software for Windows (GraphPad Software Inc., San Diego, CA, 252
USA) and Microsoft Excel were used to analyze the data obtained in the in-vitro assays for 253
the different nuclear receptors. The data collected from three independent experiments 254
were fitted using the GraphPad Prism software, and the representative values were 255
calculated (i.e., EC50, IC50). 256
The bisphenols were considered as agonistic for the relevant receptor pathway if 257
their maximal response level was at least 10% of the maximum response induced by the 258
positive controls, as 1 nM E2 for estrogenic activity, 0.25 nM T3 for thyroid activity, 0.5 259
nM dihydrotestosterone for androgenic activity, 500 nM hydrocortisone for 260

12
glucocorticoid activity, 10 μM rifaximin for PXR activity, 10 µM chenodeoxycholic acid 261
(CDCA) for FXR activity, and 100 nM rosiglitazon for PPARγ activity. Alternatively, the 262
bisphenols were considered as antagonistic for these receptor pathways if they showed 263
at least 30% inhibition of the relevant agonist activity. The endocrine-disrupting activities 264
toward these receptors were analyzed using two-sample student’s t-tests, where *p <0.05, 265
**p <0.01 and ***p <0.001 were considered statistically significant. 266
Computation of EC50 values and the statistics was performed using the Graph Pad 267
Prism 5.04 software. Data are expressed as means ±standard error, while two-group 268
comparisons used t-test analysis of means with post-hoc Mann–Whitney tests. Differences 269
were considered statistically significant for p <0.05. 270
271
3. Results 272
273
3.1. BPAF glucuronidation by human liver and intestine microsomes, and by 274
recombinant human UGTs 275
The glucuronidation of BPAF was tested using 17 recombinant human UGTs of 276
subfamilies 1A, 2A, and 2B: UGTs 1A1, 1A3-1A10, 2A1-2A3, 2B4, 2B7, 2B15, 2B17, and 277
2B28. Two substrate concentrations were used: 20 µM and 50 µM BPAF (Fig. 2A, B). The 278
highest BPAF glucuronidation rates were seen for the extrahepatic UGTs, particularly 279
intestinal UGT1A10 and two UGTs that are located mainly in the airways and nasal 280
epithelium, UGT2A1 and UGT2A2 (which are not expressed in liver or intestine). A 281
number of the hepatic UGTs catalyzed BPAF glucuronidation: UGT2B7, UGT2B17, 282
UGT1A9, and UGT1A3, and also UGT1A1, to a lesser degree. 283
Bisphenol AF glucuronidation rates for HLMs and HIMs were also evaluated to 284
determine the predominant glucuronidation site of this BPA analog. The BPAF 285

13
glucuronidation rates were about 4-fold higher with HLMs than HIMs (Fig. 2C). The most 286
likely reason for the higher activity in HLMs is the 20-fold higher expression level of 287
UGT2B7 in HLMs compared to HIMs, along with the large and meaningful amounts of 288
UGT1A9 and UGT1A3 in HLMs, which are either not expressed or are barely expressed in 289
HIMs, at the protein level (Sato et al., 2014). 290
Bisphenol AF glucuronidation kinetics analyses were performed for the UGTs that 291
showed significant activities: UGTs 1A3, 1A10, 2A1, 2B7, and 2B17. Most of these BPAF 292
glucuronidation kinetics followed the substrate inhibition model (i.e., UGTs 1A3, 1A10, 293
2B7, 2B17), even if they showed different sensitivities for the substrate. The kinetics of 294
UGT 2A1 were better described by the Michaelis–Menten model (see Data in Brief), and 295
this extra-hepatic and extra-intestinal UGT showed the highest Vmax (3.30 nmol/min/mg 296
protein), followed closely by UGT 1A10 (3.03 nmol/min/mg protein). The Vmax for the 297
largely hepatic UGTs were about one tenth of these (see Data in Brief). On the other hand, 298
the mainly hepatic UGT 2B7 and UGT 2B17 showed high affinities, with Km of 0.9 µM and 299
1.12 µM, respectively. 300
301
3.2. BPA, BPAF, and BPAF-G effects on nuclear receptors 302
Estrogenic activity was determined using a hERα-mediated transactivation assay in 303
Hela9903 cells, according to the recently available new OECD guideline 455 (Fig. 3). First, 304
the system responsiveness was confirmed by tests with reference substances. Agonism 305
toward hERα was tested using E2 as a strong estrogen, 17--estradiol as a weak estrogen, 306
and corticosterone as a negative control. The data obtained were within the specified 307
ranges reported previously, with EC50 of 1.91 ×10⁻⁵ μM for E2, and 2.24 ×10⁻³ μM for 17-308
-estradiol, and with corticosterone showing no activity. BPA and BPAF showed 309
concentration-dependent agonistic activities toward hERα, while BPAF-G showed no 310

14
activity toward hERα, as expected. The estrogenic activity of BPAF was 7.5-fold that of 311
BPA, with EC50 of 0.15 μM and 1.12 μM, respectively (Fig. 3A, Table 2). In contrast to these 312
agonistic activities, none of these tested bisphenols showed antagonistic activities 313
towards the hERα pathways (Fig. 3B). The reference substance that was used in the 314
antagonistic assays was tamoxifen, which showed an IC50 of 0.58 μM (Table 2). 315
Thyroid endocrine activity was determined with a reporter gene assay in 316
GH3.TRE-Luc cells, where T3 was used as the positive control, with an EC50 of 0.12 nM. 317
None of these tested bisphenols showed agonistic thyroid activities (Fig. 3C). In contrast, 318
BPAF was over 10-fold more potent in its thyroid antagonistic activity than BPA, with IC50 319
of 7.6 µM and 88.2 µM, respectively (Fig. 3D). BPAF-G showed no activity toward the 320
thyroid receptors in these GH3.TRE-Luc cells (Fig. 3C, D). 321
Androgenic and glucocorticoid activities were determined with reporter gene 322
assays using MDA-kb2 cells, which stably express both androgen and glucocorticoid 323
receptors. None of the tested bisphenols showed any agonistic activities in this system 324
(Fig. 3E, G). The controls used in these assays were dihydrotestosterone (androgen 325
receptor agonist) and hydrocortisone (glucocorticoid receptor agonist), with EC50 of 1.2 326
×10-3 µM and 0.01 µM for their respective receptor systems. BPAF-G also showed no 327
antagonistic activities on these MDA-kb2 cells. BPAF and BPA showed antagonistic 328
androgenic activities in the range of the control flutamide activity, with IC50 of 2.9 µM for 329
BPAF, 5.5 µM for BPA, and 2.2 µM for flutamide (Fig. 3F). BPA and BPAF also showed 330
antagonistic glucocorticoid activities, although only at the higher concentrations tested, 331
and due to their cytotoxicities at >25 µM for BPAF and >50 µM for BPA, their dose-332
response curves and IC50 could not be determined here (Fig. 3H). 333
Bisphenol A, BPAF and BPAF-G were also evaluated for their hPXR agonistic (Fig. 334
4A) and antagonistic (Fig. 4B) activities, using a transactivation assay in HepG2 cells. BPA 335

15
showed the most potent PXR agonistic activity, with an EC50 of 650 nM (Table 2). In 336
contrast, BPAF and BPAF-G showed PXR antagonistic activities following stimulation with 337
10 µM rifaximin (PXR agonist). These activities occurred in the low micromolar range for 338
BPAF and BPAF-G (Table 2). 339
These bisphenols were also tested for their FXR agonistic (Fig. 4C) and antagonistic 340
(Fig. 4D) activities in a transactivation assay using FXR-transfected HepG2 cells. The FXR 341
agonistic activities were initially tested at 10 µM bisphenols, as for CDCA as the positive 342
control. Significant increases in luciferase expression were only seen with BPAF. The FXR 343
agonistic activity of BPAF was further confirmed by the dose-response curve, with an EC50 344
of 5.59 µM (Table 2). Moreover, BPAF was the only bisphenol that showed FXR 345
antagonistic activity, with an IC50 of 4.9 µM (Table 2). 346
The PPARγ agonistic and antagonistic activities were then tested for BPA, BPAF 347
and BPAF-G. Here, none of these showed PPARγ agonistic activities (Fig. 4E), while BPA 348
and BPAF-G showed dose-dependent antagonistic activities following 100 nM 349
rosiglitazone (PPARγ agonist), with IC50 of 3.1 µM and 1.7 µM, respectively (Fig. 4F). 350
351
3.3. BPA, BPAF, and BPAF-G effects on lipid accumulation in 3T3L1 preadypocytes 352
The effects of BPAF and BPAF-G on adipocyte differentiation were also compared with 353
those of BPA by quantification of lipid accumulation using Nile Red staining. Here, 3T3L1 354
cells were initially treated with 0.1 M to 10 M BPA for 8 days. This resulted in increased 355
Nile Red lipid staining in comparison with control cells that were treated with DIM alone, 356
which indicated a higher differentiation rate with BPA (Fig. 5). Indeed, the quantification 357
of Nile Red staining indicated significant lipid accumulation even at the lowest tested BPA 358
concentration (0.1 M), which inducing a >3-fold increase in fluorescence levels relative 359
to the control. BPAF also significantly increased lipid accumulation at all of the tested 360
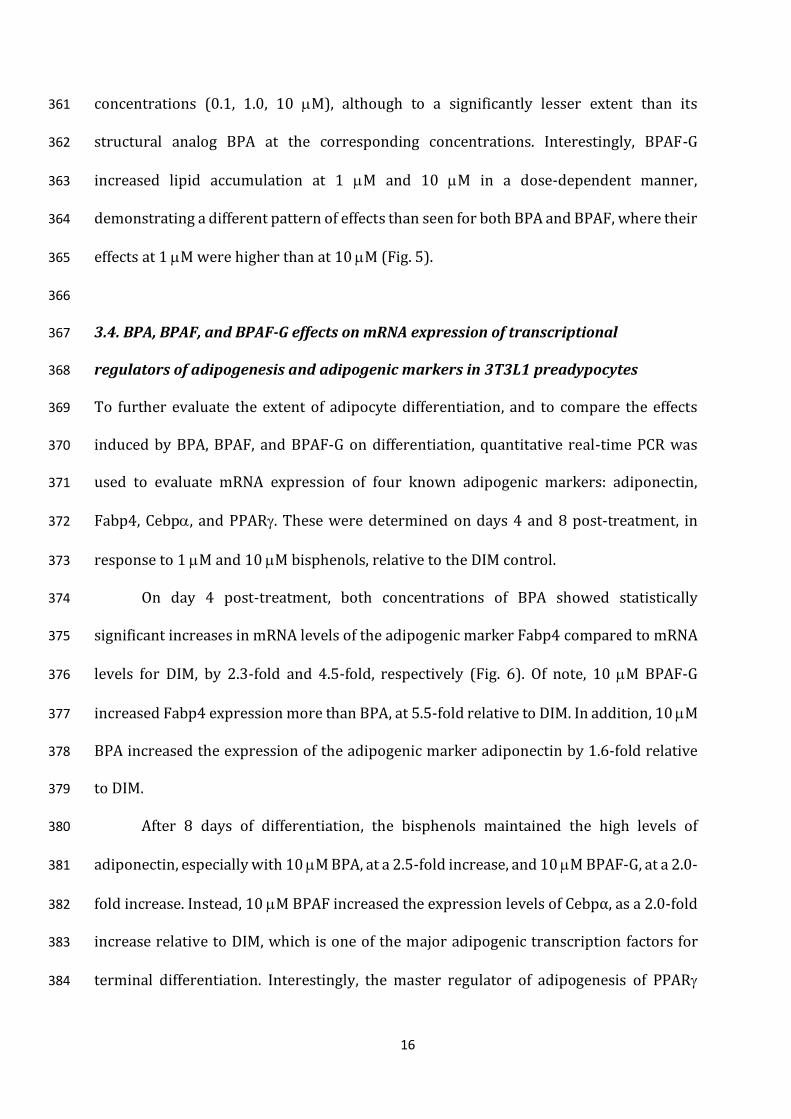
16
concentrations (0.1, 1.0, 10 M), although to a significantly lesser extent than its 361
structural analog BPA at the corresponding concentrations. Interestingly, BPAF-G 362
increased lipid accumulation at 1 M and 10 M in a dose-dependent manner, 363
demonstrating a different pattern of effects than seen for both BPA and BPAF, where their 364
effects at 1 M were higher than at 10 M (Fig. 5). 365
366
3.4. BPA, BPAF, and BPAF-G effects on mRNA expression of transcriptional 367
regulators of adipogenesis and adipogenic markers in 3T3L1 preadypocytes 368
To further evaluate the extent of adipocyte differentiation, and to compare the effects 369
induced by BPA, BPAF, and BPAF-G on differentiation, quantitative real-time PCR was 370
used to evaluate mRNA expression of four known adipogenic markers: adiponectin, 371
Fabp4, Cebp, and PPAR. These were determined on days 4 and 8 post-treatment, in 372
response to 1 M and 10 M bisphenols, relative to the DIM control. 373
On day 4 post-treatment, both concentrations of BPA showed statistically 374
significant increases in mRNA levels of the adipogenic marker Fabp4 compared to mRNA 375
levels for DIM, by 2.3-fold and 4.5-fold, respectively (Fig. 6). Of note, 10 M BPAF-G 376
increased Fabp4 expression more than BPA, at 5.5-fold relative to DIM. In addition, 10 M 377
BPA increased the expression of the adipogenic marker adiponectin by 1.6-fold relative 378
to DIM. 379
After 8 days of differentiation, the bisphenols maintained the high levels of 380
adiponectin, especially with 10 M BPA, at a 2.5-fold increase, and 10 M BPAF-G, at a 2.0-381
fold increase. Instead, 10 M BPAF increased the expression levels of Cebpα, as a 2.0-fold 382
increase relative to DIM, which is one of the major adipogenic transcription factors for 383
terminal differentiation. Interestingly, the master regulator of adipogenesis of PPAR 384

17
expression was not increased relative to DIM through the course of differentiation with 385
these cells treated with BPA, BPAF, and BPAF-G, at both 1 M and 10 M. The other master 386
regulator of adipogenesis examined here, Cebp, was increased after 8 days with 1 M 387
and 10 M both BPA and BPAF, relative to the control. For the mature adipocyte marker 388
Fabp4, the mRNA expression levels were significantly increased mostly after 4 days of 389
differentiation for these tested bisphenols, and after 8 days of differentiation at 10 M 390
BPA and BPAF-G. 391
392
4. Discussion 393
394
Recent studies have highlighted the elevated toxicity of BPAF in comparison with other 395
bisphenols, and have thus raise questions about its safety in terms of human health 396
(Mokra et al., 2016; Macczak et al., 2017). The present study thus investigated the 397
influence of glucuronidation of BPAF on some endocrine activities. While the estrogenic 398
agonistic activities of BPAF and BPAF-G are well known, much less is known about their 399
activities on other nuclear receptors, and so this was explored in detail here. 400
Understanding BPAF metabolism is important for the interpretation of its 401
potential toxicity in humans. It is known that metabolism can enhance endocrine activities 402
of a compound, as already reported for the BPA oxidative metabolite 4-methyl-2,4-bis(p-403
hydroxyphenyl)pent-1-ene, which showed about 500-fold higher estrogenic activity than 404
BPA (Gramec Skledar and Peterlin Masic, 2016). Conjugation reactions are the most 405
important metabolic transformations for BPAF, and these lead mainly to BPAF-G, and to 406
a lesser extent, to BPAF sulfate (Gramec Skledar and Peterlin Masic, 2016). The 407
incubations of BPAF with HLMs and HIMs here showed that its glucuronidation can start 408

18
in the intestine. However, we confirmed that the liver will be the main place for BPAF 409
glucuronidation, with glucuronidation rates for HLMs about 5-fold those of HIMs. 410
The next step in the present study was to determine which of a number of UGTs 411
might be responsible for BPAF glucuronidation. Similar screening of UGTs for BPAF 412
glucuronidation was performed by Li and coworkers (Li et al., 2013), and they reported 413
that UGT 2B7 showed the highest BPAF glucuronidation activity. However, here we have 414
extended their study by including five further UGTs that have never been tested for BPAF 415
glucuronidation before: UGTs 1A5, 2A1, 2A2, 2A3, and 2B28. The extrahepatic UGTs 2A1 416
and 2A2, which are mainly expressed in nasal epithelium and airways, and the intestinal 417
UGT 1A10, showed the highest BPAF glucuronidation rates here. High activities of UGT 418
2A1 toward different bisphenols was reported previously (Gramec Skledar et al., 2015); 419
however, for BPAF, this might not be so important, as ingestion with food or liquid would 420
appear to be the main intake of BPAF. UGT 1A10 is expressed mainly in intestine, and it 421
showed high BPAF glucuronidation rates, and therefore it might be responsible for 422
presystemic metabolism of BPAF. This observation is in contrast with the study of Li and 423
coworkers (Li et al., 2013), where UGT 1A10 showed no activity toward BPAF. However, 424
it has been confirmed several times that the commercially available UGT 1A10 has low 425
activity, and therefore that the glucuronidation rates of UGT 1A10 have often been 426
underestimated (Zhu et al., 2012). 427
The hepatic UGTs 2B7, 2B17, and 1A3 showed moderate BPAF glucuronidation 428
rates, while those of UGTs 2B15, 1A9, and 1A1 were low. While these screening data might 429
appear to be in contrast with the higher BPAF glucuronidation rates in HLMs than HIMs, 430
there is a logical explanation for this observation: although their BPAF glucuronidation 431
rates are lower than those of the intestinal UGT 1A10, their expression levels in liver are 432

19
very high. Furthermore, as we determined in the kinetics analysis, the hepatic UGT 2B7 433
and 2B17 showed very high affinities for BPAF, with Km in the low micromolar range. 434
In the second part of the present study, we focused on the endocrine activities of 435
BPAF and BPAF-G, compared to BPA. This is the first study where BPAF and BPAF-G have 436
been comprehensively studied for their effects on several nuclear receptors in vitro and 437
in silico, and again, compared to BPA. Both BPA and BPAF showed ER agonistic activity, as 438
has been reported previously in different in-vitro and in-vivo studies (Table 1), while 439
BPAF-G was without ER activity. Absence of estrogenic activity has already been 440
determined for various bisphenol glucuronides; namely, BPA-G (Matthews et al., 2001), 441
BPS-G (Skledar et al., 2016), and BPAF-G (Li et al., 2013). Our in-silico studies showed that 442
BPAF-G appears too bulky to fit the binding site of ER, thus providing support for the in-443
vitro data (see Article in Brief). With the new validated OECD test method 455, BPAF 444
showed 7.5-fold more potent ER agonistic activity compared to BPA, with EC50 of 0.15 µM 445
and 1.12 µM, respectively. The estrogenic potencies of BPAF in the low micromolar range 446
obtained with reporter gene assay on Hela9903 cell line are consistent with estrogenic 447
assays that have been reported in the literature (Table 1). The potential for ER agonistic 448
activities of BPA and BPAF was also shown with the molecular modeling, as they showed 449
similar binding to that of E2. 450
In addition to the estrogenic activities of bisphenols, which have been the most 451
studied, they can have significant activities toward several other nuclear receptor 452
systems, as also confirmed in the present study. Both, BPA and BPAF showed antagonistic 453
activities toward the androgen and thyroid receptor pathways, although BPAF-G showed 454
no activity here. The comparable androgenic antagonistic potencies of BPA and BPAF seen 455
here is in agreement with previous studies (Kitamura et al., 2005; Fic et al., 2014, Kolšek 456
et al., 2015). Different studies have described antagonist activities of BPA on thyroid 457

20
receptors (Moriyama et al., 2002; Zoeller et al., 2005; Sun et al., 2009); however, there 458
have only been two in-vitro studies that have described thyroid activity for BPAF, and 459
their outcomes are contradictory. BPAF showed no thyroid hormone activity when 460
induction of growth-hormone production was measured in GH3 cells (Kitamura et al., 461
2005), but showed thyroid hormone receptor agonistic activity using a yeast two-hybrid 462
assay (Lei et al., 2016). Contrary to these data, we show here potent thyroid antagonistic 463
activity of BPAF that was about 10-fold that of BPA. With molecular modeling, we showed 464
that BPA and BPAF, but not BPAF-G, can bind to the T3 binding site. However, in 465
comparison with T3, they do not offer enough steric and/or binding-interaction 466
complementarity with the binding site for receptor activation, which supports the 467
absence of agonist activity on the thyroid receptor in this in-vitro assay. All three of these 468
bisphenols, BPA, BPAF, and BPAF-G, were without significant glucocorticoid agonistic or 469
antagonistic activities. This is in agreement with Kolšek et al. (2015), who evaluated BPA 470
and BPAF glucocorticoid activities using the same cell line as in the present study (i.e., 471
MDA-kb2 cells). They reported lack activity on glucocorticoid receptors for both BPA and 472
BPAF at 10 µM (Kolšek et al., 2015). 473
Many endocrine-disrupting chemicals, including BPA, have been shown to activate 474
PXR, which is a nuclear receptor that functions as a master regulator of metabolism of 475
xenobiotics, as well as of endogenous molecules (Sui et al., 2012). PXR is a xenobiotic 476
sensor that regulates their clearance via induction of genes involved in drug and 477
xenobiotic metabolism, and it has been implicated in lipid homeostasis, atherosclerosis, 478
and carcinogenesis (Sui et al., 2014). In the present study, BPA showed potent PXR 479
agonistic activity (IC50, 0.65 µM). This is in agreement with Sui et al. (Sui et al., 2012), who 480
reported that BPA is a potent agonist for human PXR, but does not affect mouse PXR 481
activity. Moreover, the binding mode of BPA in the PXR ligand-binding site is similar to 482

21
that reported by Sui et al. (Sui et al., 2012). In the present study, both BPAF and BPAF-G 483
were without agonistic activity toward PXR. In contrast, Sui et al. (2012) reported agonist 484
PXR activity of BPAF at >5 µM. However, induction of luciferase activity in that study was 485
2 fold greater for BPA than BPAF at all three tested concentrations (i.e., 5 µM, 10 µM, 20 486
µM), defining BPAF as a weak PXR agonist in comparison with BPA (Sui et al., 2012). 487
However, in the present study, both BPAF and BPAF-G showed PXR antagonistic activities 488
in the low micromolar range, thus revealing opposite effects on the modulation of PXR 489
activity. Antagonistic PXR activity was also confirmed for BPS, using the HepG2/PXR cell 490
line (Zenata et al., 2017), while BPS was without agonist PXR activity according to two in-491
vitro studies (Peyre et al., 2014; Zenata et al., 2017). These studies demonstrate that 492
despite similarities in structure, the same effects on nuclear receptors as observed with 493
BPA cannot be assumed for its structural analogs. Indeed, while BPA is a PXR agonist, its 494
analogs BPS and BPAF act as PXR antagonists. 495
Sui et al. also reported that BPA was inactive on FXR (Sui et al., 2012), and in the 496
present study, significant agonistic and antagonistic activities toward FXR were only seen 497
for BPAF, with BPA and BPAF-G without FXR activity. Different binding modes of BPA in 498
the ligand-binding site of FXR in the agonist-bound and antagonist-bound conformations 499
were observed by the molecular docking here. In more detail, in the FXR agonist-bound 500
conformation, BPA can form a hydrogen bond with the Thr288 side chain, which can also 501
be observed for the agonist MFA-1 (Soisson et al., 2008). Instead, in the FXR antagonist-502
bound conformation, BPA can interact with the Ala452 and Met456 backbone amides. 503
It was reported previously that BPA is not a PPARγ agonist, while its halogenated 504
analogs (brominated, chlorinated BPA analogs), and also their sulfates, act as PPARγ 505
agonists (Riu et al., 2011a; Riu et al., 2011b). We confirmed here that none of these 506
bisphenols, BPA, BPAF, and BPAF-G, showed agonistic activities for PPARγ. However, BPA 507

22
and BPAF-G showed PPARγ antagonistic activities, with IC50 in the low micromolar range. 508
The antagonistic PPARγ activities of those bisphenols have not been tested before. 509
However, Wright et al (2000) reported that BPA diglycidyl ether can antagonize PPARγ 510
transcriptional activity induced by the PPARγ agonist rosiglitazone (Wright et al., 2000). 511
Taken together, BPAF showed strong agonistic activity toward hERα and moderate 512
(i.e., low micromolar range) antagonistic activities toward the androgen receptor, thyroid 513
receptor, and PXR. BPAF-G was completely inactive in the reporter assays for hERα, the 514
androgen, thyroid, and glucocorticoid receptors, and FXR, while it showed antagonistic 515
activities toward PXR and PPARγ (in the low micromolar range). This thus indicates that 516
this main metabolite of BPAF, BPAF-G, is not completely inactive, as was proposed in the 517
past. The most potent activities for all three of these tested bisphenols were the hERα 518
agonistic activity of BPAF (EC50, 150 nM) and the PXR agonistic activity of BPA (EC50, 650 519
nM). These justify further studies to evaluate the potential risks for human health. 520
The present study is the first to report that the BPA analog BPAF, and particularly 521
BPAF-G, can induce murine 3T3L1 cells to differentiate into adipocytes, as shown here by 522
the Nile Red lipid staining of these cells after 8 days of differentiation. These and other 523
data thus suggest that as for BPA, BPA-G (Boucher et al., 2015), and BPS (Ahmed and Atlas, 524
2016; Boucher et al., 2016), BPAF and its metabolite BPAF-G can increase adipogenesis in 525
murine preadipocytes. Additionally, we showed increased induction of the adipogenic 526
genes adiponectin, Fabp4, and Cebpα. In particular, after 4 days of differentiation, BPA 527
and BPAF-G (even more so), significantly increased expression of Fabp4, the levels of 528
which are commonly increased at the end of differentiation. Here, the bisphenols induced 529
high levels of this marker in the early stages of adipocyte differentiation, which were 530
much higher than in cells treated only with DIM. This indicates their effective impact on 531
adipogenesis. Conversely, after 8 days of differentiation, BPA and BPAF-G maintained high 532

23
levels of adiponectin, which are usually higher in the early stages of differentiation. 533
Furthermore, BPA and mostly BPAF increased the expression levels of Cebpα, one of the 534
major adipogenic transcription factors for terminal differentiation. We can conclude here 535
that BPA, BPAF, and BPAF-G increase and extend adipocyte differentiation by acting on 536
target genes that are essential for the different stages of adipogenesis. 537
Previously, it was shown that BPS can induce lipid accumulation and 538
differentiation in primary human preadipocytes, and that this effect might be mediated 539
via direct activation of the nuclear receptor PPARγ. Also, at the human aP2 promoter, 540
PPARγ activation by BPS is enhanced by activation of the glucocorticoid receptor (Ahmed 541
and Atlas, 2016; Boucher et al., 2016). Furthermore, these studies also showed that BPA, 542
BPA-G, and BPS do not directly activate the glucocorticoid receptor to induce 543
adipogenesis. We show here in the luciferase reporter assays that BPAF and BPAF-G do 544
not activate the glucocorticoid receptor and PPARγ, which is the master regulator of 545
adipocyte differentiation. Additional studies will be needed to determine the mechanism 546
of BPAF-induced and BPAF-G–induced adipogenesis. 547
548
5. Conclusions 549
550
This is the first study where BPAF and BPAF-G have been tested on several nuclear 551
receptors using reporter cell lines, with comparisons of these activities with their analog 552
BPA. We can conclude that BPAF is more potent compared to BPA in several luciferase 553
reporter assays, and so BPAF does not represent a harmless substitute for BPA. 554
Metabolism of BPAF to BPAF-G eliminates agonistic estrogen and antagonistic androgen 555
and thyroid activities of BPAF. Nevertheless, BPAF-G shows PXR and PPARγ antagonistic 556
activities in the low micromolar range. We have shown for the first time that 557

24
glucuronidation of BPAF results in formation of biologically active metabolites. 558
Additionally, BPAF-G has significant effects on lipid accumulation and differentiation in 559
murine preadipocytes at 1.0 µM and higher. Thus, in the future, more thorough 560
toxicological and epidemiological investigations of the BPAF effects on human health are 561
warranted, to provide a better understanding of the metabolic end-elimination fate of 562
BPAF in the human body. 563
564
565
Acknowledgements 566
The authors thank OpenEye Scientific Software, Santa Fe, NM, USA, for free academic 567
licenses for the use of their software, and Johanna Mosorin for skillful assistance in 568
recombinant UGT preparations. Financial support of the Slovenian Research Agency 569
(Grant No. P1-0208) and the Sigrid Juselius Foundation, Finland (grant no. 4704583) are 570
acknowledged. 571
572
25
References 573
Ahmed, S., Atlas, E., 2016. Bisphenol S- and bisphenol A-induced adipogenesis of murine 574
preadipocytes occurs through direct peroxisome proliferator-activated receptor 575
activation. Int. J. Obes. 40, 1566-1573. 576
Boucher, J.G., Ahmed, S., Atlas, E., 2016. Bisphenol S induces adipogenesis in primary 577
human preadipocytes from female donors. Endocrinology 157, 1397-1407. 578
Boucher, J.G., Boudreau, A., Ahmed, S., Atlas, E., 2015. In-vitro effects of bisphenol A -D-579
glucuronide (BPA-G) on adipogenesis in human and murine preadipocytes. Environ. 580
Health Perspect. 123, 1287-1293. 581
Cesen, M., Lambropoulou, D., Laimou-Geraniou, M., Kosjek, T., Blaznik, U., Heath, D., Heath, 582
E., 2016. Determination of bisphenols and related compounds in honey and their 583
migration from selected food contact materials. J. Agric. Food Chem. 64, 8866-8875. 584
Feng, Y., Jiao, Z., Shi, J., Li, M., Guo, Q., Shao, B., 2016. Effects of bisphenol analogues on 585
steroidogenic gene expression and hormone synthesis in H295R cells. Chemosphere 586
147, 9-19. 587
Fic, A., Zegura, B., Gramec, D., Mašič, L.P., 2014. Estrogenic and androgenic activities of 588
TBBA and TBMEPH, metabolites of novel brominated flame retardants, and selected 589
bisphenols, using the XenoScreen XL YES/YAS assay. Chemosphere 112, 362-369. 590
Gramec Skledar, D., Peterlin Masic, L., 2016. Bisphenol A and its analogs: do their 591
metabolites have endocrine activity? Environ. Toxicol. Pharmacol. 47, 182-199. 592
Gramec Skledar, D., Troberg, J., Lavdas, J., Peterlin Mašič, L., Finel, M., 2015. Differences in 593
the glucuronidation of bisphenols F and S between two homologous human UGT 594
enzymes, 1A9 and 1A10. Xenobiotica 45, 511-519. 595
Karrer, C., Roiss, T., von Goetz, N., Gramec Skledar, D., Peterlin Mašič, L., Hungerbühler, K., 596
2018. Physiologically based pharmacokinetic (PBPK) modeling of the bisphenols 597

26
BPA, BPS, BPF, and BPAF with new experimental metabolic parameters: Comparing 598
the pharmacokinetic behavior of BPA with its substitutes. Environ Health Perspect 599
126:077002. 600
Kitamura, S., Suzuki, T., Sanoh, S., Kohta, R., Jinno, N., Sugihara, K., Yoshihara, S., Fujimoto, 601
N., Watanabe, H., Ohta, S., 2005. Comparative study of the endocrine-disrupting 602
activity of bisphenol A and 19 related compounds. Toxicol. Sci. 84, 249-259. 603
Kolšek, K., Gobec, M., Mlinarič Raščan, I., Sollner Dolenc, M., 2015. Screening of bisphenol 604
A, triclosan and paraben analogues as modulators of the glucocorticoid and androgen 605
receptor activities. Toxicol. In Vitro 29, 8-15. 606
Lei, B., Xu, J., Peng, W., Wen, Y., Zeng, X., Yu, Z., Wang, Y., Chen, T., 2016. In-vitro profiling 607
of toxicity and endocrine disrupting effects of bisphenol analogues by employing 608
MCF-7 cells and two-hybrid yeast bioassay. Environ. Toxicol. 32, 278-289. 609
Li, M., Yang, Y.J., Yang, Y., Yin, J., Zhang, J., Feng, Y.X., Shao, B., 2013. Biotransformation of 610
bisphenol AF to its major glucuronide metabolite reduces estrogenic activity. PLoS 611
One 8, e83170. 612
Liang, S., Yin, L., Shengyang Yu, K., Hofmann, M.C., Yu, X., 2017. High-content analysis 613
provides mechanistic insights into the testicular toxicity of bisphenol A and selected 614
analogues in mouse spermatogonial cells. Toxicol. Sci. 155, 43-60. 615
Liao, C., Kannan, K., 2013. A survey of bisphenol A and other bisphenol analogues in 616
foodstuffs from nine cities in China. Food Addit. Contam. Part A Chem. Anal. Control 617
Expo. Risk Assess. 31, 319-329. 618
Liao, C., Liu, F., Guo, Y., Moon, H.B., Nakata, H., Wu, Q., Kannan, K., 2012. Occurrence of eight 619
bisphenol analogues in indoor dust from the United States and several Asian 620
countries: implications for human exposure. Environ. Sci. Technol. 46, 9138-9145. 621

27
Macczak, A., Cyrkler, M., Bukowska, B., Michalowicz, J., 2017. Bisphenol A, bisphenol S, 622
bisphenol F and bisphenol AF induce different oxidative stress and damage in human 623
red blood cells (in-vitro study). Toxicol. In Vitro 41, 143-149. 624
Matthews, J.B., Twomey, K., Zacharewski, T.R., 2001. In-vitro and in-vivo interactions of 625
bisphenol A and its metabolite, bisphenol A glucuronide, with estrogen receptors 626
alpha and beta. Chem. Res. Toxicol. 14, 149-157. 627
Mokra, K., Kuzminska-Surowaniec, A., Wozniak, K., Michalowicz, J., 2016. Evaluation of 628
DNA-damaging potential of bisphenol A and its selected analogs in human peripheral 629
blood mononuclear cells (in-vitro study). Food Chem. Toxicol. 100, 62-69. 630
Moriyama, K., Tagami, T., Akamizu, T., Usui, T., Saijo, M., Kanamoto, N., Hataya, Y., 631
Shimatsu, A., Kuzuya, H., Nakao, K., 2002. Thyroid hormone action is disrupted by 632
bisphenol A as an antagonist. J. Clin. Endocrinol. Metab. 87, 5185-5190. 633
Peyre, L., Rouimi, P., de Sousa, G., Héliès-Toussaint, C., Carré, B., Barcellini, S., Chagnon, 634
M.C., Rahmani, R., 2014. Comparative study of bisphenol A and its analogue bisphenol 635
S on human hepatic cells: a focus on their potential involvement in nonalcoholic fatty 636
liver disease. Food Chem. Toxicol. 70, 9-18. 637
Prasanth, G.K., Divya, L.M., Sadasivan, C., 2010. Bisphenol-A can bind to human 638
glucocorticoid receptor as an agonist: an in-silico study. J. Appl. Toxicol. 30, 769-774. 639
Regueiro, J., Wenzl, T., 2015a. Determination of bisphenols in beverages by mixed-mode 640
solid-phase extraction and liquid chromatography coupled to tandem mass 641
spectrometry. J. Chromatogr. A 1422, 230-238. 642
Regueiro, J., Wenzl, T., 2015b. Development and validation of a stable-isotope dilution 643
liquid chromatography-tandem mass spectrometry method for the determination of 644
bisphenols in ready-made meals. J. Chromatogr. A 1414, 110-121. 645

28
Riu, A., Grimaldi, M., le Maire, A., Bey, G., Phillips, K., Boulahtouf, A., Perdu, E., Zalko, D., 646
Bourguet, W., Balaguer, P., 2011a. Peroxisome proliferator-activated receptor γ is a 647
target for halogenated analogs of bisphenol A. Environ. Health Perspect. 119, 1227-648
1232. 649
Riu, A., le Maire, A., Grimaldi, M., Audebert, M., Hillenweck, A., Bourguet, W., Balaguer, P., 650
Zalko, D., 2011b. Characterization of novel ligands of ER, ER, and PPAR: the case 651
of halogenated bisphenol A and their conjugated metabolites. Toxicol. Sci. 122, 372-652
382. 653
Ruan, T., Liang, D., Song, S., Song, M., Wang, H., Jiang, G., 2015. Evaluation of the in-vitro 654
estrogenicity of emerging bisphenol analogs and their respective estrogenic 655
contributions in municipal sewage sludge in China. Chemosphere 124, 150-155. 656
Sato, Y., Nagata, M., Tetsuka, K., Tamura, K., Miyashita, A., Kawamura, A., Usui, T., 2014. 657
Optimized methods for targeted peptide-based quantification of human uridine 5'-658
diphosphate-glucuronosyltransferases in biological specimens using liquid 659
chromatography-tandem mass spectrometry. Drug Metab. Dispos. 42, 885-889. 660
Skledar, D.G., Schmidt, J., Fic, A., Klopcic, I., Trontelj, J., Dolenc, M.S., Finel, M., Masic, L.P., 661
2016. Influence of metabolism on endocrine activities of bisphenol S. Chemosphere 662
157, 152-159. 663
Soisson, S.M., Parthasarathy, G., Adams, A.D., Sahoo, S., Sitlani, A., Sparrow, C., Cui, J., 664
Becker, J.W., 2008. Identification of a potent synthetic FXR agonist with an unexpected 665
mode of binding and activation. Proc. Natl. Acad. Sci. USA 105, 5337-5342. 666
Song, M., Liang, D., Liang, Y., Chen, M., Wang, F., Wang, H., Jiang, G., 2014. Assessing 667
developmental toxicity and estrogenic activity of halogenated bisphenol A on 668
zebrafish (Danio rerio). Chemosphere 112, 275-281. 669

29
Song, S., Ruan, T., Wang, T., Liu, R., Jiang, G., 2012. Distribution and preliminary exposure 670
assessment of bisphenol AF (BPAF) in various environmental matrices around a 671
manufacturing plant in China. Environ. Sci. Technol. 46, 13136-13143. 672
Sui, Y., Ai, N., Park, S.-H., Rios-Pilier, J., Perkins, J.T., Welsh, W.J., Zhou, C., 2012. Bisphenol 673
A and its analogues activate human pregnane X receptor. Environ. Health Perspect. 674
120, 399-405. 675
Sui, Y., Park, S.-H., Helsley, R.N., Sunkara, M., Gonzalez, F.J., Morris, A.J., Zhou, C., 2014. 676
Bisphenol A increases atherosclerosis in pregnane X receptor-humanized ApoE 677
deficient mice. J. Am. Heart Assoc. 3: e000492. 678
Sun, H., Shen, O.X., Wang, X.R., Zhou, L., Zhen, S.Q., Chen, X.D., 2009. Anti-thyroid hormone 679
activity of bisphenol A, tetrabromobisphenol A and tetrachlorobisphenol A in an 680
improved reporter gene assay. Toxicol. In Vitro 23, 950-954. 681
Tang, T., Yang, Y., Chen, Y., Tang, W., Wang, F., Diao, X., 2015. Thyroid disruption in 682
zebrafish larvae by short-term exposure to bisphenol AF. Int. J. Environ. Res. Public 683
Health 12, 13069-13084. 684
Teng, C., Goodwin, B., Shockley, K., Xia, M., Huang, R., Norris, J., Merrick, B.A., Jetten, A.M., 685
Austin, C.P., Tice, R.R., 2013. Bisphenol A affects androgen receptor function via 686
multiple mechanisms. Chem.-Biol. Inter. 203, 556-564. 687
Tisler, T., Krel, A., Gerzelj, U., Erjavec, B., Dolenc, M.S., Pintar, A., 2016. Hazard 688
identification and risk characterization of bisphenols A, F and AF to aquatic 689
organisms. Environ. Poll. 212, 472-479. 690
Waidyanatha, S., Mathews, J.M., Patel, P.R., Black, S.R., Snyder, R.W., Fennell, T.R., 2015. 691
Disposition of bisphenol AF, a bisphenol A analogue, in hepatocytes in vitro and in 692
male and female Harlan Sprague-Dawley rats and B6C3F1/N mice following oral and 693
intravenous administration. Xenobiotica 45, 811-819. 694
30
Wright, H.M., Clish, C.B., Mikami, T., Hauser, S., Yanagi, K., Hiramatsu, R., Serhan, C.N., 695
Spiegelman, B.M., 2000. A synthetic antagonist for the peroxisome proliferator-696
activated receptor gamma inhibits adipocyte differentiation. J. Biol. Chem. 275, 1873-697
1877. 698
Yu, X., Xue, J., Yao, H., Wu, Q., Venkatesan, A.K., Halden, R.U., Kannan, K., 2015. Occurrence 699
and estrogenic potency of eight bisphenol analogs in sewage sludge from the US EPA 700
targeted national sewage sludge survey. J. Hazard Mater. 299, 733-739. 701
Zenata, O., Dvorak, Z., Vrzal, R., 2017. Profiling of bisphenol S towards nuclear receptors 702
activities in human reporter cell lines. Toxicol. Lett. 281, 10-19. 703
Zhu, L., Ge, G., Zhang, H., Liu, H., He, G., Liang, S., Zhang, Y., Fang, Z., Dong, P., Finel, M., Yang, 704
L., 2012. Characterization of hepatic and intestinal glucuronidation of magnolol: 705
application of the relative activity factor approach to decipher the contributions of 706
multiple UDP-glucuronosyltransferase isoforms. Drug Metab. Dispos. 40, 529-538. 707
Zoeller, R.T., Bansal, R., Parris, C., 2005. Bisphenol-A, an environmental contaminant that 708
acts as a thyroid hormone receptor antagonist in vitro, increases serum thyroxine, 709
and alters RC3/neurogranin expression in the developing rat brain. Endocrinology 710
146, 607-612. 711
712
713

31
Table 1: In-vitro activities of BPAF toward nuclear receptors. 714
Assay EC50/IC50
(μM)
Relative
potency
(BPAF/BPA)
Reference
BPAF BPA
Estrogen agonist activity
YES assay 0.39 3.60 9.2 (Fic et al., 2014)
Yeast 2-hybrid 5.3 34.1 6.4 (Lei et al., 2016)
BLYES assay 0.61 4.1 6.7 (Ruan et al., 2015)
MCF7 luc 0.05 0.63 12.6 (Kitamura et al., 2005)
CV1 monkey kidney cells 0.097 0.27 2.8 (Teng et al., 2013)
Androgen antagonist activity
NIH353 1.3 4.3 3.3 (Kitamura et al., 2005)
YAS assay 2.29 3.35 1.5 (Fic et al., 2014)
CV1 monkey kidney cells 1.29 2.34 1.8 (Teng et al., 2013)
Thyroid agonist activity
Yeast two-hybrid 1.4 30.1 21.5 (Lei et al., 2016)
Growth hormone production NA NA / (Kitamura et al., 2005)
hPXR agonist activity
HepG2 cells co-transfected with
hPXR, CYP3A4-luc reporter, and
CMX–β-galactosidase plasmid
* ** / (Sui et al., 2012)
BLYES, bioluminescence yeast estrogen screen; NA, not active; YAS, yeast androgen 715
screen; YES, yeast estrogen screen. *BPAF was a relatively weak PXR agonist compared 716
with BPA; **The half-maximal effective concentration (EC50) for BPA activation of hPXR-717
mediated cytochrome P450 3A4 (CYP3A4) promoter activity was ~9 μM. 718

32
Table 2: Effects of BPA, BPAF and BPAF-G on estrogen, androgen, thyroid, and 719
glucocorticoid receptor activities, and on PXR, FXR, and PPAR activities. 720
Receptor
pathway
Reporter
cell line
Activity Bisphenol EC50/IC50
(µM)
95% confidence
interval (µM)
Estrogen Hela9903 Agonistic BPA 1.1 0.87-1.44
BPAF 0.15 0.10-0.22
BPAF-G NA
Antagonistic BPA NA
BPAF NA
BPAF-G NA
Androgen MDA-kb2 Agonistic BPA NA
BPAF NA
BPAF-G NA
Antagonistic BPA 5.5 0.63-1.51
BPAF 2.9 0.41-1.13
BPAF-G NA
Thyroid GH3.TRE-luc Agonistic BPA NA
BPAF NA
BPAF-G NA
Antagonistic BPA 88 29.2-266.6
BPAF 7.6 5.94-9.80
BPAF-G NA
Glucocorticoid MDA-kb2 Agonistic BPA NA
BPAF NA
33
BPAF-G NA
Antagonistic BPA *
BPAF *
BPAF-G NA
PXR HepG2 Agonistic BPA 0.65 0.54-0.76
BPAF NA
BPAF-G NA
Antagonistic BPA NA
BPAF 3.3 1.45-7.6
BPAF-G 3.7 2.04-6.9
FXR HepG2 Agonistic BPA NA
BPAF 5.6 1.38-22.6
BPAF-G NA
Antagonistic BPA NA
BPAF 4.9 2.41-10.22
BPAF-G NA
PPARγ HepG2 Agonistic BPA NA
BPAF NA
BPAF-G NA
Antagonistic BPA 3.1 1.39-6.93
BPAF NA
BPAF-G 1.7 0.2-15.3
NA, not active; *Antagonistic activity on the glucocorticoid receptor pathway was 721
determined at the highest concentrations tested. Due to solubility problems at higher 722

34
concentrations, concentration-response curves were not constructed, and IC50 was not 723
determined. 724
725

35
Figure legends 726
727
Figure 1. Structures of BPA and BPAF, and the main BPAF metabolite, BPAF-glucuronide. 728
729
Figure 2. BPAF glucuronidation rates for individual UGTs, and human liver (HLM) and 730
intestinal (HIM) microsomes, in the presence of 20 µM and 50 µM BPAF as substrate. (A) 731
BPAF glucuronidation rates for the 17 human recombinant UGTs, including some that are 732
not commercially available. (B) Corrected expression levels for the UGTs in (A) that 733
showed activities. UGT2B15 was not included, as its expression level could not be 734
determined (see Materials). (C) BPAF glucuronidation rates in human liver and intestine 735
microsomes. Data are means ±S.E. of three independent assays. 736
737
Figure 3. Analyses of the agonistic and antagonistic activities of BPA, BPAF, and BPAF-G 738
toward the estrogen, thyroid hormone, androgen, and glucocorticoid receptors. (A, B) ER 739
agonistic (A) and antagonistic (B) activities, with the relevant controls (agonist, E2; 740
antagonist, tamoxifen). (C, D) Thyroid hormone receptor agonistic (C) and antagonistic 741
(D) activities, with the T3 agonist control. (E, F) Androgen agonistic (E) and antagonistic 742
(F) activities, with the relevant controls (agonist, dihydrotestosterone; antagonist, 743
flutamide). (G, H) Glucocorticoid receptor agonistic (G) and antagonistic (H) activities, 744
with the relevant controls (agonist, hydrocortisone; antagonist, mifepristone). Data are 745
means ±SE of three independent experiments. See Methods for assay systems used. 746
747
Figure 4. Analyses of the agonistic and antagonistic activities of BPA, BPAF, and BPAF-G 748
toward PXR, FXR, and PPARγ. (A, B) PXR agonistic (A) and antagonistic (B) activities, with 749
the relevant agonist control (rifaximim). (C, D) FXR agonistic (C) and antagonistic (D) 750

36
activities, with the relevant agonist control (CDCA). (E, F) PPARγ agonistic (E) and 751
antagonistic (F) activities, with the relevant agonist control (rosiglitazon). Data are means 752
±SE of three independent experiments. See Methods for assay systems used. 753
754
Figure 5. BPA, BPAF, and BPAF-G effects on lipid accumulation in 3T3L1 preadypocytes, 755
as revealed by Nile Red staining and quantification. 3T3L1 preadipocytes were 756
differentiated for 8 days in DIM alone, or in combination with BPA, BPAF, or BPAF-G (0.1, 757
1.0, 10 µM). (A) Representative staining for lipid accumulation on day 8 of differentiation, 758
with Alexafluor488-conjugated phalloidin and Nile Red (see Methods). (B) Quantification 759
of fluorescence shown in (A). Data are means ±SE from two experiments, each carried out 760
in triplicate. *p <0.05 versus cells treated with DIM alone (arbitrarily set to 100). 761
762
Figure 6. BPA, BPAF, and BPAF-G effects on differentiation-related gene expression. 763
Preadipocyte 3T3L1 cells were differentiated for 4 or 8 days in the presence of DIM alone 764
(control) or DIM with 1 µM or 10 µM BPA, BPAF, or BPAF-G. Quantification of relative 765
mRNA expression of adipogenic marker genes: adiponectin, Fabp4, Cebpα, and PPARγ. 766
Data are means ±SE from two experiments, each carried out in triplicate. *p <0.05 versus 767
differentiated cells (arbitrarily set to 1). Data are normalized to glyceraldehyde-3-768
phosphate dehydrogenase mRNA expression, and expressed as 2(-ΔΔCt). 769
770

37
771
772
773
Figure 1 774
775

38
776
777
778
Figure 2 779
780
50µM BPAF20µM BPAF
1A
1
1A
3
1A
4
1A
5
1A
6
1A
7
1A
8
1A
9
1A
10
2A
1
2A
2
2A
3
2B
4
2B
7
2B
15
2B
17
2B
28
0
1
2
3
v (
nm
ol/
min
/mg
)
A.
1A
1
1A
3
1A
9
1A
10
2A
1
2A
2
2B
7
2B
17
0.0
0.1
0.2
0.3
0.4
v (
nm
ol/
min
/mg
)
B.
HL
M
HIM
0
2
4
6
v (
nm
ol/
min
/mg
)
C.

39
781
Figure 3 782
783
10 -10 10 -5 100 1050.0
0.5
1.0
1.5
2.0
BPAF
BPA
BPAF-G
Estradiol
Concentration (µM)
Estr
og
en a
ctiv
ity
(no
rmalis
ed
lum
ine
sce
nce
)
10 -6 10 -4 10 -2 100 1020.0
0.5
1.0
1.5
2.0
BPA
BPAF
BPAF-G
Tamoxifen
Concentration (µM)
Anti-
estr
og
en a
ctiv
ity
(no
rmalis
ed
lum
ine
sce
nce
)
10 -8 10 -6 10 -4 10 -2 100 102 1040
5
10
15
20
Triiodothyronine
BPAF
BPA
BPAF-G
Concentration (µM)
Thyr
oid
re
ce
pto
r activ
ity
(no
rmalis
ed
lum
ine
sce
nce
)
10 -6 10 -4 10 -2 100 102 1040.0
0.5
1.0
1.5
2.0
BPA
BPAF
BPAF-G
Concentration (µM)
Anti-
thyr
oid
activ
ity
(no
rmalis
ed
lum
ine
sce
nce
)
10 -8 10 -6 10 -4 10 -2 100 102 1040.0
0.5
1.0
1.5
2.0
2.5
Dihydrotestosterone
BPA
BPAF
BPAF-G
Concentration (µM)
And
rog
en a
ctiv
ity
(no
rmalis
ed
lum
ine
sce
nce
)
10 -6 10 -4 10 -2 100 102 1040.0
0.5
1.0
1.5
2.0
BPAF
BPA
Flutamide
BPAF-G
Concentration (µM)
Anti-
and
rog
en a
ctiv
ity
(no
rmalis
ed
lum
ine
sce
nce
)
10 -6 10 -4 10 -2 100 102 1040
5
10
15
Hydrocortisone
BPA
BPAF
BPAF-G
Concentration (µM)
Glu
co
co
rtic
oid
activ
ity
(no
rmalis
ed
lum
ine
sce
nce
)
10 -6 10 -4 10 -2 100 102 1040.0
0.5
1.0
1.5
2.0
Mifepristone
BPAF
BPA
BPAF-G
Concentration (µM)
Anti-
glu
co
co
rtic
oid
activ
ity
(no
rmalis
ed
lum
ine
sce
nce
)
A. B.
C.
E.
G.
D.
F.
H.

40
784
785
Figure 4 786
787
NT RIFAX BPA BPAF BPAF-G0
1
2
3
4
( 1 0 M )
* *P
XR
A
ct
iv
it
y
(R
LU
/R
RU
)
10-12 10-10 10-8 10-6 10-4
0
25
50
75
100
125 BPA
C, M
PX
R A
ctivi
ty
(% M
axi
mal re
sponse)
10 -12 10 -8 10 -4
0
25
50
75
100
125 BPAF
C, M
FX
R A
ctivity
(% M
axim
al re
sponse)
NT CDCA BPA BPAF BPAF-G0
2
4
6
8
10
(10M)
*
*
FX
R A
ctivity
(RLU
/RR
U)
NT - BPA BPAF BPAF-G0
2
4
6
8
10
(50M)
CDCA (10M)
*
#
anti-F
XR
Activity
(RLU
/RR
U)
10 -12 10 -10 10 -8 10 -6 10 -4
0
25
50
75
100
125 BPAF
C, M
anti-F
XR
Activity
(% M
axim
al re
sponse)
10 -12 10 -10 10 -8 10 -6 10 -4
0
25
50
75
100
125BPABPAF-G
C, M
anti-P
PA
R A
ctivity
(% M
axim
al re
sponse)
NT Rosi BPA BPAF BPAF-G0.0
0.1
0.2
0.3
0.4
(10M)
*
PP
AR A
ctivity
(RLU
/RR
U)
NT - BPA BPAF BPAF-G0.0
0.1
0.2
0.3
0.4
Rosi (100 nM)
(50M)
*
#
#
anti-P
PA
R A
ctivty
(RLU
/RR
U)
10 -12 10 -10 10 -8 10 -6 10 -4
0
25
50
75
100
125BPAF-GBPAF
C, M
anti-P
XR
Activity
(% M
axim
al re
sponse)
NT - BPA BPAF BPAF-G0
1
2
3
4
Rifax (10 M)
(50M)
*
#
#
anti-P
XR
Activity
(RLU
/RR
U)
A.
C.
E.
D.
F.
B.
41
788
789
790
791
792
Figure 5 793
794
DIM 0.1 1 10 0.1 1 10 0.1 1 100
100
200
300
400
500
600
700
800
Nile Red signal quantification
*
*
*
*
*
*
*
*
BPA BPAF BPAF-G
Nu
mb
er
of
pix
els
(flu
ore
sce
nce
in
ten
sity)
(M)
B.

42
795
796
797
Figure 6 798
799
800
0.00.51.01.52.02.53.03.54.04.55.05.56.0
BPAF-G 1 M BPAF-G 10 M
*
*Adiponectin
Fabp4
Cebp
Ppar
mR
NA
re
lative
exp
ressio
n
0.0
0.5
1.0
1.5
5.05.56.0
BPAF 1 M BPAF 10 M
*
mR
NA
re
lative
exp
ressio
n
0.00.51.01.52.02.53.03.54.04.55.05.56.0
BPA 1 M BPA 10 M
*
*
*
mR
NA
re
lative
exp
ressio
n
0.0
0.5
1.0
1.5
2.0
2.5
3.05.0
5.5
6.0
BPA 1 M BPA 10 M
*
***
mR
NA
re
lative
exp
ressio
n
0.0
0.5
1.0
1.5
2.05.0
5.5
6.0
BPAF-G 1 M BPAF-G 10 M
*
*
*
mR
NA
re
lative
exp
ressio
n
0.0
0.5
1.0
1.5
2.0
2.55.0
5.5
6.0
BPAF 1 M BPAF 10 M
* **
*
mR
NA
re
lative
exp
ressio
n
3T3L1 D4
3T3L1 D8