1 economic environment: weathering the storm? the fairfield county economy, the year ahead december...
TRANSCRIPT

1
Economic Environment: Economic Environment:
Weathering the Storm?Weathering the Storm?
The Fairfield County Economy, The Fairfield County Economy, The Year AheadThe Year Ahead
December 7, 2005 Todd P. Martin Economic Services203-218-9825 [email protected]

2
US Economic Backdrop US Economic Backdrop
• Economic growth remains respectable despite headwinds of Hurricanes, higher energy prices, and rising interest rates. Real GDP should slow to approximately a 3% pace next year.
• The Fed will continue to gradually tightening monetary policy to a “neutral” posture. The targeted fed funds rate is expected to rise to 4.5% by early 2006 (up from 1.0% in June 2004). Ben Bernanke replaces Alan Greenspan as chairman in late January.
• The yield curve continues to flattened as 10-year T-note yields have remained relatively low while short-term rates are up 300 BPs. Long-term yield should move from 4.50% currently to 5.0% by early 2006.
• Core Inflation remains contained, but future price concerns are heightening.
• Risks: Iraq - terrorism - energy prices – interest rates – housing bubble? – Longer-Term: growing budget & trade deficits – consumer leverage

3
The Fed will tighten a bit more “The cumulative rise in energy and other costs has
the potential to add to inflation pressures; however, core inflation has been relatively low in recent months and longer-term inflation expectations remain contained.”
“With underlying inflation expected to be contained, the Committee believes that policy accommodation can be removed at a pace that is likely to be measured.”
Federal Open Market Committee Press Release – 1101/05

4
Smooth Transition at the Fed?
Alan Greenspan Ben Bernanke
Wall Street Journal
Release Date: October 24, 2005
Statement by Federal Reserve Board Chairman Alan Greenspan:
"The President has made a distinguished appointment in Ben Bernanke. Ben comes with superb academic credentials and important insights into the ways our economy functions. I have no doubt that he will be a credit to the nation as Chairman of the Federal Reserve Board."

5
Monetary policy works with a lag of 6-18 monthsMonetary policy works with a lag of 6-18 months
Source: Bloomberg, Federal Reserve,TPM Economic Services
Targeted Fed Funds Rate vs. 10-year T-Note & 30-year Mortgage Yields
0
1
2
3
4
5
6
7
8
9
10
Fed Funds
10-Year T-Note
30-Year Mortgage

6
The economy expanded at a 4.3% pace in the 3rd Q ‘05The economy expanded at a 4.3% pace in the 3rd Q ‘05
Source: The Conference Board, BEA,TPM Economic Services
Gross Domestic Product (CW$)
Transformation: %Chg, AR Source: Bureau of Economic Analysis
-2
0
2
4
6
8
95 96 97 98 99 00 01 02 03 04 05

7
Jobless Claims suggest continued job growthJobless Claims suggest continued job growth
Source: Bloomberg, BLS, TPM Economic Services
US Weekly Initial Jobless Claims - 4 week MA
200.0
250.0
300.0
350.0
400.0
450.0
500.0
550.0Jan-89
Aug-89
Mar-90
Oct-90
May-91
Nov-91
Jun-92
Jan-93
Aug-93
Mar-94
Oct-94
May-95
Dec-95
Jul-9
6Jan-97
Aug-97
Mar-98
Oct-98
May-99
Dec-99
Jul-0
0Feb-01
Sep-01
Apr-02
Nov-02
May-03
Dec-03
Jul-0
4Feb-05
Sep-05
Spike due to Katrina – trend intact
Similar Pattern to early 1990s?

8
CT Economic OutlookCT Economic Outlook
• Connecticut’s economic rebound has lagged the national recovery. While job growth has improved recently, CT employment is still down 25,400 from mid-2000. CT is the only state that hasn’t seen job growth from 1989.
• According to NEEP, the state should add 18,200 jobs in 2005 and 17,600 in 2006. The Unemployment rate has moved above national average.
• Fairfield County’s economic performance is strong, but long-term viability is threatened by high cost of living, transportation woes, and energy issues.
• Housing remains very strong in the state. Housing permits totaled 11,837 in 2004 -- the strongest since 1989. Not overbuilt like the late 1980s.
• CT vulnerable to national (and global) economy, higher interest rates, energy prices, high cost of living, and complacency

9
CT is still down 25,400 jobs from July 2000 peakCT is still down 25,400 jobs from July 2000 peak
Source: CT Labor Department, BLS, TPM Economic Services
Connecticut, Employment, Total Nonagricultural
Transformation: Level Source: Bureau of Labor Statistics
1500
1550
1600
1650
1700
90 91 92 93 94 95 96 97 98 99 00 01 02 03 04 05
[Thousands]
Up 36,000 jobs from Sept. 2003 low

10
Other states have more than regained jobs lostOther states have more than regained jobs lost
Source: The Conference Board, BLS, TPM Economic Services
[Thousands]NH, RI & NJ Non-Farm Employment
New Hampshire Rhode Island New Jersy
NH &
RI T
hous
ands
NJ T
hous
ands
400.00
450.00
500.00
550.00
600.00
650.00
3000
3500
4000
4500
90 91 92 93 94 95 96 97 98 99 00 01 02 03 04 05

11
CT Employment growth performance sub-parCT Employment growth performance sub-par
YOY% Change in payroll employment (Sept. 2005 vs. Sept. 2004)
0.3
0.91.0
1.11.2 1.2
1.3
1.8
2.1
1.6
0.0
0.5
1.0
1.5
2.0
2.5
MA ME NY CT NJ RI PA VT NH US
Source: CT Labor Dept., TPM Economic Services

12
CT unemployment above US Rate - first time in 8 yearsCT unemployment above US Rate - first time in 8 years
Source: CT Labor Department, BLS, TPM Economic Services
Unemployment Rate CT vs. US
Unemployment Rate CT Unemployment Rate US
2
3
4
5
6
7
00 01 02 03 04 05
% of labor force (SA)

13
Fairfield County Unemployment rates very lowFairfield County Unemployment rates very low
CT Unemployment Rates % Bridgeport-Stamford LMA - Oct. 2005
3.3 3.4 3.4 3.5 3.5 3.5 3.6 3.7 3.8 3.8 3.8 3.9 3.9 3.9 4.0 4.0 4.1 4.2 4.2 4.44.7
5.65.9
6.3
7.8
0.0
1.0
2.0
3.0
4.0
5.0
6.0
7.0
8.0
9.0
Source: CT Labor Dept., TPM Economic Services

14
CT Construction sector has seen strongest growthCT Construction sector has seen strongest growth
Source: CT Labor Department, BLS, TPM Economic Services
Connecticut, Employment, Construction
Transformation: Level Source: Bureau of Labor Statistics
40
50
60
70
80
90 91 92 93 94 95 96 97 98 99 00 01 02 03 04 05
[YOY Change - Thousands]

15
CT FIRE employment - continued consolidationCT FIRE employment - continued consolidation
Source: CT Labor Department, BLS, TPM Economic Services
Connecticut, Employment, Finance, Insurance, Real Estate
Transformation: Level Source: Bureau of Labor Statistics
125
135
145
155
90 91 92 93 94 95 96 97 98 99 00 01 02 03 04 05
[Thousands]

16
Where CT has lost jobs over the last 12 monthsWhere CT has lost jobs over the last 12 months
-700
-500
-400
-300
-200
-200
-200
-100
-100
-100
-100
-100
-1000 -900 -800 -700 -600 -500 -400 -300 -200 -100 0
Other Retail
Insurance
Computer & Electronic Product
Other Non-Durable Goods
Machinery
Printing & Related
Utilities
Other Durable Goods
Plastics & Rubber
Motor Vehicle & Parts Dealers
Information
Arts, Ent. & Recreation
Change in CT Non-Farm Employment Oct. 2005 vs. Oct. 2004 ( Not SA)
Source: CT Labor Department, TPM Economic Services

17
Where jobs were created last yearWhere jobs were created last year
100
100
200
300
400
400
400
500
500
500
600
700
800
900
1,000
1,300
1,300
2,2003,400
0 500 1,000 1,500 2,000 2,500 3,000 3,500 4,000
Fabricated Metal
Food & Beverage Stores
Other Financial
Other Services
Transportation Equipment
Credit Intermediation
Real Estate & Rental & Leasing
Building Materials
General Merchandise
State Gov.
Professional & Business Services
Educational Services
Accommodation & Food Services
Securities & Commodity
Local Gov.
Wholesale Trade
Transportation & Warehousing
Health Care & Social Assistance
Construction & Mining
Change in CT Non-Farm Employment Oct. 2005 vs. Oct. 2004 ( Not SA)
Source: CT Labor Department, TPM Economic Services

18
Sectors with largest % change last yearSectors with largest % change last year
-2.60%
-2.40%
-2.30%
-1.70%
-1.30%
-1.10%
-0.80%
-0.80%
-0.40%
-0.40%
-0.40%
-0.30%
-3.0% -2.5% -2.0% -1.5% -1.0% -0.5% 0.0%
Computer & Electronic Product
Printing & Related
Utilities
Other Non-Durable Goods
Plastics & Rubber
Machinery
Other Retail
Insurance
Motor Vehicle & Parts Dealers
Arts, Ent. & Recreation
Other Durable Goods
Information
% Change in CT Non-Farm Employment Oct. 2005 vs. Oct. 2004 ( Not SA)
Source: CT Labor Department, TPM Economic Services

19
Sectors with the strongest % job growthSectors with the strongest % job growth
0.30%
0.30%
0.50%
0.60%
0.80%
0.80%
0.90%
1.00%
1.30%
1.30%
1.90%
2.00%
2.00%
3.10%
3.10%
4.30%
4.80%
4.80%
0.0% 1.0% 2.0% 3.0% 4.0% 5.0% 6.0%
Fabricated Metal
Professional & Business Services
Other Services
Local Gov.
Accommodation & Food Services
State Gov.
Transportation Equipment
Health Care & Social Assistance
Credit Intermediation
Educational Services
General Merchandise
Real Estate & Rental & Leasing
Wholesale Trade
Transportation & Warehousing
Building Materials
Other Financial
Securities & Commodity
Construction & Mining
% Change in CT Non-Farm Employment Oct. 2005 vs. Oct. 2004 ( Not SA)
Source: CT Labor Department, TPM Economic Services

20
Job gains & losses in SW CT – last 12 mo. Job gains & losses in SW CT – last 12 mo.
-1,100
-500
-200
-100
0
100
200
200
700
800
1,200
1,300
-1,500 -1,000 -500 0 500 1,000 1,500
MANUFACTURING
PROFESSIONAL & BUSINESS SERVICES
Wholesale Trade
Transportation, Warehousing, & Utilities
INFORMATION
CONSTRUCTION
Retail Trade
OTHER SERVICES
LEISURE AND HOSPITALITY
FINANCIAL ACTIVITIES
GOVERNMENT
EDUCATIONAL AND HEALTH SERVICES
Change in Employment, Bridgeport-Stamford LMA – Oct. 2005 vs. Oct. 2004 - NSA
Source: CT Labor Department, TPM Economic Services
21
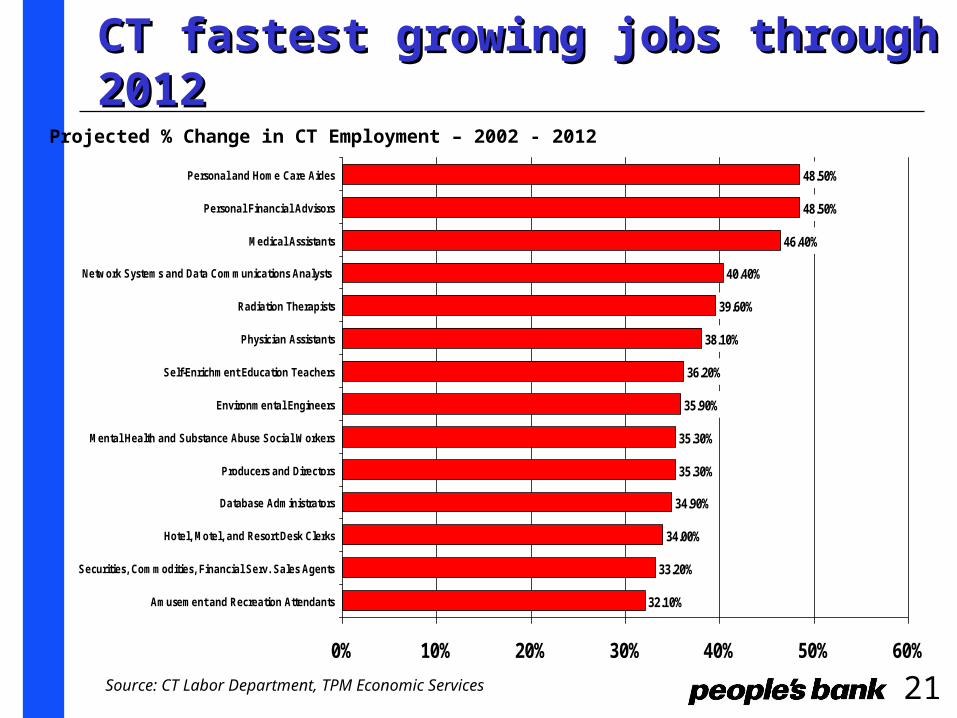
CT fastest growing jobs through 2012 CT fastest growing jobs through 2012
32.10%
33.20%
34.00%
34.90%
35.30%
35.30%
35.90%
36.20%
38.10%
39.60%
40.40%
46.40%
48.50%
48.50%
0% 10% 20% 30% 40% 50% 60%
Amusement and Recreation Attendants
Securities, Commodities, Financial Serv. Sales Agents
Hotel, Motel, and Resort Desk Clerks
Database Administrators
Producers and Directors
Mental Health and Substance Abuse Social Workers
Environmental Engineers
Self-Enrichment Education Teachers
Physician Assistants
Radiation Therapists
Network Systems and Data Communications Analysts
Medical Assistants
Personal Financial Advisors
Personal and Home Care Aides
Projected % Change in CT Employment – 2002 - 2012
Source: CT Labor Department, TPM Economic Services

22
CT jobs with largest growth through 2012CT jobs with largest growth through 2012
2,360
2,469
2,475
2,495
2,548
2,583
2,678
3,045
3,106
3,751
4,306
4,399
4,460
5,248
0 1,000 2,000 3,000 4,000 5,000 6,000
Receptionists and Information Clerks
Landscaping and Groundskeeping Workers
Social and Human Service Assistants
Computer Systems Analysts
Teacher Assistants
Accountants and Auditors
Personal and Home Care Aides
Combined Food Preparation and Serving Workers
Janitors & Cleaners, exc.Maids, Housekeeping Cleaners
Customer Service Representatives
Waiters and Waitresses
Retail Salespersons
Cashiers
Registered Nurses
Projected Change in CT Employment – 2002 - 2012
Source: CT Labor Department, TPM Economic Services

23
Highest paid, fastest growing CT occupationsHighest paid, fastest growing CT occupations
$65,718
$65,915
$67,642
$67,995
$70,658
$72,051
$73,091
$74,818
$77,584
$85,842
$107,078
$111,779
$129,667
0 20,000 40,000 60,000 80,000 100,000 120,000 140,000
Producers and Directors
Architects, Except Landscape and Naval
Network & Computer Systems Administrators
Environmental Engineers
Computer Systems Analysts
Network Systems and Data Communications Analysts
Physician Assistants
Computer Software Engineers, Applications
Computer Software Engineers, Systems Software
Medical Scientists, Except Epidemiologists
Personal Financial Advisors
Computer and Information Systems Managers
Securities, Commodities, Financial Serv. Sales Agents
Microbiologists
Biochemists and Biophysicists
Average CT Salaries in 2003
Source: CT Labor Department, TPM Economic Services
Salaries N/A

24
Housing is booming – Is there a Bubble?Housing is booming – Is there a Bubble?
Source: Conference Board, Census Bureau, TPM Economic Services
Housing Sales, New and Existing Homes
Transformation: Level Source: Bureau of the Census
3
4
5
6
7
8
9
89 90 91 92 93 94 95 96 97 98 99 00 01 02 03 04 05

25
Overvalued Housing MarketsOvervalued Housing Markets
Source: Wall Street Journal, PMI Mtg. Insurance Co.
Home prices, percent overvalued relative to long-term trend
33.7%
31.3%
27.4%
25.6%
25.5%
25.5%
23.2%
22.2%
22.0%
20.5%
20.4%
19.6%
19.6%
19.5%
19.1%
18.5%
18.2%
30.7%
26.4%
26.5%
0.0% 5.0% 10.0% 15.0% 20.0% 25.0% 30.0% 35.0% 40.0%
Los Angeles-Long Beach, Calf.
Sacramento-Arden, Calf.
Riverside-San Bernadino, Calf.
Edison, N.J .
Oakland-Freemont-Hayward, Calf.
San J ose-Sunnyvale-Santa Calra, Calf.
Newark-Union, N.J .
Santa Ana-Anaheim-Irvine, Calf.
Las Vegas, Nev.
Tampa-St. Petersburg-C learwater, Fla.
San Diego-Carlsbad-San Marcos, Calf.
Phoenix-Mesa-Scottsdale, Ariz
Miami-Miami Beach-Kendall, Fla.
Nassau-Suff olk, N.Y .
Fort Lauderdale-Pompano Beach, Fla.
Orlando, Fla.
San Fransico-San Mateo, Calf.
Providence, R.I./New Bedford-Fall River, Mass.
Virgina Beach-Norfolk-Newport News, Va.
Washington, DC/Arlington-Alexandria, Va.

26
Riskiest Housing MarketsRiskiest Housing Markets
Source: Wall Street Journal, PMI Mtg. Insurance Co.
Risk Index = biggest chance of housing price declines over the next two years
93
111
197
232
236
288
362
440
456
460
464
466
472
502
522
532
536
133
201
206
0 100 200 300 400 500 600
Phoenix-Mesa-Scottsdale, Ariz
Orlando, Fla.
Virgina Beach-Norfolk-Newport News, Va.
Las Vegas, Nev.
Tampa-St. Petersburg-C learwater, Fla.
Miami-Miami Beach-Kendall, Fla.
Newark-Union, N.J .
Washington, DC/Arlington-Alexandria, Va.
Fort Lauderdale-Pompano Beach, Fla.
Edison, N.J .
San Fransico-San Mateo, Calf.
Sacramento-Arden, Calf.
Los Angeles-Long Beach, Calf.
Providence, R.I./New Bedford-Fall River, Mass.
Riverside-San Bernadino, Calf.
San J ose-Sunnyvale-Santa Calra, Calf.
Oakland-Freemont-Hayward, Calf.
Santa Ana-Anaheim-Irvine, Calf.
Nassau-Suff olk, N.Y .
San Diego-Carlsbad-San Marcos, Calf.

27
Housing still affordable, but falls to 14 year lowHousing still affordable, but falls to 14 year low
Source: Conference Board, WEFA, NAR, TPM Economic Services
Index, Housing Affordability
Transformation: Level Source: WEFA, NAR
100
110
120
130
140
150
89 90 91 92 93 94 95 96 97 98 99 00 01 02 03 04 05

28
Housing is not overbuild like the mid-1980sHousing is not overbuild like the mid-1980s
Source:CT DECD, New England Economic Partnership, TPM Economic Services
Total housing permits authorized in CT in units
16,9
27 19,3
92
26,2
4630
,163
27,4
15
19,5
47
11,9
70
7,58
0
7,48
0
8,01
09,
250
9,46
0
8,55
0
8,53
7
9,31
1 11,8
6310
,637
9,37
6
9,29
0
9,73
1
10,4
35
11,8
37
11,9
3511
,442
9,60
6
10,0
24
10,7
05
0.0
5,000.0
10,000.0
15,000.0
20,000.0
25,000.0
30,000.0
35,000.01983
1985
1987
1989
1991
1993
1995
1997
1999
2001
2003
2005
2007
2009
2005-2009 is forecast

29
Fairfield County Permits up about 5.5% YTDFairfield County Permits up about 5.5% YTD
-60%
-53%
-39%
-26%
-24%
-19%
-19%
-8%
11%
12%
26%
43%
47%
48%
77%
80%
-80% -60% -40% -20% 0% 20% 40% 60% 80% 100%
Bethel
Norwalk
Trumbull
Stratford
Newtown
Ridgefield
Fairfield
Westport
Danbury
New Canaan
Greenwich
Easton
Stamford
Monroe
Shelton
Bridgeport
% Change in Housing Permits Authorized (Jan-Oct 2005 vs. Jan-Oct 2004)
Source: CT DECD, TPM Economic Services
Excludes: Brookfield, Darien, New Fairfield, Redding, Sherman, Weston & Wilton

30
Teardowns in Fairfield

31
Teardowns in Fairfield (cont.)

32
Teardowns in Fairfield (cont.)

33
Teardowns in Fairfield (cont.)
34
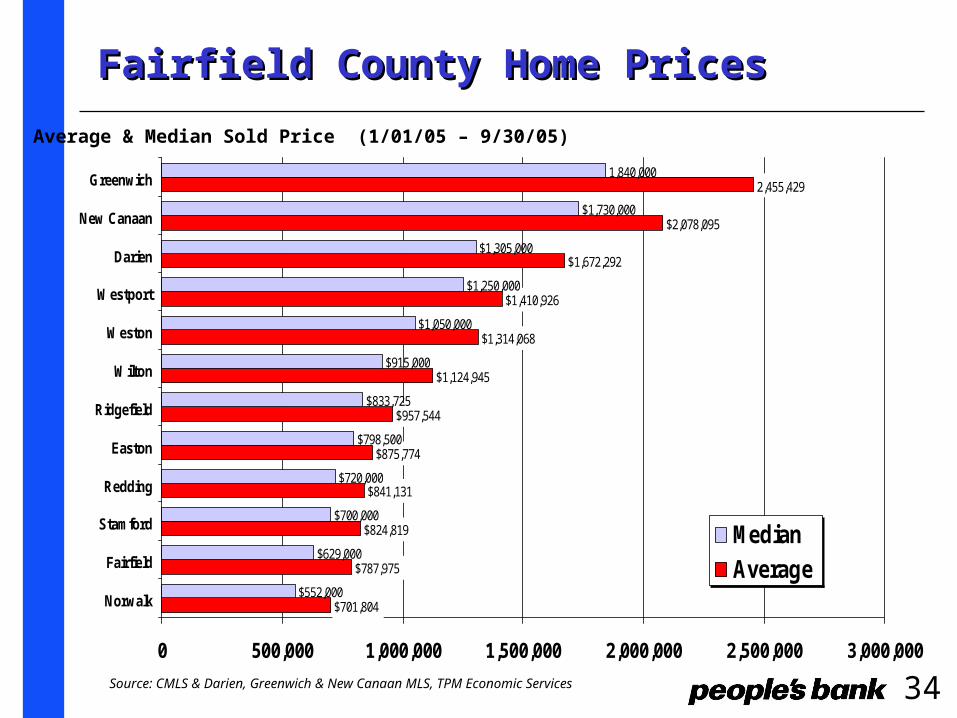
Fairfield County Home PricesFairfield County Home Prices
$701,804
$787,975
$824,819
$841,131
$875,774
$957,544
$1,124,945
$1,314,068
$1,410,926
$1,672,292
$2,078,095
2,455,429
$552,000
$629,000
$700,000
$720,000
$798,500
$833,725
$915,000
$1,050,000
$1,250,000
$1,305,000
$1,730,000
1,840,000
0 500,000 1,000,000 1,500,000 2,000,000 2,500,000 3,000,000
Norwalk
Fairfield
Stamford
Redding
Easton
Ridgefield
Wilton
Weston
Westport
Darien
New Canaan
Greenwich
Median
Average
Average & Median Sold Price (1/01/05 – 9/30/05)
Source: CMLS & Darien, Greenwich & New Canaan MLS, TPM Economic Services

35
Fairfield County Home PricesFairfield County Home Prices still rising still rising
7%
7%
10%
10%
11%
12%
12%
13%
15%
17%
17%
36%
0% 5% 10% 15% 20% 25% 30% 35% 40%
Greenwich
Westport
Redding
Wilton
Stamford
Darien
Ridgefield
Easton
Fairfield
New Canaan
Norwalk
Weston
Average % change in sold price (Jan-Sept 2005 vs. Jan-Sept 2004)
Source: CMLS & Darien, Greenwich & New Canaan MLS, TPM Economic Services

36
Transportation is a major concern

37
Impact of Higher Energy Costs
38
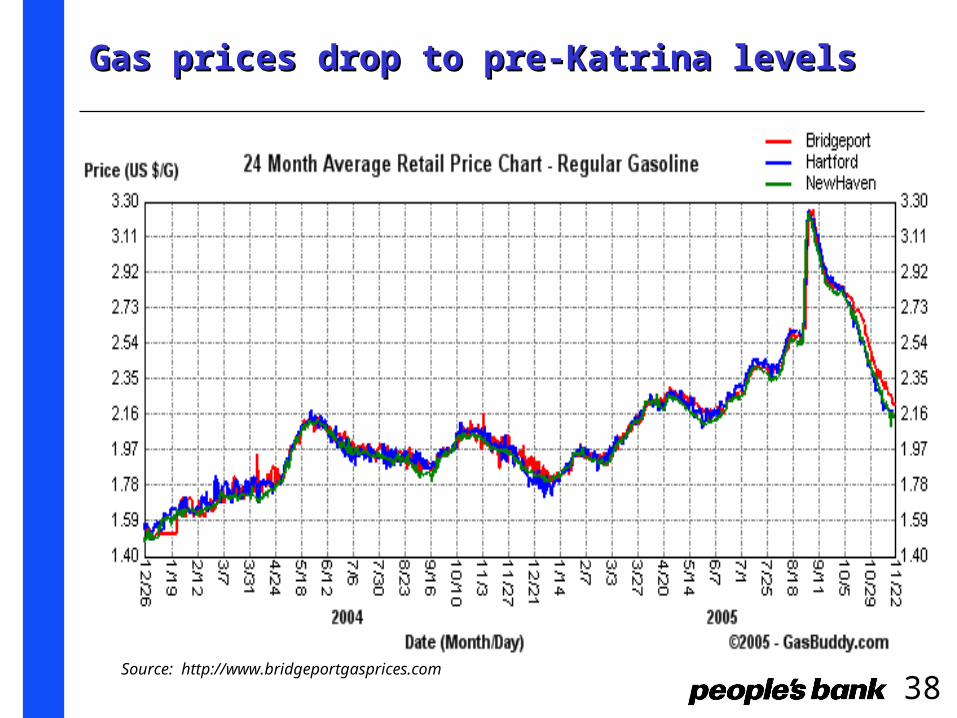
Gas prices drop to pre-Katrina levels Gas prices drop to pre-Katrina levels
Source: http://www.bridgeportgasprices.com

39
Tax revenues total $2.6 billion YTDTax revenues total $2.6 billion YTD
Source: State of CT Dept. of Revenue Services
Year-to-Date CT Tax Revenues ( FY 05-06, July – Oct. $millions)
$55,867
$75,369
$837,055
$2,609,229
$173,509
$1,125,550
$0 $500,000 $1,000,000 $1,500,000 $2,000,000 $2,500,000 $3,000,000
Real Estate Conv.
Petroleum Gross Earnings
Corp & Public Service
Sales & Use
Income
Total
+$210 million, or 8.8%
+$73.5 million or 7.0%
+$29.6 million or 3.7%
+$26.4 million or 26.4%
+$30.1 million or 66.4%
+$10.3 million or 22.5%

40
Focus on the Big Picture
Ten Forces Flattening The World1. 11/9/892. 8/9/953. Work Flow Software4. Open-Sourcing5. Outsourcing6. Offshoring7.Supply-Chaining 8. Insourcing9. In-Forming10. The Steroids
41
CERC Benchmarking Study
• How is Connecticut Positioned in terms of Competitiveness & Innovation in the Knowledge Economy?
• Connecticut Economy at a critical juncture:– Currently scores well in productivity, educated workforce, technology,
etc.
– Losing grounds to other states, urban/suburban disparities, aging population, slow business & job growth, University R&D, etc.
For more information, please see: www.cerc.com/benchmarks

42
SummarySummary• US Economic growth is expected to moderate to 3.0% - 3.5% in
2006 (Hurricanes, energy, interest rates) – job growth improving, but remains sub-par, Inflation pressures building
• Fed moving short-term interest rates toward ‘neutrality’
• Connecticut job growth has lagged the US – NEEP expects 18,200 jobs in 2005. Rising taxes, higher costs, scandals have not helped recovery. Budget battles will continue – 2006 Election Year .
• Fairfield County: remarkably prosperous – Longer-term challenges: transportation, affordable housing, energy problems, high business costs, dealing successfully with the ‘Flattening World’

43
Economic Environment: Economic Environment:
Weathering the Storm?Weathering the Storm?
The Fairfield County Economy, The Fairfield County Economy, The Year AheadThe Year Ahead
December 7, 2005 Todd P. Martin Economic Services203-218-9825 [email protected]