1 drug utilization for immediate- and modified release opioids in the u.s. gianna c. rigoni,...
Post on 19-Dec-2015
217 views
TRANSCRIPT

1
Drug Utilization for Immediate- and Modified
Release Opioids in the U.S.
Gianna C. Rigoni, Pharm.D., M.S.Epidemiologist
Division of Surveillance, Research & Communication Support
Office of Drug Safety, FDA
September 9, 2003

2
Drug Utilization Data Sources
• Outpatient Data– IMS Health, National Prescription
Audit Plus (NPA Plus)
– IMS Health, National Disease and Therapeutic Index (NDTI)
• Inpatient Data– Premier, Inc., Perspective Rx View
3
Outpatient Drug Utilization

4
National Prescription Audit
(NPA Plus)• Measures the “retail outflow” of prescriptions
from pharmacies to consumers • Includes: chain, independent, mass
merchandisers, food stores with pharmacies, mail-order*, and long-term care* pharmacies
• The number of dispensed prescriptions is obtained from a sample of approximately 22,000 pharmacies in the U.S. and is projected nationally
* Excluded from this analysis

5
Total Prescriptions Dispensed* Annually for Selected Opioids, 1998 - 2002
•Source: IMS Health, National Prescription Audit PlusTM, Year 1998 to 2002, Excluding Long-Term Care & Mail Order Channels, Data Extracted August 2003.
0
20,000
40,000
60,000
80,000
100,000
120,000
1998 1999 2000 2001 2002Year
TR
x (0
00)
IMMEDIATE RELEASEOPIOIDS (Fentanyl,Hydrocodone,Hydromorphone, Morphine,Oxycodone) MODIFIED RELEASEOPIOIDS (Fentanyl,Morphine, Oxycodone)
METHADONE HCL

6
Total Prescriptions Dispensed*
Annually for Immediate-Release Opioids, 1998 - 2002
(WITH Hydrocodone & Oxycodone Combination Products)
0
10,000
20,000
30,000
40,000
50,000
60,000
70,000
80,000
90,000
100,000
1998 1999 2000 2001 2002
Year
TRx
(000
)
HYDROCODONE(Vicodin®, Lortab®, etc.)
OXYCODONE (Percocet®,Roxicodone®, etc.)MORPHINE (MSIR®, etc.)
HYDROMORPHONE(Dilaudid®, etc.)FENTANYL (Actiq)
•Source: IMS Health, National Prescription Audit PlusTM, Year 1998 to 2002, Excluding Long-Term Care & Mail Order Channels, Data Extracted August 2003.

7
0
250
500
750
1,000
1,250
1,500
1,750
2,000
2,250
1998 1999 2000 2001 2002Year
TR
x (0
00)
OXYCODONE(Roxicodone®, etc.)
MORPHINE(MSIR®, etc.)
HYDROMORPHONE (Dilaudid®, etc.)
FENTANYL(Actiq®)
Total Prescriptions Dispensed* Annually for Selected Immediate-
Release Opioids, 1998 - 2002(WITHOUT Hydrocodone & Oxycodone Combination Products)
•Source: IMS Health, National Prescription Audit PlusTM, Year 1998 to 2002, Excluding Long-Term Care & Mail Order Channels, Data Extracted August 2003.

8
0
1,000
2,000
3,000
4,000
5,000
6,000
7,000
1998 1999 2000 2001 2002
Year
TR
x (0
00)
OXYCODONE (OxyContin®)
FENTANYL (Duragesic®)
MORPHINE (MS Contin®,Kadian®, Oramorph SR®, Avinza®)METHADONE (Dolophine®, etc.)
•Source: IMS Health, National Prescription Audit PlusTM, Year 1998 to 2002, Excluding Long-Term Care & Mail Order Channels, Data Extracted August 2003.
Total Prescriptions Dispensed*
Annually for Modified-Release Opioids & Methadone, 1998 - 2002
9
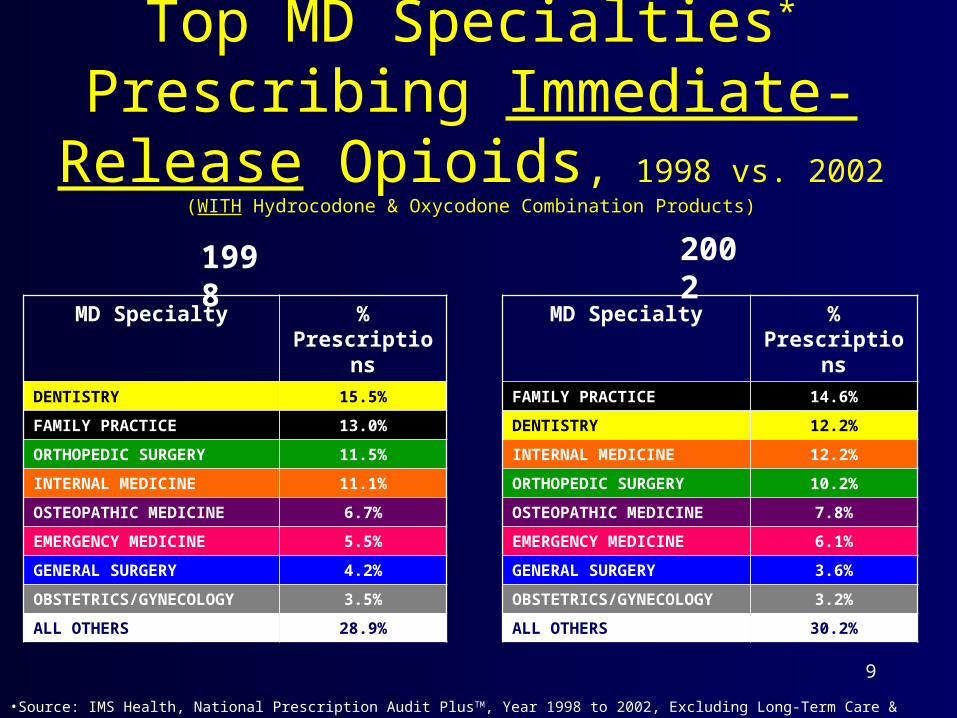
Top MD Specialties*
Prescribing Immediate-Release Opioids, 1998 vs. 2002
(WITH Hydrocodone & Oxycodone Combination Products)
MD Specialty % Prescription
sFAMILY PRACTICE 14.6%
DENTISTRY 12.2%
INTERNAL MEDICINE 12.2%
ORTHOPEDIC SURGERY 10.2%
OSTEOPATHIC MEDICINE
7.8%
EMERGENCY MEDICINE 6.1%
GENERAL SURGERY 3.6%
OBSTETRICS/GYNECOLOGY
3.2%
ALL OTHERS 30.2%
1998
2002
MD Specialty % Prescription
sDENTISTRY 15.5%
FAMILY PRACTICE 13.0%
ORTHOPEDIC SURGERY 11.5%
INTERNAL MEDICINE 11.1%
OSTEOPATHIC MEDICINE
6.7%
EMERGENCY MEDICINE 5.5%
GENERAL SURGERY 4.2%
OBSTETRICS/GYNECOLOGY
3.5%
ALL OTHERS 28.9%
•Source: IMS Health, National Prescription Audit PlusTM, Year 1998 to 2002, Excluding Long-Term Care & Mail Order Channels, Data Extracted August 2003.

10
Top MD Specialties*
Prescribing Selected Immediate-Release Opioids, 1998
vs. 2002(WITHOUT Hydrocodone & Oxycodone Combination Products)
1998
2002
MD Specialty % Prescription
sHEM/ONC/NEOPLASTIC 23.4%
INTERNAL MEDICINE 17.9%
FAMILY PRACTICE 12.6%
ANESTHESIOLOGY 7.9%
OSTEOPATHIC MEDICINE
6.5%
ORTHOPEDIC SURGERY 2.6%
NEUROLOGY 2.1%
PHYSICAL MED & REHAB 2.0%
ALL OTHERS 24.8%
MD Specialty % Prescription
sINTERNAL MEDICINE 15.2%
ANESTHESIOLOGY 14.6%
FAMILY PRACTICE 13.1%
HEM/ONC/NEOPLASTIC 10.8%
OSTEOPATHIC MEDICINE
8.9%
PHYSICAL MED & REHAB
5.4%
ORTHOPEDIC SURGERY 3.5%
NEUROLOGY 2.6%
ALL OTHERS 25.9%
•Source: IMS Health, National Prescription Audit PlusTM, Year 1998 to 2002, Excluding Long-Term Care & Mail Order Channels, Data Extracted August 2003.

11
Top MD Specialties*
Prescribing Modified-Release Opioids & Methadone, 1998 vs. 2002
MD Specialty % Prescription
sFAMILY PRACTICE 17.1%
INTERNAL MEDICINE 16.7%
ANESTHESIOLOGY 16.4%
OSTEOPATHIC MEDICINE 10.3%
PHYSICAL MEDICINE & REHAB
6.3%
HEM/ONC/NEOPLASTIC 6.2%
ALL OTHERS 27.1%
1998
2002
MD Specialty % Prescription
sINTERNAL MEDICINE 17.5%
ANESTHESIOLOGY 14.5%
FAMILY PRACTICE 13.9%
HEM/ONC/NEOPLASTIC 13.9%
OSTEOPATHIC MEDICINE 8.4%
PHYSICAL MEDICINE & REHAB
3.4%
ALL OTHERS 28.2%
•Source: IMS Health, National Prescription Audit PlusTM, Year 1998 to 2002, Excluding Long-Term Care & Mail Order Channels, Data Extracted August 2003.
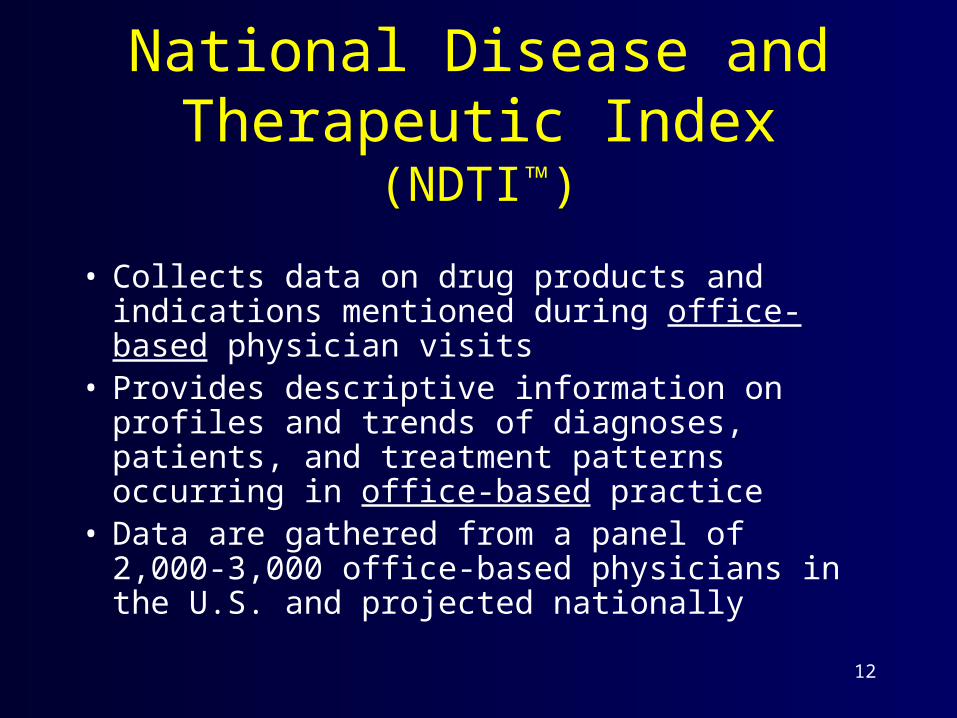
12
National Disease andTherapeutic Index
(NDTI)
• Collects data on drug products and indications mentioned during office-based physician visits
• Provides descriptive information on profiles and trends of diagnoses, patients, and treatment patterns occurring in office-based practice
• Data are gathered from a panel of 2,000-3,000 office-based physicians in the U.S. and projected nationally

13
Indications* Associated with Immediate-Release Opioids,
1998 vs. 2002 (WITH Hydrocodone & Oxycodone Combination Products)
* Source: IMS Health, National Disease and Therapeutic IndexTM , Year 1998 to 2002, Excluding Long-Term Care & Mail Order Channels, Data Extracted August 2003.
11,033
13,712
9,408
12,883
7,216
10,388
1,248 1,176
0
2,000
4,000
6,000
8,000
10,000
12,000
14,000
P-D
rug
Use
s (0
00)
Other Pain Surgical Procedures Musculoskeletal Pain Neoplasms
Diagnoses
1998
2002
Surgical Procedures include post-op examsMusculoskeletal Pain includes back pain, myalgias, osteoarthritis, rheumatoid arthritis, etc.Other Pain includes migraine, headache, calculi, fractures, dental pain, complications of pregnancy, etc.
14
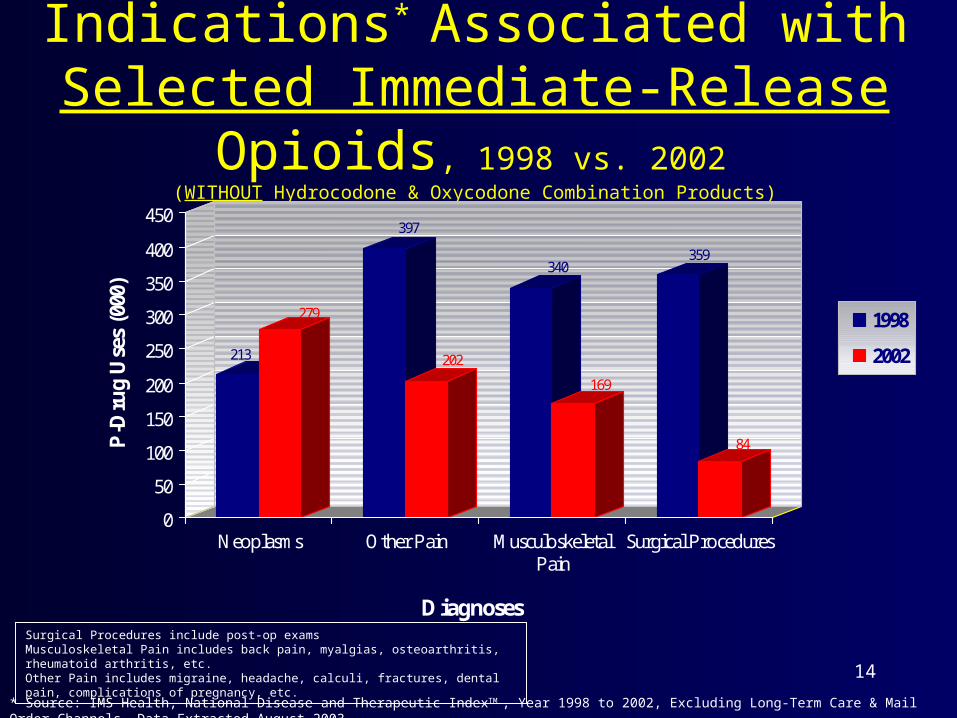
Indications* Associated with Selected Immediate-Release
Opioids, 1998 vs. 2002 (WITHOUT Hydrocodone & Oxycodone Combination Products)
213
279
397
202
340
169
359
84
0
50
100
150
200
250
300
350
400
450
P-D
rug
Use
s (0
00)
Neoplasms Other Pain MusculoskeletalPain
Surgical Procedures
Diagnoses
1998
2002
* Source: IMS Health, National Disease and Therapeutic IndexTM , Year 1998 to 2002, Excluding Long-Term Care & Mail Order Channels, Data Extracted August 2003.
Surgical Procedures include post-op examsMusculoskeletal Pain includes back pain, myalgias, osteoarthritis, rheumatoid arthritis, etc.Other Pain includes migraine, headache, calculi, fractures, dental pain, complications of pregnancy, etc.

15
Indications* Associated with Modified-Release Opioids &
Methadone, 1998 vs. 2002
504
2,092
651
1,174
794
944
139
386
0
250
500
750
1,000
1,250
1,500
1,750
2,000
2,250
P-D
rug
Use
s (0
00)
MusculoskeletalPain
Other Pain Neoplasms Surgical Procedures
Diagnoses
1998
2002
* Source: IMS Health, National Disease and Therapeutic IndexTM , Year 1998 to 2002, Excluding Long-Term Care & Mail Order Channels, Data Extracted August 2003.
Surgical Procedures include post-op examsMusculoskeletal Pain includes back pain, myalgias, osteoarthritis, rheumatoid arthritis, etc.Other Pain includes migraine, headache, calculi, fractures, dental pain, complications of pregnancy, etc.

16
Inpatient Drug Utilization
17
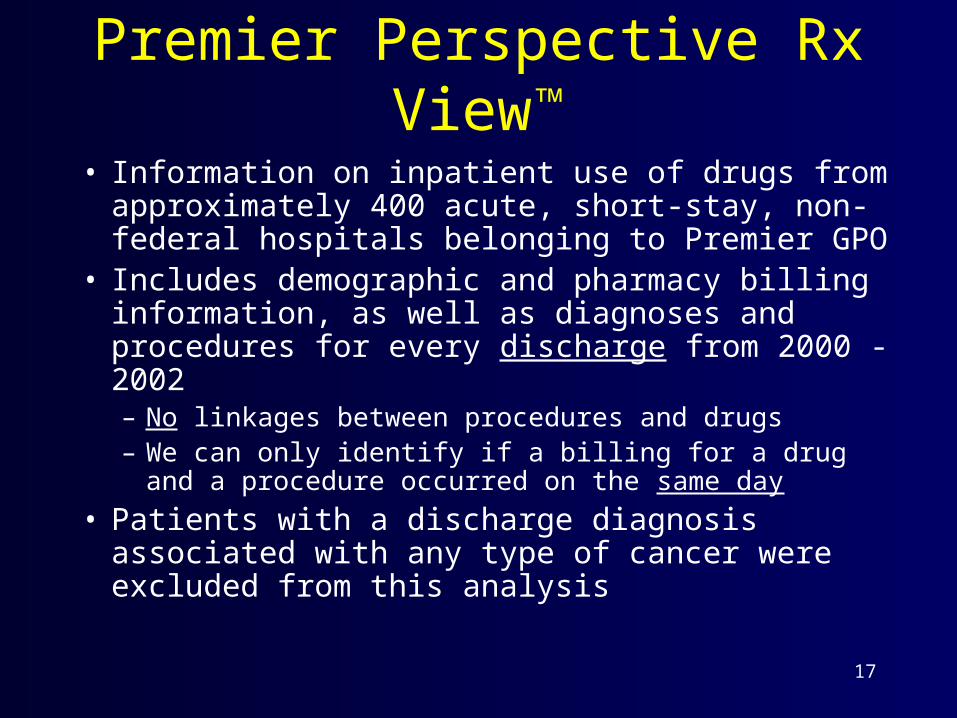
Premier Perspective Rx View
• Information on inpatient use of drugs from approximately 400 acute, short-stay, non-federal hospitals belonging to Premier GPO
• Includes demographic and pharmacy billing information, as well as diagnoses and procedures for every discharge from 2000 - 2002 – No linkages between procedures and drugs– We can only identify if a billing for a drug and a
procedure occurred on the same day
• Patients with a discharge diagnosis associated with any type of cancer were excluded from this analysis

18
% of All Surgical Procedures* Associated with a Modified-Release Opioid Billed the Day of or
Day After Surgery
50%
34%
12%
4%
48%
39%
9%
4%
47%
37%
11%
5%
0%
10%
20%
30%
40%
50%
60%
70%
80%
90%
100%
% o
f Su
rgic
al P
roce
dure
s
2000 2001 2002
Year
Morphine
Fentanyl
Oxycodone
No Modified-Release Opioid
* Source: Premier, Inc., Perspective Rx ViewTM, Excludes Discharge Diagnoses of Neoplasms, Extracted August 2003.
N = 39,896 Surgeries N = 59,966 SurgeriesN = 62,516 Surgeries

19
% of the Top 3 Surgical Procedures* Associated with a Modified-Release Opioid Billed the Day of
or Day After Surgery
58%
42%
36%
62%
49%
35%
64%
50%
35%
0%
10%
20%
30%
40%
50%
60%
70%
80%
90%
100%
% o
f Sur
gica
l Pro
cedu
res
2000 2001 2002
Year
MusculoskeletalOperations
GenitourinaryOperations
DigestiveOperations
* Source: Premier, Inc., Perspective Rx ViewTM, Excludes Discharge Diagnoses of Neoplasms, Extracted August 2003.
N = 277 Hospitals N = 402 HospitalsN = 406 Hospitals

20
Limitations• Outpatient Drug Use Data
– Data on dispensed prescriptions include prescriptions filled in the retail pharmacy setting only
• Mail order pharmacy, long-term care & methadone maintenance clinics are not included
– Data on indications for opiate use reflect office-based physicians’ prescribing based on a small sample of physicians
• Inpatient Drug Use Data– Billing of medications/procedures as proxy
for actual clinical care may be imprecise– Represents only patients admitted in to the
hospital that have a surgical procedure

21
Conclusions• Use of opioids appears to be increasing in
outpatient settings and is widespread in inpatient settings
• Primary care providers continue to be the leading prescribers of opioids in the outpatient setting
• Indications for the outpatient use of opioids– Immediate-release opioids (WITHOUT hydrocodone & oxycodone
combination products)
• Other Pain Cancer-Related Pain– Modified-release opioids
• Cancer-Related Pain Musculoskeletal Pain
• Post-operative indications for the inpatient use of opioids – Apparent substantial use of modified-release opioids for
post-op musculoskeletal procedures• Modified-release oxycodone constitutes most of this use