1 don’t blame the driver: a systems analysis of the causes ... · 136 most detailed publicly...
TRANSCRIPT

Don’t blame the driver: A systems analysis of the causes of road freight crashes 1
2
Sharon Newnam1 3
Natassia Goode2 4
1 Monash University Accident Research Centre, Monash Injury Research Institute, 5
Building 70, Monash University, VIC 3800, Australia 6
2 University of the Sunshine Coast Accident Research, University of the Sunshine 7
Coast, Locked Bag 4, Maroochydore DC, QLD 4558, Australia 8
9
Corresponding Author 10
Sharon Newnam 11
Monash Injury Research Institute 12
Building 70, Monash University, VIC 3800 13
Telephone: +61 (0) 3 9905 4370 14
Email: [email protected] 15
16
17
18
19

Abstract 20
Although many have advocated a systems approach in road transportation, this view has not 21
meaningfully penetrated road safety research, practice or policy. In this study, a systems 22
theory-based approach, Rasmussens’s (1997) risk management framework and associated 23
Accimap technique, is applied to the analysis of road freight transportation crashes. Twenty-24
seven highway crash investigation reports were downloaded from the National Transport 25
Safety Bureau website. Thematic analysis was used to identify the complex system of 26
contributory factors, and relationships, identified within the reports. The Accimap technique 27
was then used to represent the linkages and dependencies within and across system levels in 28
the road freight transportation industry and to identify common factors and interactions 29
across multiple crashes. The results demonstrate how a systems approach can increase 30
knowledge in this safety critical domain, while the findings can be used to guide prevention 31
efforts and the development of system-based investigation processes for the heavy vehicle 32
industry. A research agenda for developing an investigation technique to better support the 33
application of the Accimap technique by practitioners in road freight transportation industry 34
is proposed. 35
36
Keywords: road freight transportation, systems theory, safety, heavy vehicles. 37
38

Introduction 39
Safety in road freight transportation represents a long standing public health problem 40
(e.g. Friswell & Williamson, 2010; Smith & Williams, 2014; Torregroza-Vargas et al., 2014). 41
For example, in the United Stated, 8% of all road deaths have been attributed to heavy 42
vehicle crashes (Kanazawa et al., 2006), whereas in Australia, heavy vehicle driving is 43
considered to be one of the most dangerous occupations (SafeWork Australia., 2011; 44
Transport Workers' Union of Australia, 2011), representing 16% of total road fatalities 45
(BITRE, 2013). These figures are not surprising given that the work environment predisposes 46
professional heavy-vehicle drivers to a number of unsafe working conditions, including a 47
high level of exposure to the road environment and tight delivery schedules (Thompson & 48
Stevenson, 2014). 49
Despite acknowledgement of the challenging working conditions, investigations of 50
heavy vehicle crashes have primarily adopted a reductionist approach focussed on identifying 51
unsafe driver behaviours, such as inappropriate speed (e.g. Brodie et al., 2009; Chang & 52
Mannering, 1999), fatigue (e.g. Arnold et al., 1997; Feyer, Williamson, & Friswell, 1997; 53
Häkkänen & Summala, 2001; Stevenson et al., 2013) and drug use (e.g. Brodie et al., 2009; 54
Brooks, 2002; Duke et al, 2010; Häkkänen & Summala, 2001; Raftery et al., 2011; 55
Williamson, 2007). While this research has informed the development of targeted preventive 56
strategies, this approach implies that drivers are to “blame” for road freight transportation 57
crashes. The complex system of factors that interact to generate hazardous situations and 58
unsafe driver behaviours has largely been ignored (Salmon & Lenné, in press; Thompson & 59
Stevenson, 2014; Williamson et al., 1996). This reductionist, driver focussed approach to 60
road safety has been criticised as one of the barriers preventing the achievement of further 61
reductions in road trauma (e.g. Salmon & Lenné, in press; Salmon et al., 2012). 62

Road freight transportation is no different to any other transport system in that it has 63
the characteristics of a complex sociotechnical system. To illustrate this system, a crash 64
caused by fatigue might not only reflect the individual driver’s disregard of fatigue 65
management policies and procedures (eg., inadequate rest breaks), but also the supervisor’s 66
lack of involvement in journey management (ie., lack of involvement/approval of trip plan), 67
or the type of compensation method used by the organisation to align performance objectives 68
(i.e., deliveries made, tonnage hauled, or km driven) to driver payments. Moreover, the 69
supervisor may be restricted in their level of involvement through their own workload, 70
company policies, and pressures from higher up in the organization and so on. Finally, the 71
company themselves will be influenced by financial and production pressures along with 72
regulatory frameworks. In this sense, the road freight transportation system is representative 73
of a complex sociotechnical system (Rasmussen, 1997; Reason et al., 1990). 74
According to Salmon et al. (2012) a paradigm shift toward complexity and system 75
thinking is required in road transportation more generally. Road transportation can be 76
classified as a complex sociotechnical system given that (i) it comprises technical, 77
psychological and social elements, which when combined inform goal directed behaviour (ie., 78
involves delivery of goods, people etc) and (ii) the system is influenced by a high degree of 79
uncertainty and independence, forever evolving in an unpredictable manner, challenging the 80
boundaries of safety. Although many have advocated a systems approach in road 81
transportation, this view has not meaningfully penetrated road safety research, practice or 82
policy (Salmon & Lenné, in press). Salmon & Lenne (in press) identified the lack of 83
appropriate systems thinking based crash analysis systems as one of the key barrier 84
preventing systems thinking applications in road safety. 85
To address this issue, research is needed to capture the complex system of factors 86
influencing road transport crashes, and specifically in the road freight transportation industry. 87

In this study, we present an application of a systems theory-based approach, Rasmussens’s 88
(1997) risk management framework and associated Accimap technique, to the analysis of 89
road freight transportation crashes. 90
Rasmussen’s (1997) risk management framework and Accimap technique 91
Rasmussen’s (1997) risk management framework (see Figure 1) is underpinned by the 92
idea that accidents are caused by: the decisions and actions of all actors within the system 93
(e.g. government departments, regulators, CEOs, managers, supervisors), not just front line 94
workers alone; and multiple contributing factors, not just one bad decision or action. Safety is 95
maintained through a process referred to as ‘vertical integration’, where decisions at higher 96
levels of the system (i.e., government, regulators, company) are reflected in practices 97
occurring at lower levels of the system, while information at lower levels (i.e., work, staff) 98
informs decisions and actions at the higher levels of the hierarchy (Cassano-Piche et al., 2009; 99
Svedung & Rasmussen, 2002). 100
101
102
Figure 1. Rasmussen’s risk management framework (adapted from Rasmussen, 1997). 103
104
Government
Regulators,
Associations
Company
Management
Staff
Work
Hazardous process
Laws
Regulations
Company
Policy
Plans
Action
Public opinionChanging political climate
and public awareness
Changing market
conditions and financial
pressure
Changing competency
levels and education
Fast pace of
technological change

To support the use of the framework for incident analysis, Rasmussen developed the 105
Accimap technique (Rasmussen, 1997; Svedung & Rasmussen, 2002). An Accimap is 106
typically used to graphically represent how the conditions, and decisions and actions of 107
various actors within the system interact with one another to create the incident under 108
analysis. In other words, an Accimap is used to represent the systemic factors leading up to 109
an incident. The Accimap describes the system in question as comprising of six levels 110
(government policy and budgeting; regulatory bodies and associations; local area government 111
planning & budgeting; technical and operational management; physical processes and actor 112
activities; and equipment and surroundings). These levels can be adapted to reflect different 113
situations and domains of interest (Waterson & Jenkins 2010). Factors at each of the levels 114
are identified and linked together based on cause-effect relationships. The Accimap 115
technique has been applied to represent large-scale organisational accidents in multiple 116
domains (e.g. Branford, 2011; Cassano-Piche et al., 2009; Jenkins et al., 2010; Johnson & de 117
Almeida, 2008; Salmon et al., 2014; Salmon et al., 2013; Vicente & Christoffersen, 2006), 118
including freight transport (Salmon et al., 2013) and to multiple incident analyses (Goode et 119
al., 2014; Salmon et al., 2014). Applying the Accimap technique to the analysis of road 120
freight transportation accidents would allow for the identification of causal factors beyond the 121
heavy vehicle driver. As stated by Salmon et al. (2012), applying systems-based accident 122
analysis methods to road transportation “moves road traffic crash analysis from a ‘hunt for 123
the broken component’ to a ‘hunt for the interacting system components’ mentality” (p. 1834). 124
This hunt for the broken component mentality has previously been identified as a key barrier 125
that prevents safety enhancements within complex sociotechnical systems (Dekker, 2011). 126
Rasmussen’s framework makes a series of predictions (ie., described in the discussion 127
section of the paper; Table 1) regarding performance and safety in complex sociotechnical 128
systems. These predictions describe the characteristics of complex socio-technical systems 129

and have previously been used to evaluate the applicability of the framework and the 130
Accimap technique in new domains (e.g. Cassano-Piche et al., 2009; Jenkins et al., 2010; 131
Salmon et al., 2014). There is some evidence that supports the conclusion that the road 132
transportation is a complex socio-technical system (Salmon et al., 2012); thus, Rasmussen’s 133
framework and Accimap technique are appropriate for analysing road freight transportation 134
crashes. In the current study, Rasmussen’s predictions will be used to evaluate whether the 135
most detailed publicly available data on road freight transportation crashes [investigation 136
reports from the National Transport Safety Bureau (NTSB) in the United States], adequately 137
describes all aspects of road freight transportation system performance. That is, whether the 138
current investigation process supports the application of systems accident analysis methods in 139
this domain. 140
In summary, this study will apply the Accimap technique to represent the complex 141
system of contributory factors identified across multiple NTSB road freight transportation 142
crash investigation reports. This approach will allow us to start to analyse and explain the 143
linkages and dependencies within and across system levels in the road freight transportation 144
industry and identify common factors and interactions across organisations. A secondary aim 145
is to evaluate the suitability of the NTSB investigation process for supporting systems 146
accident analysis using Rasmussen’s predictions regarding performance and safety in 147
complex sociotechnical systems (as described in Table 1). 148
Method 149
The study was given an ethics exemption by the Monash University’s Human Ethics 150
Committee. 151
Applying Rasmussen’s approach to road freight transportation crashes 152
Accimap will be used to represent the contributory factors identified in road freight 153
transportation crash investigation reports sourced from the National Transport Safety Bureau 154

(NTSB) in the United States. The NTSB is an independent Federal agency charged by 155
Congress with investigating significant transportation incidents, including highway, rail, 156
marine and pipeline. In highway incident investigations, the Board conducts independent 157
investigations with the role of identifying the probable causes of highway incidents and 158
safety recommendations aimed at preventing future incidents. The findings and 159
recommendations from these investigations are presented in detailed reports which are then 160
published on the NTSB’s website. To enable the Accimap technique to be used in the 161
analysis of these reports, the six systems levels were adapted to reflect road freight 162
transportation. This led to the definition of the following system levels: 163
1. Government policy and budgeting: decisions, actions and legislation relating to road 164
transportation; 165
2. Regulatory bodies: activities, decisions, actions etc made by personnel working for road 166
transportation regulatory bodies, as well as policies and guidelines; 167
3. Other organisations and clients: activities, decisions, actions etc made by commerical 168
organisations that impact on road freight transportation activities, such as clients and 169
other organisations that operate within the road environment; 170
4. Road freight transportation company: activities, decisions, actions, etc made by 171
supervisory and management personnel at the road freight transportation company, as 172
well as company policies, planning and budgeting. Factors at this level typically occur 173
prior to the crash itself but can also include decisions and actions made during, or in 174
response to, the crash. Contributory factors related to policy, planning and budgeting 175
typically occur well before the crash itself, and may even exist years before the crash 176
occurred; 177
5. Drivers and other actors at the scene of the crash: actions and decisions undertaken ‘at the 178
sharp end’ prior to, and during, the crash. This level therefore, describes factors related to 179

actors directly involved in the heavy vehicle operation (e.g. driver of the heavy vehicle, 180
co-drivers, passengers and the vehicle convoy) as well as other actors at the scene of the 181
crash (e.g. other drivers, enforcement, road and rail work crews); and, 182
6. Equipment, environment and meteorological conditions: This level describes 183
contributory factors associated with the vehicle and equipment (eg., in-vehicle telemetry), 184
the physical road environment (eg., road surface conditions), and the ambient and 185
meteorological conditions prior to or during the crash. 186
Data source 187
The full text of all NTSB highway crash reports issued since 1996 are publicly 188
available online. Therefore, the analysis was restricted to reports published from 1996 to 189
2013. Twenty-nine reports within this date range were downloaded from: 190
https://www.ntsb.gov/investigations/reports_highway.html. Reports were selected for 191
analysis if the incident involved a heavy vehicle that was employed for the purpose of road 192
freight transportation. Preliminary reports were excluded from the analysis on the basis that 193
they did not present final findings. Based on these criteria, 27 reports were selected for 194
analysis. 195
Data coding 196
The reports were analysed by three analysts using NVivo 10, which is a qualitative 197
analysis software tool. Coding was conducted over five stages. First, two researchers 198
identified the contributing factors, and the relationships between them, present within each 199
report. The factors and relationships identified had to be explicitly stated within the report (i.e. 200
researchers were not allowed to draw inferences about the existence of factors or 201
relationships between factors, such as work scheduling and fatigue). Second, the factors and 202
relationships were then aggregated using a thematic analysis approach (adapted from Braun 203
& Clarke, 2006). This involved descriptively coding responses into themes to develop a 204

coding template. The coding template was hierarchically structured with two levels: the first 205
level described the actor involved (e.g. the heavy vehicle driver, the State Department of 206
Transportation); and the second level identified the specific issue (e.g. fatigue, 207
communication, policies and procedures). For example, the statement “the NTSB concludes 208
that because he was distracted from the driving task by the use of his cellular telephone at the 209
time of the accident” was coded as the theme “Heavy vehicle driver: distraction due to cell 210
phone use”. Relationships between factors were also coded. For example, “the probable 211
cause of this accident was the driver’s incapacitation, owing to the failure of the medical 212
certification process to detect and remove a medically unfit driver from service” was coded 213
as a relationship between “Medical oversight programs” and “Heavy vehicle driver: Physical 214
or medical condition.” Third, two researchers reviewed the coding template to ensure the 215
themes were distinct from each other. The few disagreements were resolved through 216
consensus discussion. Fourth, the data was then re-coded by two analysts using the final 217
coding template to ensure reliability. Finally, two researchers independently classified the 218
themes according to the adapted Accimap framework and the results were then compared, 219
with the few disagreements resolved through consensus discussion. Frequency counts 220
representing the number of times each theme and relationship appeared across the reports 221
were then performed, and an aggregate Accimap was constructed. 222
The seven predictions of Rasmussen’s (1997) risk management framework were used 223
to evaluate whether the NTSB investigation process adequately describes all aspects of road 224
freight transportation system performance. That is, the representation of contributing factors 225
and associated relationships identified in the data were matched to the theoretical 226
propositions identified in the risk management framework. The Accimap was used to 227
highlight patterns in the data related to the seven predictions (see Figure 2). 228
Results 229

Descriptive analysis 230
There were 27 investigations conducted into crashes involving road freight 231
transportation from 1996 to 2013. An average of 2.07 investigations were conducted per year, 232
with the highest number of incidents investigated in 2004 (n=5). In total, 89 fatalities and 264 233
minor to severe injuries were reported. Across the years of investigation, these figures 234
represent an alarming average of 6.85 fatalities/year and 20.31 minor to severe injuries/year. 235
Multi-vehicle collisions were identified in the investigation reports as being the most 236
common crash type (n=15), with truck tractor–semitrailer combination units representing the 237
most common type of heavy vehicle (n=19). The majority of the crashes described in the 238
reports involved passenger vehicles (n=18), including sedans, sports utility vehicles or vans. 239
Accimap description 240
The median number of themes and relationships identified per investigation report 241
was 12 (range = 3 to 21) and 4 (range = 0 to 8), respectively. Across all reports, the themes 242
most frequently identified were Heavy Vehicle Driver: Sleepiness or fatigue (n=14), Road 243
furniture: lights, bollards, barriers, static signs (n=12) and Heavy Vehicle Driver: Decision 244
making (n=12). 245
A summary of the findings is presented as an aggregate Accimap in Fig. 2. In the 246
following sections, the contributing factors and relationships underpinning each of the themes 247
represented on the Accimap are described in more detail, and presented according to each 248
level of the framework. 249
250

251
Figure 2: Aggregate Accimap of the contributing factor themes, and the relationships 252
between them involved in road freight transportation crashes identified from the NTSB 253
investigation reports. 254
1. Government bodies 255
Twelve reports identified factors at the “government bodies” level. Table 1 shows the 256
contributing factors identified from the NTSB reports underpinning each theme represented 257
at this level on the Accimap. 258
The NTSB reports identified only a few relationships between this level and the lower 259
levels; however, they illustrate the key role that government bodies play in maintaining safety 260
at all other levels within the system. First, DoT’s policies state that it is carrier’s 261
responsibility to identify low overhead clearances along proposed routes. They also allow 262

carrier’s to self-issue permits online for transporting over-sized loads, without any review of 263
the route. The NTSB concluded that this does not motivate carriers to conduct route surveys 264
prior to transporting oversized loads. Second, the NTSB highlighted limitations with DoT’s 265
guidelines for the selection and installation of median barriers for high volume traffic 266
roadways, which impacted on road design. Thirdly, one report highlighted how the DoT 267
failed to include the State Police Department in planning meetings for construction works, 268
even though they were responsible for implementing traffic control plans around the work 269
zone. This led to confusion regarding how responsibilities for traffic control was shared 270
between the highway patrol and the construction company and, subsequently, a poorly 271
controlled work zone. 272
273
Table 1 Frequency of contributing factors identified by the NTSB underpinning each 274
theme represented on the Accimap at the government bodies level. 275
Contributing factors identified by NTSB N
DoT’s decisions and actions
Provision of inappropriate warning signs or the failure to provide warning signs 5
Inadequate traffic control plans 2
Closures of interstate lanes 1
Poor separation between road workers and road users 1
Inadequate treatment of the roads in snow and ice conditions 1
Inadequate roadside inspections 1
DoT’s policies and procedures
Inadequate policies and procedures - warning signs 2
Inadequate policies and procedures - inspections 2
Inadequate policies and procedures - incident management 1

Inadequate policies and procedures - traffic control 1
Inadequate policies and procedures - snow and ice 1
Inadequate policies and procedures - repairs to infrastructure 1
Inadequate policies and procedures - issuing of permits 1
Inadequate policies and procedures - transportation of hazardous materials 1
DoT’s communication
Inadequate information about bridge clearances 1
Poor planning and co-ordination between the department, highway patrol and
construction contractors
1
State Police Department: policies and procedures
Deficiencies in training programs for escorting oversized and super loads 1
Deficiencies in training programs for incident management procedures 1
Deficiencies in training programs for work zone traffic control 1
Department of Public Safety’s policies and procedures
Lack of alignment with state police guidelines on traffic control 1
Department of Public Safety’s decisions and actions
Poor incident control 1
276
2. Regulatory bodies 277
Nine reports identified factors at the “regulatory bodies” level. Table 2 shows the 278
contributing factors identified by the NTSB underpinning each theme represented at this level 279
on the Accimap. 280
Again, the NTSB identified only a few relationships between the “regulatory bodies” 281
level and the lower levels; however they illustrate the direct impact that regulatory bodies 282
have on road freight operational management. Specifically, two reports highlighted how 283

FMCSA inspections failed to detect deficiencies in heavy vehicle companies’ maintenance 284
procedures, which in turn meant that vehicles with poorly adjusted and non-functional brakes 285
were allowed on the road. One report highlighted how FMCSA medical condition guidelines 286
did not provide sufficient guidance on sleep-related disorders; this impacted on the 287
comprehensiveness of the heavy vehicle operators’ medical oversight program, which meant 288
that a driver with a significant sleep-related to disorder was allowed on the road. 289
290
Table 2 Frequency of contributing factors identified by the NTSB underpinning each 291
theme represented on the Accimap at the regulatory bodies level. 292
Contributing factors identified by NTSB N
Federal Motor Carrier Safety Administration decisions and actions
Failures to conduct hours of service compliance reviews 4
Failures to conduct safety audits 1
Failures to reduce operator safety ratings in response to poor performance in hours-of-
service compliance reviews
2
Poor quality compliance reviews 1
Federal motor carrier safety administration policies and procedures
Failure to account for repeated hours-of service and vehicle-related violations in motor
carrier safety fitness ratings
1
Inadequacies in the hours-of-service compliance review procedures for identifying
consistent violators
1
Lack of requirement to use tamperproof driver’s logs 1
Pre-trip inspection procedure guidelines did not include procedures for determining
brake adjustment
1
Lack of guidance in medical condition guidelines regarding the impact of 1

hypothyroidism on fitness to drive
Federal Highway Administration decision and actions
Decision to accept the installation of a barrier system on a slope that did not comply
with the design specifications
1
293
1. Other organisations and clients 294
Four reports identified factors at the “other organisations and clients” level. Table 3 295
shows the contributing factors identified by the NTSB underpinning each theme represented 296
at this level on the Accimap. 297
Four NTSB reports described accidents where the decisions and actions of actors at 298
this level impacted on those at the two lower levels. First, two reports identified flaws in 299
vehicle manufacturers’ maintenance documentation. The poor documentation was directly 300
linked to heavy vehicle company’s brake maintenance practices, which in turn meant that 301
vehicles with poorly adjusted and non-functional brakes were allowed on the road. Second, 302
one report described how a rail company’s poor risk control policies and measures directly 303
contributed to the ignition and spread of the fire next to an interstate highway. Third, another 304
report found that a construction company had failed to establish traffic control plans for a 305
road works operation; this had a direct impact on the traffic control and safety aspects of the 306
work zone operation. 307
308
Table 3 Frequency of contributing factors identified by the NTSB underpinning each 309
theme represented on the Accimap at the “other organisations and clients” level. 310
Contributing factor identified by NTSB N
Vehicle manufacturers
Flaws in maintenance documentation 2

Construction company
Road works operation lacked traffic control plans and a clear establishment of
responsibilities across the parties involved
1
Rail risk policies and control measures
Contributed to ignition of grassfire 1
311
2. Road freight transportation company 312
Eighteen reports identified factors at the “road freight transportation company” level. 313
Table 4 shows the contributing factors identified by the NTSB underpinning themes relating 314
to company management, while Table 5 shows themes relating to the direct supervision of 315
drivers and driving operations. 316
The majority of links identified from factors at this level describe how the 317
management of the road freight transportation company directly contributes to the decisions, 318
actions and condition of the heavy vehicle driver and the vehicle. First, two accidents 319
involving driver sleepiness or fatigue were partially attributed to poorly executed fatigue 320
management programs. Second, one report found that the driver was using his cell phone to 321
communicate with his supervisor at the time of the accident; using cell phones to 322
communicate with drivers throughout the day was normal practice. Third, one report found 323
that training programs lacked information about the hazards associated with railway crossings 324
and oversize/overweight vehicles; this led to a driver becoming trapped on a level crossing. 325
Finally, two reports found that company training programs did not contain information about 326
how to correctly service brakes, which in turn led to inappropriate brake adjustment. 327
328

Table 4 Frequency of contributing factors identified by the NTSB underpinning themes 329
related to company management, which are represented on the Accimap at the “road 330
freight transportation company” level. 331
Contributing factor identified by NTSB N
Fatigue management programs
Poor design and ineffective implementation of the programs (e.g. materials not widely
disseminated)
5
Policies and procedures
Allowing the use of cell phones to communicate with drivers 2
Inappropriate lead distances specified for pilot vehicles 1
No system for monitoring drivers’ hours-of-service in secondary jobs 1
Training
Lack of formal driver training programs 1
A lack of driver task-specific training (e.g. heavy/wide loads, driving conditions,
inspections)
3
Failing to ensure drivers attend refresher training 1
Lack of mechanic training 1
Ineffective driver training 1
Medical oversight programs
Failure to test for sleep-related disorders 1
332
Table 5 Frequency of contributing factors identified by the NTSB underpinning themes 333
related to the direct supervision of drivers and driving operations, which are 334
represented on the Accimap at the “road freight transportation company” level. 335
Contributing factor identified by NTSB N

Oversight of drivers
Lack of monitoring or disregard for compliance with hours of service regulations 4
Poor record keeping 4
Vehicle maintenance
Poor quality maintenance practices 7
Lack of reflective sheeting as required by FMCSA 1
Poor quality maintenance records 1
Medical, drug and alcohol testing
Assigning a driver without performing the appropriate tests 4
Failure of the medical certification process to detect and remove a medically unfit
driver
1
Driver selection
Failure to conduct on-road driving tests 1
Employing drivers with no prior experience with the vehicle type 1
Failure to review driver history 2
Convoy planning 2
Poor planning and coordination between the parties involved in moving oversized
loads
Route planning and communication 3
Selection of inappropriate routes for the transportation of oversized loads
Work scheduling 1
Failure to ensure the vehicle was available for maintenance work
Vehicle load planning 1
Poor load planning impacted on serviceability of the vehicle
336

3. Drivers and other actors at the scene of the accident 337
All reports identified factors at the “drivers and other actors at the scene of the 338
accident” level. Table 6 shows the contributing factors identified by the NTSB that concerned 339
actors that were directly involved in the road freight operation (e.g. driver of the heavy 340
vehicle, co-drivers, pilot drivers). Table 7 shows the contributing factors identified by the 341
NTSB related to other drivers in the road environment, and Table 8 shows those relating to 342
roadside operations. 343
In the NSTB reports, the majority of factors identified at this level link to factors at 344
this same level, specifically describing the immediate conditions that contributed to the driver 345
error involved in the crash. For example, “poor decision-making” is frequently identified as a 346
contributing factor. A number of reports attribute “poor decision-making” to driver fatigue or 347
sleepiness. In turn, driver fatigue or sleepiness is linked to the use of alcohol and drugs, and 348
sleep-related disorders. Another example of driver error that is frequently described in NTSB 349
reports is loss of control of the vehicle. Two reports attribute loss of control to distraction due 350
to cell phone use, and two reports attribute it to a lack of driver experience with the driving 351
conditions. 352
353
Table 6 Frequency of contributing factors identified by the NTSB underpinning themes 354
related to actors directly involved in the road freight operation, which are represented 355
on the Accimap at the “Drivers and other actors at the scene of the accident” level. 356
Contributing factor identified by NTSB N
HV driver: Sleepiness or fatigue
While driving 14
HV driver: Decision-making
Driving into areas of reduced visibility 1

Failure to slow in response to traffic 5
Loading arm positioning 1
Decision not to leave when dispatched 1
Inappropriate decision to cross railway crossing 2
Following distance to pilot vehicle 1
HV driver: Work schedule leading up to the incident
Schedules that violated hours-of-service regulations 5
Insufficient breaks or sleep 6
HV driver: Driver experience/competence
Vehicle control skills 7
Limited experience in operating the heavy vehicle 3
HV driver: Physical or medical condition
Sleep-related disorders 3
Heart conditions 1
Use of prescription medications that induce fatigue 1
Pain due to a physical injury 1
HV driver: Alcohol or drug use
While driving 4
HV driver: Driver knowledge
Poor route knowledge 3
Pre-trip inspection knowledge 1
Vehicle maintenance knowledge 1
HV driver: Distraction due to cell phone use
Use of cell phone while driving 5
Co-drivers : Sleepiness or fatigue

While driving 1
Co-drivers: Work schedule
Insufficient breaks or sleep 1
Pilot driver: convoy communication and decision-making
Routing errors – leading to low bridges 2
Poor communication with the convoy about the route 1
Use of cell phone to communicate with convoy causing distraction 1
357
Table 7 Frequency of contributing factors identified by the NTSB underpinning the 358
theme “other drivers in the road environment”, which is represented on the Accimap at 359
the “drivers and other actors at the scene of the accident” level. 360
Contributing factor identified by NTSB N
Other drivers in the road environment
Poor decision-making 4
Medical conditions 2
Sleepiness or fatigue 1
Distraction caused by passengers 1
Distraction caused by lack of route familiarity 1
Distraction caused by cell phone use 1
361
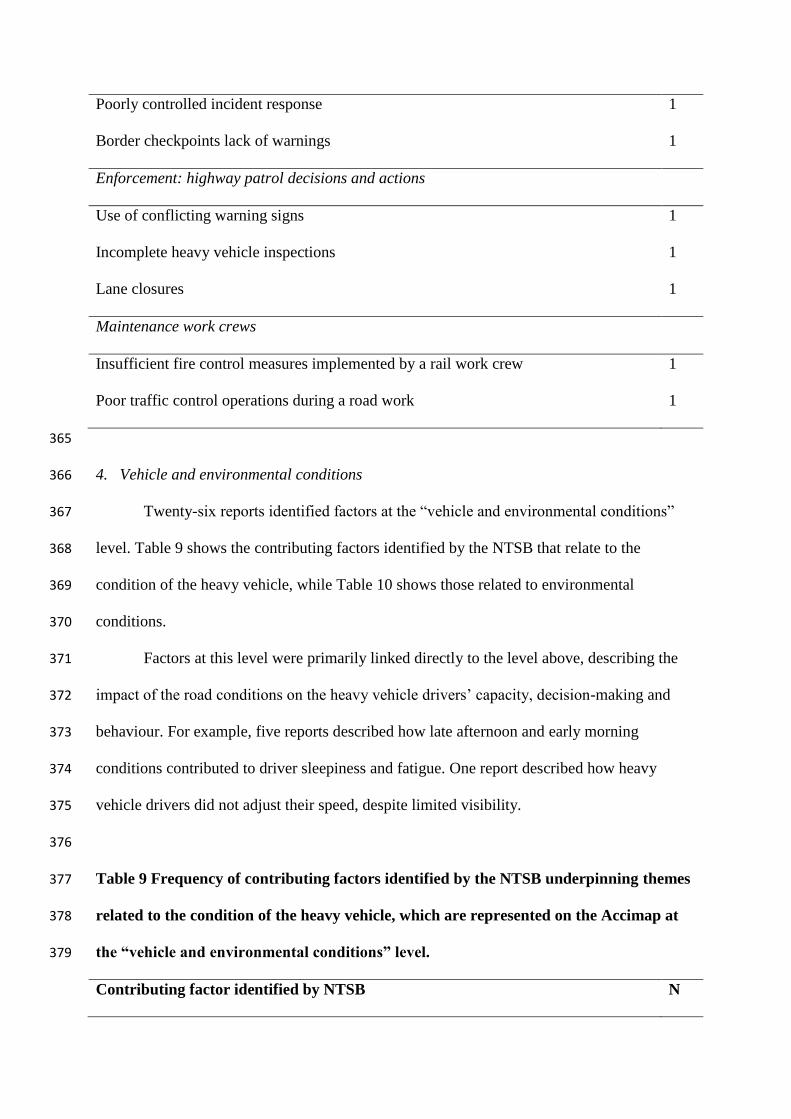
Table 8 Frequency of contributing factors identified by the NTSB underpinning themes 362
related to roadside operations, which are represented on the Accimap at the “drivers 363
and other actors at the scene of the accident” level. 364
Contributing factor identified by NTSB N
Enforcement: State department of safety officers
Poorly controlled incident response 1
Border checkpoints lack of warnings 1
Enforcement: highway patrol decisions and actions
Use of conflicting warning signs 1
Incomplete heavy vehicle inspections 1
Lane closures 1
Maintenance work crews
Insufficient fire control measures implemented by a rail work crew 1
Poor traffic control operations during a road work 1
365
4. Vehicle and environmental conditions 366
Twenty-six reports identified factors at the “vehicle and environmental conditions” 367
level. Table 9 shows the contributing factors identified by the NTSB that relate to the 368
condition of the heavy vehicle, while Table 10 shows those related to environmental 369
conditions. 370
Factors at this level were primarily linked directly to the level above, describing the 371
impact of the road conditions on the heavy vehicle drivers’ capacity, decision-making and 372
behaviour. For example, five reports described how late afternoon and early morning 373
conditions contributed to driver sleepiness and fatigue. One report described how heavy 374
vehicle drivers did not adjust their speed, despite limited visibility. 375
376
Table 9 Frequency of contributing factors identified by the NTSB underpinning themes 377
related to the condition of the heavy vehicle, which are represented on the Accimap at 378
the “vehicle and environmental conditions” level. 379
Contributing factor identified by NTSB N

Serviceability and maintenance
Poorly adjusted and non-functional brakes 6
In-vehicle equipment
Lack of fatigue detection technologies 1
Lack of brake stroke monitoring systems 1
Lack of anti-lock brakes 1
Inappropriate use of cruise control 1
Specifications
Vehicle height 1
Brake specifications 1
Vehicle instability 1
Load
Inappropriate load size for the route 2
Unbalanced loads 1
Warning signals
Lack of lights or indicators 2
380
Table 10 Frequency of contributing factors identified by the NTSB underpinning 381
themes related to environmental conditions, which are represented on the Accimap at 382
the “vehicle and environmental conditions” level. 383
Contributing factor identified by NTSB N
Road furniture
Conflicting or confusing warning signs 3
Lack of warning signs 2

Signs impeding drivers’ perception of other signs 1
Design and placement of barriers 3
Profile of rail crossings 1
Road posts lying on the road 1
Lack of overheard safety lighting 1
Road design
Co-location of rail track and highway 1
Merging of lanes 1
Design of entrance ramps 2
Lack of traffic capacity 2
Intersections between road and rail 1
Traffic conditions
Slowed due to heavy traffic 7
Road works or road closures
Operations infringing on traffic 3
Road closures 2
Road surface conditions
Snow and icy 2
Wet 2
Loose gravel 1
Time of day
Early morning or late afternoon caused sleepiness 6
Weather conditions
High winds 2
Snow and ice 1

Rain 1
Visibility
Absence of natural or artificial light 3
Smoke 1
Vegetation
Lack of surrounding vegetation causing high winds 1
384
Discussion 385
This study aimed to apply Rasmussen’s (1997) risk management framework and 386
Accimap technique to examine the contributory factors identified in twenty-seven road 387
freight transport crash reports. With the exception of the case study that applied the Accimap 388
to represent the causal factors of a crash at a rail level crossing (Salmon et al., 2013), this 389
study is the first to apply the Accimap, and a systems-based framework, to the analysis of 390
multiple road freight transportation crashes. To evaluate where the NTSB investigation 391
process adequately described all aspects of road freight transportation system performance, 392
the Accimap output was compared to a series of predictions which underpin Rasmussen’s 393
risk management framework. These predictions are presented in Table 1, along with 394
supporting evidence from the Accimap analysis. As shown in Table 1, all six out of seven of 395
Rasmussen’s predictions were identified in the present analysis to a certain degree. This 396
finding suggests that although it is reasonably comprehensive, the NTSB investigations 397
process does not fully consider all aspects of system performance. 398
The analysis highlights two key aspects of system performance that the NTSB 399
investigations fail to address. First, the reports did not explicitly identify economic pressures 400
that influenced decisions and actions at the higher levels of the system (ie., regulatory and 401
government bodies). However, it could be speculated that economic pressure on the Federal 402

Motor Carrier Safety Administration was likely the cause of insufficient maintenance 403
inspections of road freight transportation companies. To illustrate this argument, in Australia 404
in 2013, mechanical failure was attributed to a fuel tanker crash and explosion that resulted in 405
two deaths and five serious injuries in Australia. Mechanical operations within the parent 406
organisation were found to be running below accepted levels of safety and formal mechanical 407
safety warnings were issued to over 40% of the fleet. The response to this intervention from a 408
representative of the parent company was that company profits would be negatively affected 409
as would up to 540 jobs (O'Sullivan, 2014). In response to situations such as this, worker 410
representative bodies such as transport unions have advocated additional system regulation to 411
ensure safety standards are met or maintained (Rumar, 1999; Transport Workers' Union of 412
Australia, 2011). This example, in addition to the results of this study, well illustrates how 413
actors at each level of the framework contribute to the systematic degeneration of work 414
practices over time and how a combination of factors (eg., system regulation, economic 415
pressure, HV driver decision making and environmental conditions) can impede safety 416
operational practices. Second, no relationships were identified between driver decision-417
making and factors operating at the upper levels of the framework. The data suggests that 418
driver decision making in these accidents was only influenced by factors occurring at all three 419
lower levels of the framework. 420
421
Table 1: Test of Rasmussen’s predictions in road freight transportation crashes. 422
Predictions Support for prediction
1. Performance is an emergent property of a
complex socio-technical system. It is
impacted by the decisions of all of the
actors—politicians, managers, safety
Factors that shaped the performance of the
HV driver (and other actors involved in the
incident eg., pilot/co-driver) were identified
at all levels of the freight transport system.

officers and work planners—not just the
front-line workers alone
Relationships between factors within and
across all levels of the system were also
identified. Performance was also identified as
an emergent property, as it is characterised
by uncertainty (Newnam & Watson, 2011).
In uncertain contexts, performance is less
predictable as individuals adapt to the
changing demands and conditions. The basic
requirements for driving a vehicle are
arguably predictable. However, as evidence
by the Accimap, performance is influenced
by a combination of factors, which are not
necessarily well managed. For example, the
performance of other actors (eg., co-pilots)
and environmental conditions.
2. Performance is usually caused by multiple
contributing factors, not just a single
catastrophic decision or action
The Accimap shows how multiple
contributing factors across all levels of the
freight transport system were involved in the
crashes examined. Further, the crash reports
identified between 3 and 21 contributory
factors. Many of these factors are also
influenced by other causal factors. For
example, decision-making is influenced by
multiple factors occurring at the scene of the
incident, within road freight transportation

organisations and environmental conditions.
None of the factors were identified, in
isolation, as being independently responsible
for road freight transportation incidents.
3. Deficiencies in performance can result
from a lack of vertical integration (ie.,
mismatches) across levels of a complex
socio-technical system, not just from
deficiencies at any one level alone
The Accimap identifies multiple examples of
non-linear interactions across the different
levels of this complex sociotechnical system.
For example, there was a lack of coodination
between the decisions and actions of the
State Department of Transportation and their
planning and design of road furniture.
4. The lack of vertical integration is caused,
in part, by a lack of feedback across levels
of a complex socio-technical system.
Actors at each level cannot see how their
decisions interact with those made by
actors at other levels, so the threats to
safety are far from obvious before an
accident
The Accimap identifies several examples of
poor feedback across the levels of the freight
transport system. One example is the
ineffective translation of policies and
procedures of the State Department of
Transport on route planning and road design.
The impact of this lack of vertical integration
meant that drivers were using unsafe routes
and roads.
5. Work practices in a complex socio-
technical system are not static. They will
migrate over time under the influence of a
cost gradient driven by financial pressures
in an aggressive competitive environment
The Accimap does not explicitly identify
economic pressures that influenced decisions
and actions at the higher levels of the system
(ie., regulatory and government bodies).

and under the influence of an effort
gradient driven by the psychological
pressure to follow the path of least
resistance
6. The migration of work practices can occur
at multiple levels of a complex socio-
technical system, not just one level alone.
The migration of work practices were
identified at all six levels of the
sociotechnical system. For example,
organisations develop fatigue management
programs. Over time, new drivers do not
receive training in these programs. Another
example relates to the maintenance practices.
When vehicles are replaced, drivers are not
informed that the manual adjustment of
brakes is inappropriate. Over time, the
manual adjustment leads to non-functional
brakes.
7. Migration of work practices causes the
system’s defences to degrade and erode
gradually over time. Performance is
induced by a combination of this
systematically induced migration in work
practices and a triggering event, not by an
unusual action or an entirely new, one-
time threat to safety.
The Accimap illustrates the mechanisms
generating behaviour in this dynamic work
context. Some factors affecting the system
were clearly degenerating systematically over
time. For example, it was clear there was
ineffective policy translation and
communication failure, which impacted the
driving environment, which when combined
with sub-optimal work practices and driver

performance created inadequate responses to
a triggered event (eg., collision) on the road.
423
Despite these gaps in the NTSB investigation process, the results of this study suggest 424
that systems accident analysis methods are required to adequately describe all aspects of road 425
freight transportation system performance. Based on this conclusion, a reductionist view to 426
crash causation is unlikely to inform effective intervention or policy development. The results 427
of this study suggest several intervention opportunities, such as implementing policy and 428
procedures to ban the use of cell phones (hands-free and hands-held), and developing fatigue 429
management programs to reduce sleepiness and fatigue while driving. Consistent with the 430
tenets of Rasmussen’s risk management framework, the findings suggest that these strategies 431
will fail unless actors across the all levels of the system support their implementation. For 432
example, hours-of-service regulation needs to be supported by fatigue management programs, 433
which require consistent management commitment and support to ensure implementation by 434
drivers. One intervention could be focused on the development of policy to prevent driving in 435
high risk hours, which has been suggested to be between midnight and 5:59am (Connor et al., 436
2002; Stevenson et al., 2013). Given that a high proportion (n=8) of the crash reports 437
identified incidents occurring between these hours, it is highly likely that this intervention 438
would directly improve the decision making capabilities of drivers and ultimately reduce 439
crash involvement. Systems thinking suggests that interventions that target higher level 440
system factors, and their interactions, will be more appropriate than the treatment of local 441
factors at the sharp end of system operation (e.g., Rasmussen, 1997; Reason et al., 1990; 442
Salmon et al., 2014). Implementation of intervention should also be considered from a 443
systems perspective. Facilitating links between the employers (organisations), employees 444

(drivers) as well as regulatory policy-makers and researchers is important for enhancing the 445
interface between research and policy and practice in this safety critical domain. 446
A further contribution of this research is that it has provided, for the first time, a 447
systems thinking framework that supports the analysis of road freight transportation crashes. 448
It is the opinion of these authors that the development of a road freight transport specific 449
incident investigation process is required. In the NTSB reports, the role of government 450
departments and regulatory bodies in crashes was typically only considered if they directly 451
impacted on the conditions at the immediate scene of the incident. Only a few reports 452
considered how these agencies impacted on the management of road freight transportation 453
companies. Moreover, the identification of interactions between factors in reports was 454
limited. As discussed above, this information is critical for the development of effective 455
countermeasures. 456
Although some system-based accident investigation processes have been developed in 457
other safety critical domains (Katsakiori et al., 2009), none have been translated for the road 458
freight transportation industry. Existing accident investigation processes also do not consider 459
the impact of regulatory and legislative requirements on operations, as required for systems 460
incident analysis methods, such as Accimap. As evidenced in this paper and the broader 461
literature (e.g. Thompson & Stevenson, 2014; Williamson et al., 1996), this information is a 462
critical consideration in the road freight transportation industry. 463
To guide crash prevention efforts in the road freight transportation industry, a 464
research agenda is proposed for the development of a domain-specific accident investigation 465
and analysis method underpinned by systems thinking. Ideally, this would involve the 466
development of interview schedules, questionnaires, audit checklists etc. to support the 467
collection of appropriate data. In addition, a domain-specific taxonomy would be developed 468
to populate the adapted Accimap framework developed in the current study. This could be 469

used to guide investigations and for classifying the contributing factors and relationships 470
identified. The development of a taxonomy would help ensure that the proposed accident 471
analysis method is reliable, which is crucial if trend analysis is to be performed (Underwood 472
& Waterson, 2013). The methods should then be piloted with key stakeholders within the 473
road freight transportation industry, and refined, to establish usability, reliability and validity. 474
A final stage would involve the implementation of the proposed accident investigation and 475
analysis method. Implementation would potentially generate critical data on the complex 476
system of factors that contribute to road freight transportation crashes, and truly test whether 477
systems thinking can provide new insights into crash prevention efforts in this domain. 478
Limitations 479
As a first of its kind study, there were some limitations worthy of discussion. First, the 480
factors identified by the NTSB investigations are likely to be limited in scope because they 481
are not underpinned by a systems model of incident causation. As a corollary, it is likely there 482
were other factors involved in the crashes analysed, particularly at the upper levels of the 483
freight transportation system not identified in the reports. Investigations based on systems 484
thinking may have revealed a more complex system of factors. Second, the results may have 485
been biased due to the selection of interviewees. It was apparent in the investigation reports 486
that interviews were voluntary, which suggests that some personal perspectives may not have 487
been captured (or underestimated) in the Accimap. Further, the retrospective nature of the 488
data collected suggests that the account of events presented from various parties, including 489
drivers, passengers, witnesses, and family members may have been impacted by recall or a 490
tendency to avoid blame. However, given the causal factors have been supported by the 491
literature (eg., fatigue, cell phone use) bias was unlikely to impact the veracity of the results. 492
Conclusion 493

This paper applied Rasmussen’s (1997) risk management framework and associated 494
Accimap technique tonestablish its applicability for enhancing analysis in the road freight 495
transportation industry. This is the first study that actively ‘moves road traffic crash analysis 496
from a hunt for the broken component to a hunt for the interacting system components 497
mentality” (Salmon et al., 2012). Moreover, a practical contribution is made through the 498
examination of existing investigation methods for their ability to support systems analyses of 499
road freight transportation crashes and in the identification of interventions designed to 500
prevent future crashes. The output from the Accimap demonstrates how a systems approach 501
can increase knowledge in this safety critical domain, while the findings can be used to guide 502
prevention efforts and the development of system-based investigation processes for the heavy 503
vehicle industry. The results of this study will be used to develop a theory based accident 504
investigation process for Australian organisations in the road transport industry. 505
506
References 507
Arnold, P. K., Hartley, L. R., Corry, A., Hochstadt, D., Penna, F., & Feyer, A. M. (1997). 508
Hours of work, and perceptions of fatigue among truck drivers. Accident Analysis & 509
Prevention, 29(4), 471-477. doi: http://dx.doi.org/10.1016/S0001-4575(97)00026-2 510
BITRE. (2013). Road Deaths Australia, 2012 Statistical Summary. Canberra: 511
Commonwealth of Australia. 512
Branford, K. (2011). Seeing the big picture of mishaps: Applying the AcciMap approach to 513
analyze system accidents. Aviation Psychology and Applied Human Factors, 1(1), 31-514
37. 515
Braun, V., & Clarke, V. (2006). Using thematic analysis in psychology. Qualitative Research 516
in Psychology, 3(2), 77-101. doi: 10.1191/1478088706qp063oa 517

Brodie, L., Lyndal, B., & Elias, I. J. (2009). Heavy vehicle driver fatalities: Learning's from 518
fatal road crash investigations in Victoria. Accident Analysis & Prevention, 41(3), 519
557-564. doi: http://dx.doi.org/10.1016/j.aap.2009.02.005 520
Brooks, C. (2002). Speed and heavy vehicle safety. 521
Cassano-Piche, A., Vicente, K., & Jamieson, G. (2009). A test of Rasmussen's risk 522
management framework in the food safety domain: BSE in the UK. Theoretical Issues 523
in Ergonomics Science, 10(4), 283-304. 524
Chang, L.-Y., & Mannering, F. (1999). Analysis of injury severity and vehicle occupancy in 525
truck- and non-truck-involved accidents. Accident Analysis & Prevention, 31(5), 579-526
592. doi: http://dx.doi.org/10.1016/S0001-4575(99)00014-7 527
Connor, J., Norton, R., Ameratunga, S., Robinson, E., Civil, I., Dunn, R., . . . Jackson, R. 528
(2002). Driver sleepiness and risk of serious injury to car occupants: population 529
based case control study (Vol. 324). 530
Dekker, S. (2011). Drift into failure: From hunting broken components to understanding 531
complex systems. U.K: Ashgate. 532
Duke, J., Guest, M., & Boggess, M. (2010). Age-related safety in professional heavy vehicle 533
drivers: A literature review. Accident Analysis & Prevention, 42(2), 364-371. doi: 534
http://dx.doi.org/10.1016/j.aap.2009.09.026 535
Feyer, A. M., Williamson, A., & Friswell, R. (1997). Balancing work and rest to combat 536
driver fatigue: An investigation of two-up driving in Australia. Accident Analysis & 537
Prevention, 29(4), 541-553. doi: http://dx.doi.org/10.1016/S0001-4575(97)00034-1 538
Friswell, R., & Williamson, A. (2010). Work characteristics associated with injury among 539
light/short-haul transport drivers. Accident Analysis & Prevention, 42(6), 2068-2074. 540
doi: http://dx.doi.org/10.1016/j.aap.2010.06.019 541

Goode, N., Salmon, P. M., Lenné, M. G., & Hillard, P. (2014). Systems thinking applied to 542
safety during manual handling tasks in the transport and storage industry. Accident 543
Analysis & Prevention, 68(0), 181-191. doi: 544
http://dx.doi.org/10.1016/j.aap.2013.09.025 545
Häkkänen, H., & Summala, H. (2001). Fatal traffic accidents among trailer truck drivers and 546
accident causes as viewed by other truck drivers. Accident Analysis & Prevention, 547
33(2), 187-196. doi: http://dx.doi.org/10.1016/S0001-4575(00)00030-0 548
Jenkins, D. P., Salmon, P. M., Stanton, N. A., & Walker, G. H. (2010). A systemic approach 549
to accident analysis: A case study of the Stockwell shooting. Ergonomics, 53(1), 1-17. 550
doi: 10.1080/00140130903311625 551
Johnson, C. W., & de Almeida, I. M. (2008). An investigation into the loss of the Brazilian 552
space programme’s launch vehicle VLS-1 V03. Safety Science, 46(1), 38-53. doi: 553
http://dx.doi.org/10.1016/j.ssci.2006.05.007 554
Kanazawa, H., Suzuki, M., Onoda, T., & Yokozawa, N. (2006). Excess workload and sleep-555
related symptoms among commercial long-haul truck drivers. Sleep and Biological 556
Rhythms, 4, 121-128. 557
Katsakiori, P., Sakellaropoulos, G., & Manatakis, E. (2009). Towards an evaluation of 558
accident investigation methods in terms of their alignment with accident causation 559
models. Safety Science, 47(7), 1007-1015. doi: 560
http://dx.doi.org/10.1016/j.ssci.2008.11.002 561
O'Sullivan, M. (2014a). 540 jobs to go as McAleese halves Cootes fuel truck fleet. The 562
Sydney Morning Herald. Retrieved from The Sydney Morning Herald website: 563
http://www.smh.com.au/business/540-jobs-to-go-as-mcaleese-halves-cootes-fuel-564
truck-fleet-20140218-32wyk.html 565

Raftery, S. J., Grigo, J. A., & Woolley, J. E. (2011). Heavy vehicle road safety: A scan of 566
recent literature. Journal of the Australasian College of Road Safety, 22(3), 18-24. 567
Rasmussen, J. (1997). Risk management in a dynamic society: a modelling problem. Safety 568
Science, 27(2–3), 183-213. doi: http://dx.doi.org/10.1016/S0925-7535(97)00052-0 569
Reason, J., Manstead, A., Stradling, S., Baxter, J., & Campbell, K. (1990). Errors and 570
violations: A real distinction? Ergonomics, 33, 1315–1332. 571
Rumar, K. (1999, January 26th, 1999). Transport safety visions, target and strategies: 572
Beyond 2000. Paper presented at the European Transport Safety Lecture, Brussels. 573
SafeWork Australia. (2011). Work-related traumatic injury fatalities, Australia 2008-09: 574
SafeWork Australia. 575
Salmon, P. M., Cornelissen, M., & Trotter, M. J. (2012). Systems-based accident analysis 576
methods: A comparison of Accimap, HFACS, and STAMP. Safety Science, 50(4), 577
1158-1170. doi: http://dx.doi.org/10.1016/j.ssci.2011.11.009 578
Salmon, P. M., Goode, N., Archer, F., Spencer, C., McArdle, D., & McClure, R. J. (2014). A 579
systems approach to examining disaster response: Using Accimap to describe the 580
factors influencing bushfire response. Safety Science, 70(0), 114-122. doi: 581
http://dx.doi.org/10.1016/j.ssci.2014.05.003 582
Salmon, P. M., & Lenné, M. G. (in press). Miles away or just around the corner? Systems 583
thinking in road safety research and practice. Accident Analysis & Prevention(0). doi: 584
http://dx.doi.org/10.1016/j.aap.2014.08.001 585
Salmon, P. M., McClure, R., & Stanton, N. A. (2012). Road transport in drift? Applying 586
contemporary systems thinking to road safety. Safety Science, 50(9), 1829-1838. doi: 587
http://dx.doi.org/10.1016/j.ssci.2012.04.011 588
Salmon, P. M., Read, G. J. M., Stanton, N. A., & Lenné, M. G. (2013). The crash at Kerang: 589
Investigating systemic and psychological factors leading to unintentional non-590

compliance at rail level crossings. Accident Analysis & Prevention, 50(0), 1278-1288. 591
doi: http://dx.doi.org/10.1016/j.aap.2012.09.029 592
Smith, C. K., & Williams, J. (2014). Work related injuries in Washington State's Trucking 593
Industry, by industry sector and occupation. Accident Analysis & Prevention, 65(0), 594
63-71. doi: http://dx.doi.org/10.1016/j.aap.2013.12.012 595
Stevenson, M. R., Elkington, J., Sharwood, L., Meuleners, L., Ivers, R., Boufous, S., . . . 596
Wong, K. (2013). The Role of Sleepiness, Sleep Disorders, and the Work 597
Environment on Heavy-Vehicle Crashes in 2 Australian States. American Journal of 598
Epidemiology. doi: 10.1093/aje/kwt305 599
Svedung, I., & Rasmussen, J. (2002). Graphic representation of accident scenarios: mapping 600
system structure and the causation of accidents. [doi: 10.1016/S0925-7535(00)00036-601
9]. Safety Science, 40(5), 397-417. 602
Thompson, J., & Stevenson, M. (2014). Associations between methods of heavy vehicle 603
driver compensation and fatigue-related driving behaviour. Traffic Injury Prevention, 604
In Press. 605
Torregroza-Vargas, N. M., Bocarejo, J. P., & Ramos-Bonilla, J. P. (2014). Fatigue and 606
crashes: The case of freight transport in Colombia. Accident Analysis & Prevention, 607
72(0), 440-448. doi: http://dx.doi.org/10.1016/j.aap.2014.08.002 608
Transport Workers' Union of Australia. (2011). Make Our Roads Safer For All Australians: 609
Submission to the House Standing Committee on Infrastructure and Communications 610
with regard to the Road Safety Remuneration Bill 2011. Sydney: Transport Workers' 611
Union of Australia. 612
Underwood, P., & Waterson, P. (2013). Systemic accident analysis: Examining the gap 613
between research and practice. Accident Analysis & Prevention, 55(0), 154-164. doi: 614
http://dx.doi.org/10.1016/j.aap.2013.02.041 615
Vicente, K. J., & Christoffersen, K. (2006). The Walkerton E. coli outbreak: a test of 616
Rasmussen's framework for risk management in a dynamic society. Theoretical Issues 617
in Ergonomics Science, 7(2), 93-112. doi: 10.1080/14639220500078153 618
Waterson, P., & Jenkins, D.P. (2010). Methodological considerations in using Accimaps and 619
the Risk Management Framework to analyse large-scale systemic failures. Paper 620
presented at the The 5th IET International System Safety Conference, Manchester, 621
UK. 622
Williamson, A. (2007). Predictors of psychostimulant use by long-distance truck drivers. Am 623
J Epidemiol, 166(11), 1320-1326. 624
Williamson, A., Feyer, A., & Friswell, R. (1996). The impact of work practices on fatigue in 625
long distance truck drivers. Accident Analysis & Prevention, 28(6), 709-719. 626
627
628