1 do we need traffic? traffic? roy kienitz, june 2012
TRANSCRIPT
1
Do We Need
Traffic?Roy Kienitz, June 2012

2
What’s Up With
DRIVING?
1

197019731976197919821985198919921995199820012004200820110
500
1,000
1,500
2,000
2,500
3,000
3,500
Driving In the United States, 1970 to 2004 (Billions of Miles Per Year)

197019731976197919821985198919921995199820012004200820110
500
1,000
1,500
2,000
2,500
3,000
3,500
Driving In the United States, 1970 to 2004 (Billions of Miles Per Year)

5
60 3 6 9 12 15 18 21 24 27 30 33 36 39
0.00
2.00
4.00
6.00
8.00
10.00
12.00
14.00
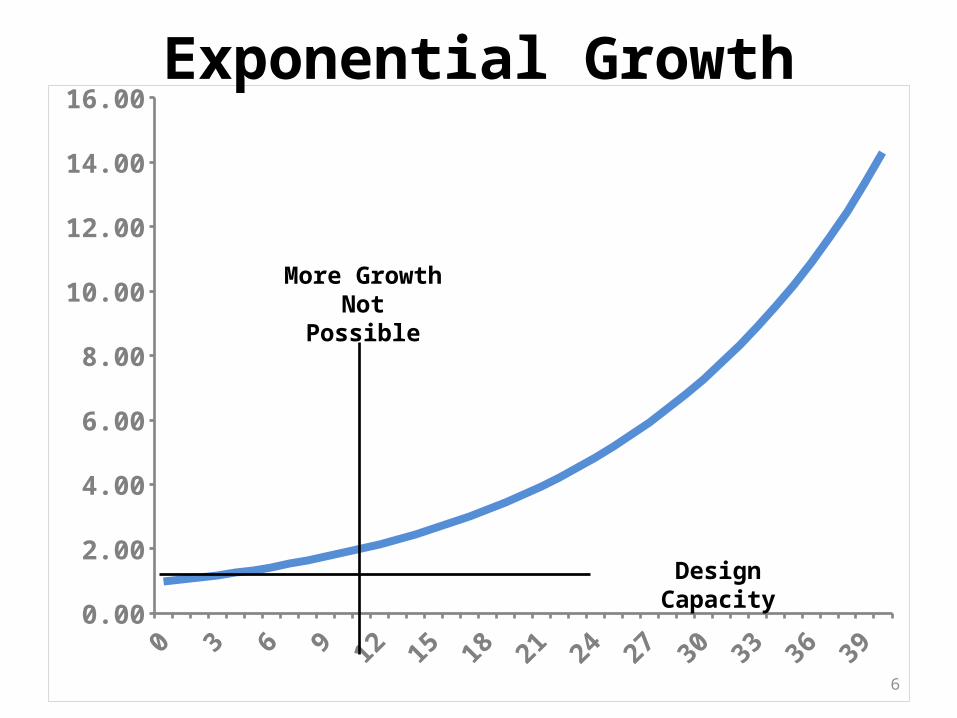
16.00Exponential Growth
Design Capacity
More Growth Not Possible
70 3 6 9 12 15 18 21 24 27 30 33 36 39
0.00
2.00
4.00
6.00
8.00
10.00
12.00
14.00
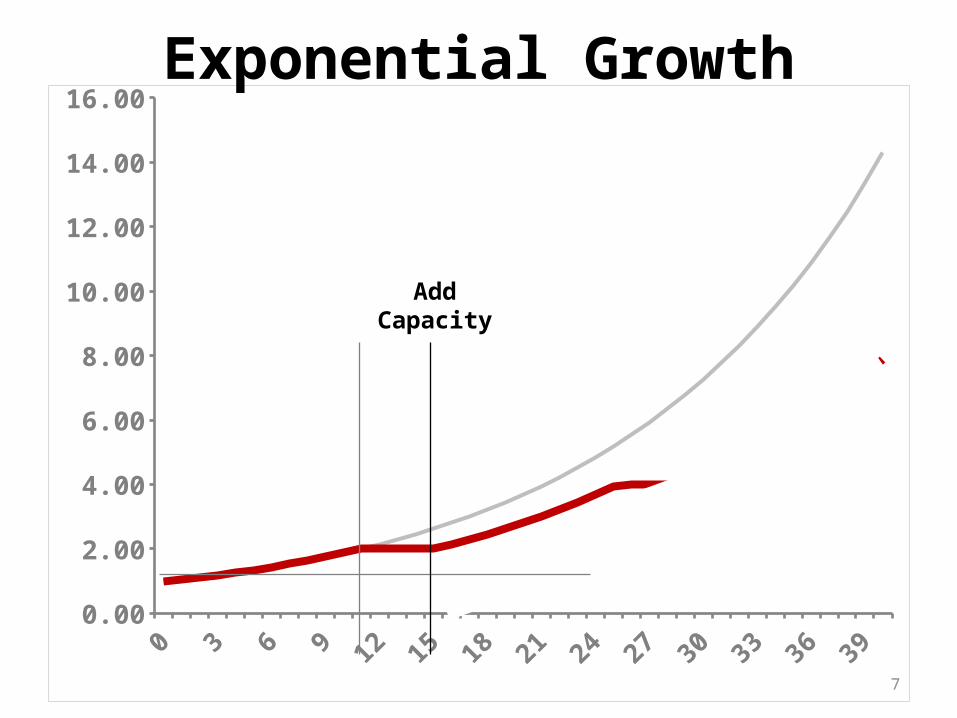
16.00Exponential Growth
Add Capacity

80 3 6 9 12 15 18 21 24 27 30 33 36 39
0.00
2.00
4.00
6.00
8.00
10.00
12.00
14.00
16.00Exponential Growth

90 3 6 9 12 15 18 21 24 27 30 33 36 39
0.00
2.00
4.00
6.00
8.00
10.00
12.00
14.00
16.00Exponential Growth

100 3 6 9 12 15 18 21 24 27 30 33 36 39
0.00
2.00
4.00
6.00
8.00
10.00
12.00
14.00
16.00Exponential Growth

110 3 6 9 12 15 18 21 24 27 30 33 36 39
0.00
2.00
4.00
6.00
8.00
10.00
12.00
14.00
16.00Exponential Growth

120 3 6 9 12 15 18 21 24 27 30 33 36 39
0.00
2.00
4.00
6.00
8.00
10.00
12.00
14.00
16.00Exponential Growth

13
Exponential Growth

14
0
50
100
150
200
250
300
350
GDP (Constant $)
Growth in GDP vs. VMT, 1970 -2004 (1970 = 100)

15
0
50
100
150
200
250
300
350
VMT
GDP (Constant $)
Growth in GDP vs. VMT, 1970 -2004 (1970 = 100)

197019731976197919821985198919921995199820012004200820110
500
1,000
1,500
2,000
2,500
3,000
3,500
Driving In the United States, 1970 to 2004 (Billions of Miles Per Year)

197019731976197919821985198919921995199820012004200820110
500
1,000
1,500
2,000
2,500
3,000
3,500
Driving In the United States, 1970 to 2011 (Billions of Miles Per Year)

197019731976197919821985198919921995199820012004200820110
500
1,000
1,500
2,000
2,500
3,000
3,500
Driving In the United States, 1970 to 2011 (Billions of Miles Per Year)
No net growth For 8 years

4,000
5,000
6,000
7,000
8,000
9,000
10,000
11,000
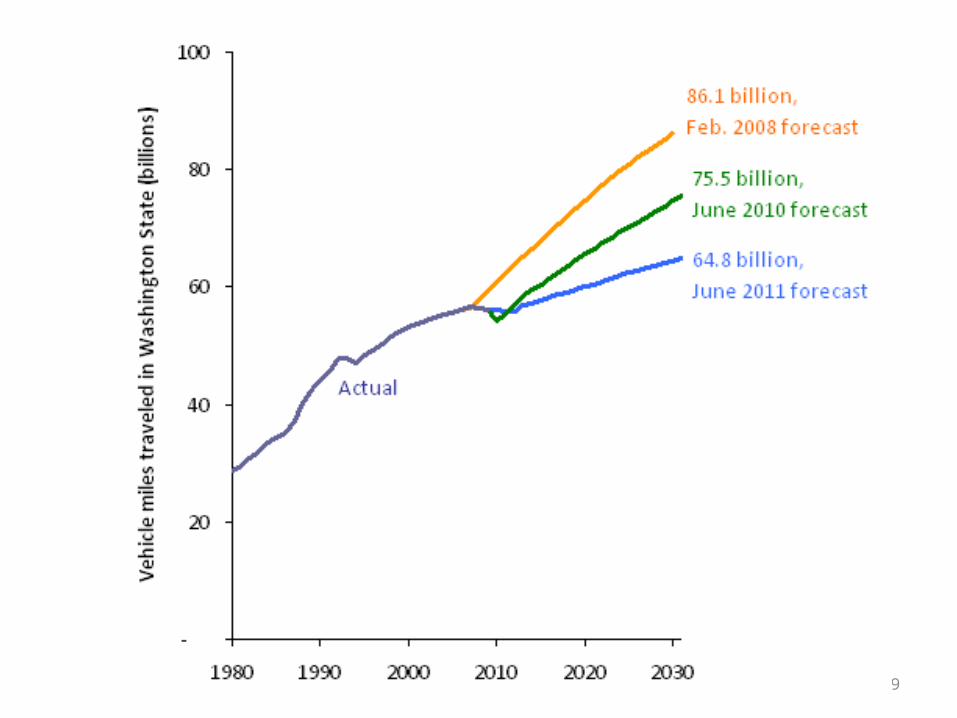
-- Peaked in 2004-- GDP has since grown 8% while VMT per capita fell 6%-- Current level equal to 1997-- Decline not slowing; decrease in 2011 was 2%
Driving Per Person, 1980- 2011

20

2116 17 18 190
10
20
30
40
50
60
70
80
90
100
1983
% of Teenagers With Drivers’ Licenses

2216 17 18 190
10
20
30
40
50
60
70
80
90
100
1983
2008
% of Teenagers With Drivers’ Licenses


Driving Behavior In Germany By Age Group (Km per day)
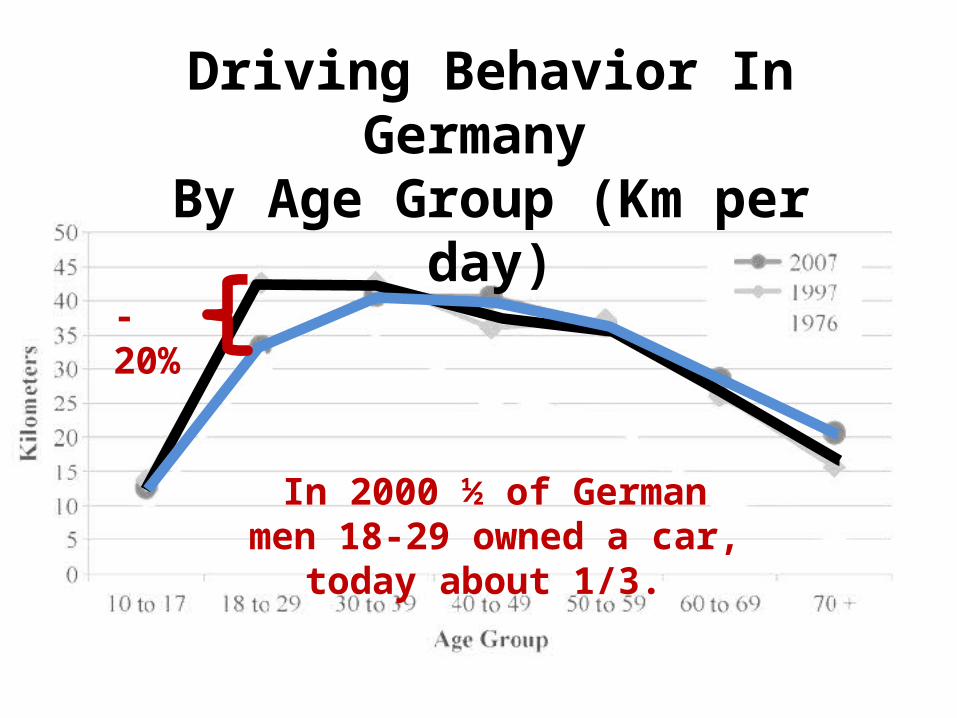
Driving Behavior In Germany By Age Group (Km per day)
-20%
In 2000 ½ of German men 18-29 owned a car, today about 1/3.

27
0
50
100
150
200
250
300
350
VMT
GDP (Constant $)
Growth in GDP vs. VMT, 1970 = 100

28
0
50
100
150
200
250
300
350
VMT
GDP (Constant $)
Growth in GDP vs. VMT, 1970 = 100

29
What Does This Mean
FOR US?
2

30

31
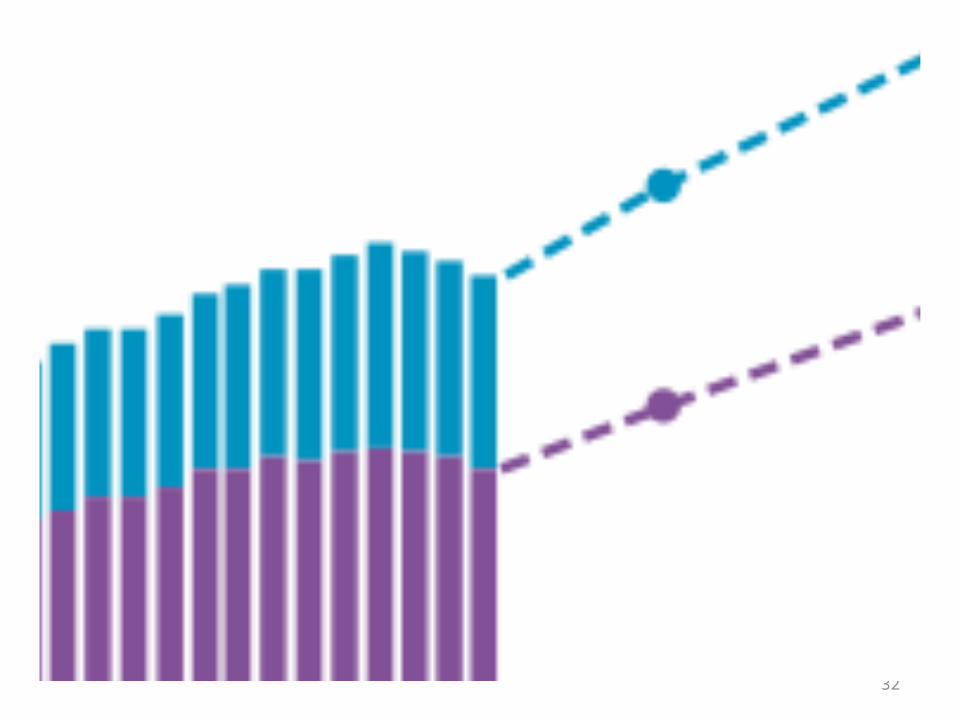
32

33
I-5 Bridge, Columbia River

34

35
SR-520 Bridge, Seattle WA

36

37Tappan Zee Bridge, New York

38
39


42
What About
TRANSIT?
3

43
Transit use crashed after WWII 23 billion in 1945 to 7 billion in 1971

44
A Very Different Story Today
90
100
110
120
130
140
Transit+31%
VMT+18%
Popula-tion+15%

45
60
80
100
120
140
160
180Rail +70%
Bus +9%
Almost all new riders are on rail

46
Transit Use in Germany, By Age Group

-
100,000
200,000
300,000
400,000
500,000
600,000
700,000
800,000
US DOMESTIC AIR TRAVEL, 1960-2000
(Millions of Revenue Passenger Miles)

-
100,000
200,000
300,000
400,000
500,000
600,000
700,000
800,000
US DOMESTIC AIR TRAVEL, 1960-2000
(Millions of Revenue Passenger Miles)

AIRPORT CONSTRUCTION HELPED AIR TRAVEL GROW
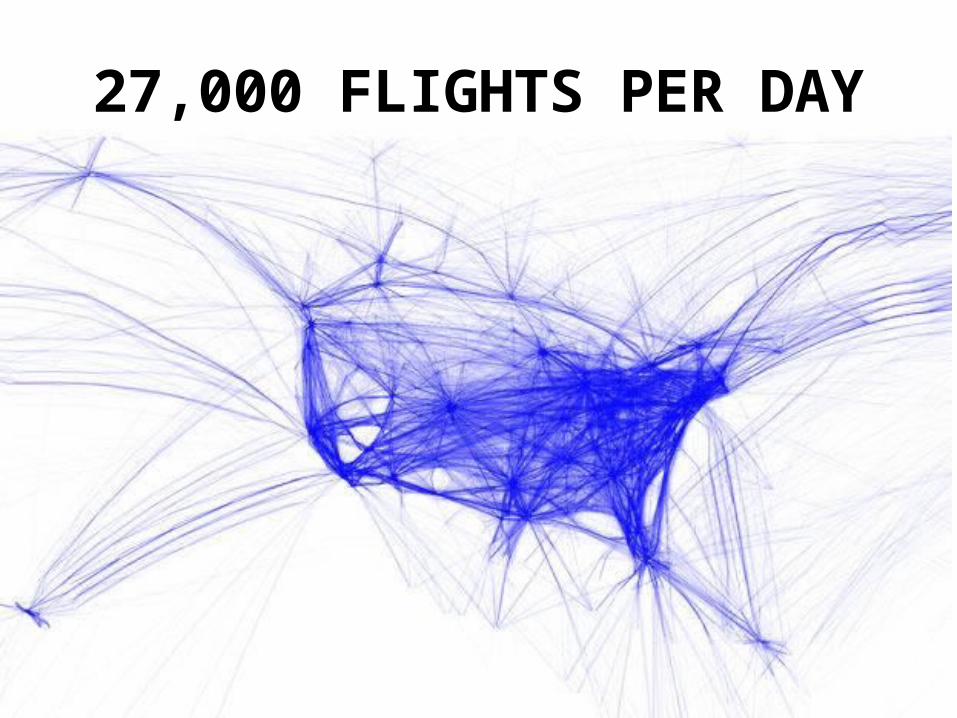
27,000 FLIGHTS PER DAY

-
100,000
200,000
300,000
400,000
500,000
600,000
700,000
800,000
US DOMESTIC AIR TRAVEL, 1960-2000
(Millions of Revenue Passenger Miles)

-
100,000
200,000
300,000
400,000
500,000
600,000
700,000
800,000
US DOMESTIC AIR TRAVEL, 1960-2011
(Millions of Revenue Passenger Miles)

53
Is Government
RESPONDING?
4
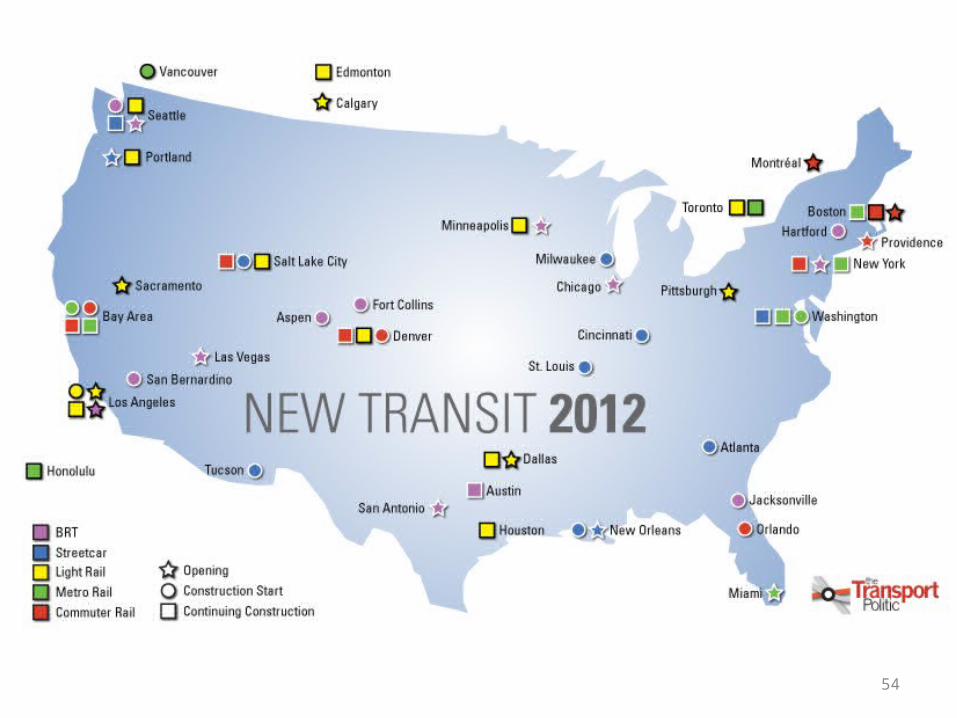
54

HIGH SPEED RAIL INVESTMENT BEGAN IN 2009

56
2000 2001 2002 2003 2004 2005 2006 2007 2008 2009 20100
10
20
30
40
50
60
70
80
90
Complete Streets Policies Adopted Per Year
57

58

More Bicycle Lanes Being BuiltMiles of Protected Bikeway Per 100,000 Residents, 9
U.S. & Canadian Cities, 2000 and 2010
Average Increase of 74% Over 10 Years In These 9 Cities

60
Thank You