1 df en building mat intro - ecoinvent · slide 3 presentation hans-jörg althaus building...
TRANSCRIPT

presentation Hans-Jörg Althausslide 2
Special LCA forum, December 5, 2003EPFL Lausanne / session „building materials“
IntroductionHans-Jörg Althaus
Swiss Federal Laboratories for Material Testing and Research (EMPA)Centre for energy and sustainability (ZEN)

presentation Hans-Jörg Althausslide 3
building materials in ecoinvent
• building materials & -processes
mineral materials, insulation materials, glass, processes,
infrastructure
• wood
sawn timber, wooden boards
• metals
iron / steel, aluminium, other non-iron metals, processing
• plastics
presentation Hans-Jörg Althausslide 4
contributors
• responsible institute: EMPA, Dübendorf
• project leader: Hans-Jörg Althaus
• authors: Daniel Kellenberger, Hans-Jörg Althaus, Frank Werner,
Tina Künniger, Mischa Classen
• contributions from: ESU-services
Niels Jungbluth
• financial support: BUWAL, BBL, ASTRA, EMPA

presentation Hans-Jörg Althausslide 5
Main differences to ÖvE3
• more detailed modelling
• land use
• infrastructure
• multi-output processes
• major methodological changes for wood
presentation Hans-Jörg Althausslide 6
Workshop
• mineral building materials (Daniel Kellenberger)
• wooden materials (Hans-Jörg Althaus)
• comparison steel / wood construction (Daniel Kellenberger)
• discussion

Presentation: Daniel Kellenbergerslide 1
Special LCA forum, December 5, 2003EPFL Lausanne / Session „construction materials“
Mineral Building Materials
Daniel Kellenberger
Swiss Federal Laboratories for Materials Testing and Research (EMPA), Centre for Energy and Sustainability, Dü[email protected]
Presentation: Daniel Kellenbergerslide 2
0 Content
1 Goal2 Selection of the Modules3 Initial Situation4 Procedure und Results based on the Lime Production
Process5 Problems6 Outlook

Presentation: Daniel Kellenbergerslide 3
1 Goal
• No products specific data
• Background data for LCA
• Modelling of the production process as transparent as
possible
• Unit process on the lowest possible level ( easier
implementation of process improvements in future)
Presentation: Daniel Kellenbergerslide 4
2 Selection of the Modules
• Sand/Gravel/Clinker/Cement/Concrete
• Lime Products
• Brick/Tile/Refractory Bricks
• Glass Products
• Insulation Materials
• Gypsum Products
• Plaster and Mortar
• Infrastructure and Auxiliary Products
Data are principally based on existing inventories. If necessary they are
completed, some are added. The main product categories are:

Presentation: Daniel Kellenbergerslide 5
3 Initial Situation
• Scientific Reports: often aggregated data, with another focus (e.g. emissions) or relation to process not clear
• Environmental Reports: often only representation of emissions which must be recorded by law and data which are economically relevant
• Management ratio: only economically relevant data
• Personal Communication: in most cases useful but not comprehensible
• Encyclopaedia: often good description of the product and process but no information on the ecological relevance
• Survey: survey into needed data guarantees highest transparency
Presentation: Daniel Kellenbergerslide 6
4 Procedure and Results
1 Modelling of the production process
2 Analysis of the sub-processes (e.g. mining of limestone)
3 Drawing up a flow chart of the sub-processes
4 Study and illustration of the information
5 Cumulated energy demand and assessment results
Lime Production Process

Presentation: Daniel Kellenbergerslide 7
Mining of Limestone
Quarry of limestone factory KFN (canton GL) Schematic illustration of the mining process of KFN
Mangement ratio of limestone factory KFN to be analyzed.
Presentation: Daniel Kellenbergerslide 8
Production Process, main Products KFN
Calc
ite
in g
roun
d
min
ing
Lim
esto
ne,
at m
ine
Lim
esto
ne,
crus
hed,
w
ashe
d
Qui
cklim
e
Hyd
rate
dlo
ose
Lim
e
crus
hing
, w
ashi
ng
calc
inat
ion
crus
hing
, hy
drat
ing
Hyd
rate
dpa
cked
Lim
e
pack
ing

Presentation: Daniel Kellenbergerslide 9
Flow chart „mining of raw limestone“Remarks to Outputs
Assumptions: half of dust emission as bauxit mining because for 1 kg of bauxit double amount has to be mined (3.2kg / 1000kg bauxit) 5%<2.5um
Assumptions: same dust emission as bauxit mining because for 1 kg of bauxit double amount has to be mined (3.2kg / 1000kg bauxit) 10um>45%>2.5um
Assumptions: same dust emission as bauxit mining because for 1 kg of bauxit double amount has to be mined (3.2kg / 1000kg bauxit) 50%>10um
neglected. asssumed thickness of topsoil layer: 0.3m, density: 1'400 kg/m3, weight per m2: 420kg compared to 160'000kg mined limestone
used for limestone crushed, gravel or brash; amount 2001: 143'888t
used as rocks and boulders; amount 2001: 43'981 t
used for calcination; amount 2001: 193'159 t
Remarks to Inputs
total amount of mined limestone 2001: 381'028 t; the losses by dust emissions have been neglected.
assumption: After 13 years the used land is recultivated
Foot of drilled hole filled with Tovex und shank filled with Amolit
Process of transports and drilling: diesel used by all vehicles in the mine (0.26% of the diesel consumption is used for transports concerning recultivation and included in the module "recultivation"): 191'123 l, with a density of 840 kg/m3 and a net calorific value of 42.8 MJ/kg
includes the total amount of fuel used for heating of mostly administration buildings
Input includes infrastructure needed at mine (buildings, access roads,...) (exclusive building machines); Service life assumption: 50 years, total produced products over 50 years: 19'051'400'000 kg
Input Process Name
Output
Limestone (resource) Dust to air [kg]
land occupation, mine [m2a] Dust to air [kg]
land transformation (to mineral extraxtion site)
Dust to air [kg]
land transformation (from forest)
overburden material (topsoil)
recultivation limestone, to primary crushing plant
blasting [kg explosive]
raw limestone, not in crusher
total machines used in mine for drilling, mining and transports
limestone, to crusher for burning
share of energy consumption for administration
Infrastructure (mine) [unit]
mining of limestone, product:
"limestone, at plant"
Presentation: Daniel Kellenbergerslide 10
Illustration (Allocation and Quantity)
resource land occupation, mineral extraction site 1324 9.78E-05 [Berger, 1992]m2a
resource machinery no GLO diesel, burned in building machine 1350 1.80E-02 data of KFN for the year 2001MJ

Presentation: Daniel Kellenbergerslide 11
• Total mining amount in 65 years: 10‘280‘000 m3
• -> yearly mining amount: 160‘000 m3/a
• Average density: 2‘300 kg/m3 -> 368‘000 t/a
Land-use of limestone mining (KFN)• 5 mining stages in 65 years
• Mining duration per stage about 13 years (followed by a
recultivation of the area)
• Total mining area in 65 years: 156‘000 m2
• -> yearly mining area: 2‘400 m2
• Land-use per kg product: = 9.78E-05 m2aa
kg 368000000a
m 400213a
2′∗
Presentation: Daniel Kellenbergerslide 12
Illustration (Uncertainty)
1 1.05 (1, 2, 1, 1, 1, 1) 5.63E-4 6.26E-4 6.94E-4
Presentation: Daniel Kellenbergerslide 13
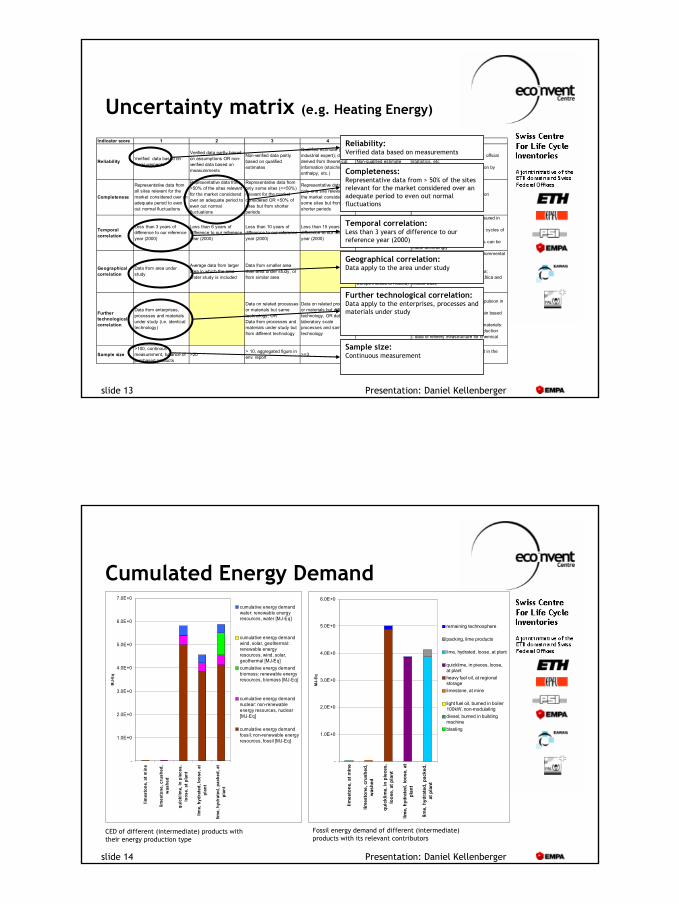
Uncertainty matrix (e.g. Heating Energy)
Indicator score 1 2 3 4 5 Remarks
Reliability Verified data based on measurements
Verified data partly based on assumptions OR non-verified data based on measurements
Non-verified data partly based on qualified estimates
Qualified estimate (e.g. by industrial expert); data derived from theoretical information (stoichiometry, enthalpy, etc.)
Non-qualified estimate
verified means: published in public environmental reports of companies, official statistics, etcunverified means: personal information by letter, fax or e-mail
Completeness
Representative data from all sites relevant for the market considered over an adequate period to even out normal fluctuations
Representative data from >50% of the sites relevant for the market considered over an adequate period to even out normal fluctuations
Representative data from only some sites (<<50%) relevant for the market considered OR >50% of sites but from shorter periods
Representative data from only one site relevant for the market considered OR some sites but from shorter periods
Representativeness unknown or data from a small number of sites AND from shorter periods
Length of adequate period depends on process/technology
Temporal correlation
Less than 3 years of difference to our reference year (2000)
Less than 6 years of difference to our reference year (2000)
Less than 10 years of difference to our reference year (2000)
Less than 15 years of difference to our reference year (2000)
Age of data unknown or more than 15 years of difference to our reference year (2000)
less than 3 years means: data measured in 1997 or later;score for processes with investment cycles of <10 years;for other cases, scoring adjustments can be made accordingly
Geographical correlation
Data from area under study
Average data from larger area in which the area under study is included
Data from smaller area than area under study, or from similar area
Data from unknown OR distinctly different area (north america instead of middle east, OECD-Europe instead of Russia)
Similarity expressed in terms of enviornmental legislation. Suggestion for grouping:North America, Australia;European Union, Japan, South Africa; South America, North and Central Africa and Middle East;Russia, China, Far East Asia
Further technological correlation
Data from enterprises, processes and materials under study (i.e. identical technology)
Data on related processes or materials but same technology, OR Data from processes and materials under study but from different technology
Data on related processes or materials but different technology, OR data on laboratory scale processes and same technology
Data on related processes or materials but on laboratory scale of different technology
Examples for different technology:- steam turbine instead of motor propulsion in ships- emission factor B(a)P for diesel train based on lorry motor dataExamples for related processes or materials:- data for tyles instead of bricks production- data of refinery infrastructure for chemical plants infrastructure
Sample size>100, continous measurement, balance of purchased products
>20> 10, aggregated figure in env. report >=3 unknown
sample size behind a figure reported in the information source
Reliability:Verified data based on measurements
Completeness:Representative data from > 50% of the sites relevant for the market considered over an adequate period to even out normal fluctuations
Temporal correlation:Less than 3 years of difference to our reference year (2000)
Geographical correlation:Data apply to the area under study
Further technological correlation:Data apply to the enterprises, processes and materials under study
Sample size:Continuous measurement
Presentation: Daniel Kellenbergerslide 14
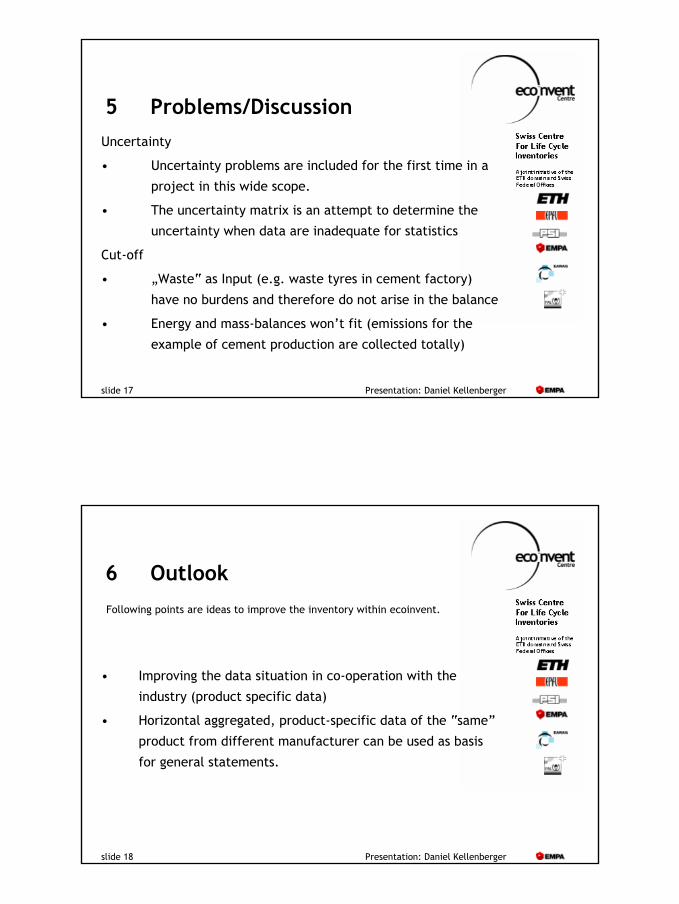
Cumulated Energy Demand
Fossil energy demand of different (intermediate) products with its relevant contributors
-
1.0E+0
2.0E+0
3.0E+0
4.0E+0
5.0E+0
6.0E+0
limes
tone
, at m
ine
limes
tone
, cru
shed
,w
ashe
d
quic
klim
e, in
pie
ces,
loos
e, a
t pla
nt
lime,
hyd
rate
d, lo
ose,
at
plan
t
lime,
hyd
rate
d, p
acke
d,at
pla
nt
MJ-
Eq
remaining technosphere
packing, lime products
lime, hydrated, loose, at plant
quicklime, in pieces, loose,at plantheavy fuel oil, at regionalstoragelimestone, at mine
light fuel oil, burned in boiler100kW, non-modulatingdiesel, burned in buildingmachineblasting
CED of different (intermediate) products with their energy production type
-
1.0E+0
2.0E+0
3.0E+0
4.0E+0
5.0E+0
6.0E+0
7.0E+0
limes
tone
, at m
ine
limes
tone
, cru
shed
,w
ashe
d
quic
klim
e, in
pie
ces,
loos
e, a
t pla
nt
lime,
hyd
rate
d, lo
ose,
at
plan
t
lime,
hyd
rate
d, p
acke
d, a
tpl
ant
MJ-
Eq
cumulative energy demandwater: renewable energyresources, water [MJ-Eq]
cumulative energy demandwind, solar, geothermal:renewable energyresources, wind, solar,geothermal [MJ-Eq]cumulative energy demandbiomass: renewable energyresources, biomass [MJ-Eq]
cumulative energy demandnuclear: non-renewableenergy resources, nuclear[MJ-Eq]
cumulative energy demandfossil: non-renewable energyresources, fossil [MJ-Eq]

Presentation: Daniel Kellenbergerslide 15
Results: GWP und EI 99 (H,A)
Global worming potential (IPCC 2001, GWP 100a)
-2.0E-1
-
2.0E-1
4.0E-1
6.0E-1
8.0E-1
1.0E+0
1.2E+0
limes
tone
, at m
ine
limes
tone
, cru
shed
,w
ashe
d
quic
klim
e, in
pie
ces,
loos
e, a
t pla
nt
lime,
hyd
rate
d, lo
ose,
at
plan
t
lime,
hyd
rate
d, p
acke
d,at
pla
nt
kg C
O2-
Eq
remaining ecosphere
remaining technosphere
Carbon dioxide, fossil to air
packing, lime products
lime, hydrated, loose, atplantquicklime, in pieces, loose,at plantheavy fuel oil, at regionalstoragelimestone, at mine
light fuel oil, burned in boiler100kW, non-modulatingdiesel, burned in buildingmachineblasting
eco-indicator 99 (H,A), total
-
5.0E-2
1.0E-1
1.5E-1
2.0E-1
2.5E-1
limes
tone
, at m
ine
limes
tone
, cru
shed
,w
ashe
d
quic
klim
e, in
pie
ces,
loos
e, a
t pla
nt
lime,
hyd
rate
d, lo
ose,
at p
lant
lime,
hyd
rate
d, p
acke
d,at
pla
nt
Poin
ts
remaining ecosphere
remaining technosphere
Particulates, > 2.5 um, and <10um to airParticulates, > 10 um to air
Particulates, < 2.5 um to air
lime, hydrated, loose, at plant
quicklime, in pieces, loose,at plantheavy fuel oil, at regionalstoragelimestone, crushed, washed
limestone, at mine
Presentation: Daniel Kellenbergerslide 16
Comparison with other source
Comparison of the results from ecoinvent with the results from „Ökologische Bilanzierung von Baustoffen und Gebäuden“ from P. Eyerer and H.-W. Reinhard (*)
0
1
2
3
4
5
6
7
mill
ed q
uick
lime
(from
*)
quic
klim
e, m
illed
, loo
se,
at p
lant
quic
klim
e, in
pie
ces,
loos
e, a
t pla
nt
hydr
ated
lim
e (fr
om *)
hydr
ated
lim
e, lo
ose
primary energy non-renewable (MJ-Eq)
GWP (kg CO2-Eq)
Presentation: Daniel Kellenbergerslide 17
5 Problems/DiscussionUncertainty
• Uncertainty problems are included for the first time in a
project in this wide scope.
• The uncertainty matrix is an attempt to determine the
uncertainty when data are inadequate for statistics
Cut-off
• „Waste“ as Input (e.g. waste tyres in cement factory)
have no burdens and therefore do not arise in the balance
• Energy and mass-balances won’t fit (emissions for the
example of cement production are collected totally)
Presentation: Daniel Kellenbergerslide 18
6 Outlook
• Improving the data situation in co-operation with the
industry (product specific data)
• Horizontal aggregated, product-specific data of the “same”
product from different manufacturer can be used as basis
for general statements.
Following points are ideas to improve the inventory within ecoinvent.

presentation Hans-Jörg Althausslide 1
Special LCA forum, December 5, 2003EPFL Lausanne / session „building materials“
Wooden MaterialsHans-Jörg Althaus
Swiss Federal Laboratories for Material Testing and Research (EMPA)Centre for energy and sustainability (ZEN)
presentation Hans-Jörg Althausslide 2
content
• wooden materials in ecoinvent
• the wood chain in ecoinvent
• data sources
• main differences to ÖvE3
• selected results

presentation Hans-Jörg Althausslide 3
wooden materials in ecoinvent
• direct forest products (round wood, fuel wood)
• sawn timber (boards, air/kiln dried, raw/planed)
• boards from round wood (plywood, laminated board)
• boards from industrial residue wood (OSB, fibre board)
• fuel (chips, pellets)
• chemical wood protection
• auxiliary modules
presentation Hans-Jörg Althausslide 4
wood chain in ecoinventsoftwood,
standing, under
bark, in forest
residual wood,
softwood, under
bark, u=140%,
at forest road
residual wood,
softwood, under
bark, air dried,
u=20%, at forest
road
logs, softwood,
at forest
chopper,
mobile, diesel
wood chopping,
mobile chopper,
in forest
round wood,
softwood,
under bark,
u=70% at forest
road
sawn timber,
softwood, raw,
plant-debarked,
u=70%, at plant
bark chips,
softwood,
u=140%, at plant
industrial residue
wood, softwood,
plant-debarked,
u=70%, at plant
sawn timber,
softwood, raw,
forest-debarked,
u=70%, at plantround wood,
softwood,
debarked,
u=70% at forest
road
industrial residue
wood, softwood,
forest-debarked,
u=70%, at plant
bark chips,
softwood,
u=140%, at
forest road
wood chips,
softwood,
u=140%, at
forest
softwood,
stand
establishment /
tending / site
development,
under bark
softwood,
thinning /
final cutting,
under bark
industrial
wood,
softwood,
under bark,
u=140%, at
forest road
softwood,
standing,
under bark, in
forest
sawing /
debarking,
softwood
sawing,
softwood, forest-
debarked
debarking,
softwood, in
forest

presentation Hans-Jörg Althausslide 5
wood chain in ecoinventwooden board
manufacturing
plant, cement
bonded boards
sawmillwood wool
production,
wood wool, u=20%,
at plantindustrial residue
wood, wood wool
production,
softwood, u=20%,
at plant
sawn timber,
softwood,
planed, kiln
dried, at plant
industrial
residue wood,
softwood, forest-
debarked,
u=70%, at plant
industrial
residue wood,
softwood, forest-
debarked, air
dried, u=20%, at
sawn timber,
softwood, raw,
kiln dried, u=10%,
at plant
industrial
residue wood,
from planing,
softwood, kiln
dried, u=10%, at
sawn timber,
softwood,
planed, air
sawn timber,
softwood, raw,
forest-
debarked,
sawn timber,
softwood, raw, air
dried, u=20%, at
plant
industrial
residue wood,
from planing,
softwood, air
technical wood
drying,
infrastructure
sawn timber,
softwood, raw,
kiln dried, u=20%,
at plantplaning, softwood,
air dried, u=20%
planing mill
wood wool
boards, cement
bonded, at plant
planing, softwood,
kiln dried, u=10%
presentation Hans-Jörg Althausslide 6
wood chain in ecoinvent
glued laminated
timber, indoor
use, at plant
sawn timber,
hardwood, raw,
air dried, u=20%,
at plant
industrial
residue wood,
GLT production,
indoor use,
u=10%, at plant
industrial residue
wood, LTE
production,
softwood, u=20%,
at plant
glued laminated
timber, outdoor
use, at plant
industrial residue
wood, LTE
production,
hardwood, u=20%,
at plant
industrial
residue wood,
GLT production,
outdoor use,
u=10%, at plant
three layered
laminated board,
at plant
industrial residue
wood, 3-layered LB
production,
softwood, u=20%,
at plant
laminated timber
element,
outdoor use,
production
laminated timber
element,
transversally
prestressed, for
outdoor use, at
plantglued laminated
timber, indoor
use, production
wooden board
manufacturing
plant, organic
bonded boards
glued laminated
timber, outdoor
use, production
wooden board
manufacturing
plant, organic
bonded boards
three layered
laminated board,
production
sawn timber,
softwood, raw,
air dried,
u=20%, at plant

presentation Hans-Jörg Althausslide 7
data sources
• forestry processes: Schweinle 2001, Frühwald et al. 1996,
Werner 2002, BFS/BUWAL 2000, Frischknecht et al. 1996,
Bergmair 1996
• sawing planing: Ressel 1986, Hurst 1996, Frühwald et al. 1996
• wooden boards: Frühwald et al. 2000, Werner 1997, Frühwald
et al. 1996, Wegener et al. 1994, Schniewind 1989, Ressel 1986,
diverse Betriebe (pers. Mitteilungen), Nimz 1997
• chips: BFS/BUWAL 2000, Frischknecht et al. 1996
• chemical protection: Künniger et al. 2000, Hillier 1997
• infrastructure: expert guess
presentation Hans-Jörg Althausslide 8
main differences to ÖvE3
• unit: m3 instead of kg dried matter content
• moisture and its influence on density and heating value
considered
• multi output processes (economic allocation except for
resource)
• CO2 uptake as resource from air instead of negative emission

presentation Hans-Jörg Althausslide 9
Moisture, density, upper and lower heating valuedensity:
densities of 450 kg/m3 for softwood und 650 kg/m3 for hardwood
are taken as default.
Theoretical lower heating value for complete incineration:
the lower heating value depends (twice) on the moisture.
upper heating value:
independent on moisture: 20.4 MJ/kg for softwood and 19.6 MJ/kg
for hardwood (per dried matter content)
( )100
*%)0(%)0(% xdensitydensityxdensity +=
xxkgMJkgMJ
kgMJvalueheatingupperkgMJxthvalueheatinglower
+−−
=
100*]/[20]/[32.1
]/[__]/%)[(___
presentation Hans-Jörg Althausslide 10
softwood,
standing, under
bark, in forest
residual wood,
softwood,
under bark,
u=140%, at forest road
industrial
wood,
softwood,
under bark, u=140%, at
forest road
round wood,
softwood,
under bark, u=70% at forest
road
softwood, stand
establishment
/ tending / site
development,
under bark
softwood,
thinning /
final cutting,
under bark
Volume: 11.5%
Allocation: 5%
Volume: 23.5%
Allocation: 9%
Volume: 65.0%
Allocation: 86%
allocationallocationcorrection
0.0715m3
0.16m3
-0.231m3
AC1=(V1/Vtot-AF1)*Vinp*corr. bark

presentation Hans-Jörg Althausslide 11
selected results: plywoodInp ut Pro cess
N ameOut p ut A llo cat io n so urce
al lo cat io nR emarks M ean value U nit So urce mean
valueTyp e St D v
9 5%General
C o mment
Roundwood beech, at forest road (u=70%)
volume including bark is 2.7*1.12 m3
2.70E+00 m3 Plant data Hess & Co. AG Dött ingen
1 1.12 (1,4,2,3,1,1,3)
Urea-formadehyde resin incl. hardener, at plant
8.32E+01 kgPlant data Hess & Co. AG Dött ingen 1 1.12 (1,4,2,3,1,1,3)
Wood chips beech burned in 50kW furnace
8.11E+03 M J Plant data Hess & Co. AG Dött ingen
1 1.12 (1,4,2,3,1,1,1)
Chips -1.92E+00 m3 calculated 1 1.00 calculated
Diesel burned in building machine 3.20E+00 M J Plant data Hess &
Co. AG Dött ingen1 2.01 (1,4,2,3,1,1,5)
Electricity 3.06E+02 kWhPlant data Hess & Co. AG Dött ingen 1 1.12 (1,4,2,3,1,1,2)
Transport lorry Chemicals: 100 km, wood: 50 km
1.57E+02 tkm estimated 1 2.09 (4,5,nA,nA,nA,nA,5)
Transport rail Chemicals: 600 km, wood: 100 km
3.48E+02 tkm estimated 1 2.09 (4,5,nA,nA,nA,nA,5)
Process and cooling water 1.84E+00 m3
Plant data Hess & Co. AG Dött ingen 1 1.12 (1,4,2,3,1,1,4)
plant 3.33E-08 unit estimated 1 3.36 (4,5,2,3,4,5,9)
Hardwood, allocat ion correction 100% to plywood -1.32E+00 m3 calculated 1 1.00
calculated correction term
Hardwood, allocat ion correction Outputs
100% to industrial residual wood 1.32E+00 m3 calculated 1 1.00
calculated correction term
U ncert aint y inf ormat io n
adds / subtracts the amount of CO2 uptake, ressouce consumption and embodied energy that is lacking / too much according to economic allocation. Also adds the 12% bark
Since the fuel for the furnace is included in the input, the corresponding amount inventoried with the energy module is subtracted. Since the volume of the chips is bulked, it is higher then the dif ference of input and output volume.
plyw
ood,
indo
or u
se, p
rodu
ctio
n
General F low inf o rmat io n
outdoor use:
melamine instead of urea-
formaldehyde resin
presentation Hans-Jörg Althausslide 12
selected results: plywood
Inp ut Pro cess N ame
Out put A llo cat io n source al lo cat io n
R emarks M ean value U nit Source mean value
Typ e St D v 9 5%
General C o mment
Inputs Plywood, indoor use, at plant
Industrial wood as result of veneer production (veneer beech around 7'000 CHF/m3 to 10'000 CHF/m3; allocation fact. 1
est imat ion based on price list f rom Heft i & Grob, Niederhasli
1.00E+00 m3
Industrial residual wood beech, at plywood-plant I (u=20%)
60 CHF/Stere; 84 CHF/m3 u.b.; alloc. factor: 0
est imat ion af ter Werner 2002, based on Gautschi 2001 (value increased by 1.61 based on wood with u=140% due to lower water content (after Vhe Nr. 407 (2002))
1.32E+00 m3calculated by balance of dry wood mass
Waste heat into air 1.10E+03 M J calculated 1 1.12 (1,4,2,3,1,1,13)
Formaldehyde into air
8.32E-02 kg Nimz 1997 1 2.81 (4,5,2,5,5,5,23)
Wastewater 1.84E+00 m3 Plant data Hess & Co. AG Dött ingen
1 1.52 (1,4,2,3,1,1,32)
U ncert aint y inf o rmat ionGeneral F lo w inf ormat ion
plyw
ood,
indo
or u
se, p
rodu
ctio
n

presentation Hans-Jörg Althausslide 13
selected results: plywood
-4.0E+3
-3.0E+3
-2.0E+3
-1.0E+3
0
1.0E+3
2.0E+3
3.0E+3
4.0E+3
plywood,indooruse, atplant
plywood,outdooruse, atplant
plywood,indooruse, atplant
plywood,outdooruse, atplant
plywood,indooruse, atplant
plywood,outdooruse, atplant
IPCC 2001 [kg CO2-Äq] ecological scarcity1997 [kUBP]
eco-indicator 99, (H,A)[Dezi-Pt]
Formaldehyde
wooden board manufacturing plant,organic bonded boardstreatment, plywood production effluent,to wastewater treatment, class 3transport, freight, rail
transport, lorry 32t
diesel, burned in building machine
urea formaldehyde resin, at plant
melamine formaldehyde resin, at plant
electricity, medium voltage, productionUCTE, at gridwood chips, from industry, hardwood,burned in furnace 50kWwood chips, hardwood, from industry,u=40%, at planthardwood, allocation correction, 1
round wood, hardwood, under bark,u=70%, at forest road
presentation Hans-Jörg Althausslide 14
plywood, indoor use, at plant: Ecoindicator 99, (H,A)
-10
0
10
20
30
40
50
60
70
80
90
100
landoccupation
climate change respiratoryeffects
fossil fuels others
Pt.
selected results: plywood
9200 m2a forest + 90 m2a forest road
1170 kg biogenic CO2 in wood, 440
kg fossil CO2emitted
170 g formaldehyde (resin and direct)
2.9 kg NOx (energy)1.0 kg SO2 (energy)
energy
530 g particles

presentation Hans-Jörg Althausslide 15
selected results: conclusions
• transparency prerequisite for interpretation
• unit processes
• comparison of different materials (e.g. wood / mineral building
materials) cannot be made based on single score indicators.
inventories are necessary for comparing results

Presentation: Daniel Kellenbergerslide 19
Special LCA forum, December 5, 2003EPFL Lausanne / Session „construction materials“
Comparison of a Steel- with a Wooden Hall
Daniel Kellenberger
Swiss Federal Laboratories for Materials Testing and Research (EMPA), Center for Energy and Sustainability, Dü[email protected]
Presentation: Daniel Kellenbergerslide 20
0 Content
1 Geometry2 Materialization of a steel hall3 Materialization of a wooden hall4 Comparison of the masses5 Comparison of the assessment results
Presentation: Daniel Kellenbergerslide 21
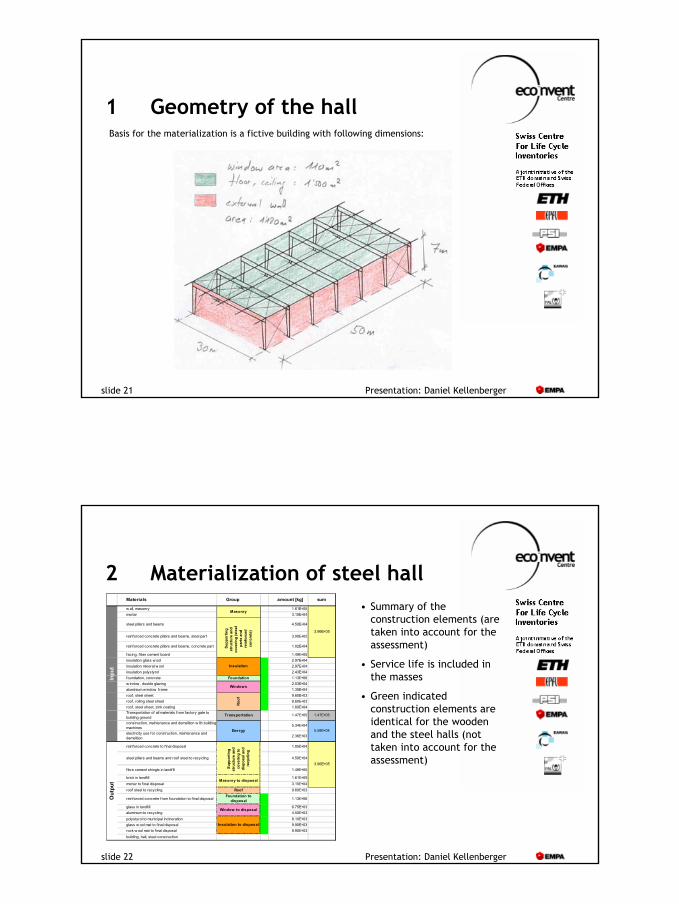
1 Geometry of the hallBasis for the materialization is a fictive building with following dimensions:
Presentation: Daniel Kellenbergerslide 22
2 Materialization of steel hallMaterials Group amount [kg] sum
w all, masonry 1.61E+05mortar 3.15E+04
steel pillars and beams 4.50E+04
reinforced concrete pillars and beams, steel part 3.00E+02
reinforced concrete pillars and beams, concrete part 1.02E+04
facing, f iber cement board 1.49E+05insulation glass w ool 2.97E+04insulation mineral w ool 2.97E+04insulation polystyrol 2.43E+04foundation, concrete Foundation 1.13E+06w indow , double glazing 2.03E+04aluminium w indow frame 1.35E+04roof, steel sheet 9.60E+03roof, rolling steel sheet 9.60E+03roof, steel sheet, zink coating 1.60E+04Transportation of all materials f rom factory gate to building ground Transportation 1.47E+05 1.47E+05
construction, maintenance and demolition w ith building machines 5.34E+04
electricity use for construction, maintenance and demolition 2.36E+03
reinforced concrete to final disposal 1.05E+04
steel pillars and beams and roof steel to recycling 4.50E+04
fibre cement shingle in landfill 1.49E+05
brick in landfill 1.61E+05mortar to f inal disposal 3.15E+04roof steel to recycling Roof 9.60E+03
reinforced concrete from foundation to f inal disposalFoundation to
disposal 1.13E+06
glass in landfill 6.75E+03aluminium to recycling 4.50E+03polystyrol to municipal incineration 8.10E+03glass w ool mat to final disposal 9.90E+03rock w ool mat to final disposal 9.90E+03building, hall, steel construction
3.96E+05
Masonry to disposal
Window to disposal
Insulation to disposal
Supp
ortin
g st
ruct
ure
and
cove
ring
to
disp
osal
and
re
cycl
ing
3.96E+05
Supp
ortin
g st
ruct
ure
and
cove
ring
(ste
el
part
s an
d re
info
rced
co
ncre
te)
Insulation
Windows
Roo
f
Energy 5.58E+04
Inpu
t
Masonry
Out
put
• Summary of the construction elements (are taken into account for the assessment)
• Service life is included in the masses
• Green indicated construction elements are identical for the wooden and the steel halls (not taken into account for the assessment)

Presentation: Daniel Kellenbergerslide 23
3 Materialization of wooden hallprimary beams, glued laminated timber beams 2.22E+04secondary beams, glued laminated timber beams 3.33E+04tertiary beams, structural timber beams 4.32E+04w all: f ramew ork construction 2.16E+04w all: facing (outside) 1.46E+05w all: facing (inside) 6.66E+04w ooden pillars 6.48E+03
steel parts 1.50E+04
rolling of steel parts 1.50E+04
steel parts, zink coating 8.96E+03
insulation glass w ool 2.97E+04insulation mineral w ool 2.97E+04insulation polystyrol 2.43E+04foundation, concrete Foundation 1.13E+06w indow , double glazing 2.03E+04aluminium w indow frame 1.35E+04roof, steel sheet 9.60E+03roof, rolling of steel sheet 9.60E+03roof, steel sheet, zink coating 1.60E+04Transportation f rom factory gate to building ground Transportation 1.48E+05 1.48E+05construction, maintenance and deconstruction w ith building machine 5.34E+04electricity use for construction, maintenance and deconstruction 2.36E+03glued laminated timber to f inal disposal 5.55E+04structural timber to f inal disposal (service life 50 years) 7.13E+04structural timber to f inal disposal (service life 20 years) 1.46E+05particle board to f inal disposal 6.66E+04
steel parts to sorting plantreusage of steel parts 3.00E+04 3.00E+04
roof steel to sorting plant reusage of roof 9.60E+03
reinforced concrete to f inal disposalFoundation to
disposal 1.13E+06
glass in landfill 6.75E+03aluminium to recycling 4.50E+03polystyrol to municipal incineration 8.10E+03glass w ool mat to f inal disposal 9.90E+03rock w ool mat to f inal disposal 9.90E+03building, hall, w ood construction
Supp
ortin
g st
ruct
ure
and
cove
ring
(woo
den
part
s)
Energy
Window to disposal
Insulation
3.39E+05
1.50E+04
5.58E+04
Window
Roo
f
3.39E+05Wood to disposal
Out
put
Insulation
Steel parts (nails, angles,
etc.)
Inpu
t
• Summary of the construction elements (taken into account in the assessment)
• Service life is included in the masses
• Masses of wood are calculated with the corresponding humidity densities
• Green indicated construction elements are identical for the wooden and the steel halls (not taken into account in the assessment)
Presentation: Daniel Kellenbergerslide 24
4 Comparison of the massesmaterial weight for hall (1'500m2)
0.E+00
1.E+02
2.E+02
3.E+02
4.E+02
5.E+02
6.E+02
7.E+02
8.E+02
9.E+02
build
ing,
hal
l, st
eel
cons
truc
tion
build
ing,
hal
l,w
ood
cons
truc
tion
tons
Disposal
Supporting structure and covering; steel part
Supporting structure and covering; woodenpart
Supporting structure, mansonry andcovering (includes: brick, concrete, fibrecement slab and steel)

Presentation: Daniel Kellenbergerslide 25
-400.00
-200.00
0.00
200.00
400.00
600.00
800.00
1000.00
1200.00
building, hall,steel
construction
building, hall,wood
construction
building, hall,steel
construction
building, hall,wood
construction
building, hall,steel
construction
building, hall,wood
construction
Diverse materials
Disposal
Supporting structure and covering; steel part
Supporting structure and covering; wooden part
Supporting structure, mansonry and covering(includes: brick, concrete, fibre cement slab andsteel)
5 Comparison of the assessment results
IPPC, GWP 100a (kg CO2-Eq.)
eco-indicator 99, (H,A) (Dezi-points)
ecological scarcity 1997 (Kilopoints)