1 d-trigger: a general framework for efficient online detection ling huang university of california,...
Post on 22-Dec-2015
214 views
TRANSCRIPT

1
D-Trigger: A General Framework for Efficient
Online Detection
Ling Huang
University of California, Berkeley

Outline Motivation & Introduction My Decentralized Detection Framework Detection of Network-Wide Anomalies
Centralized Algorithm Decentralized Detection
Summary & Future work

[1] Olston et al. Adaptive Filters for continuous queries over distributed data streams. In ACM SIGMOD (2003).
[2] Cormode et al. Sketching Streams Through the Net: Distributed Approximate Query Tracking. In VLDB (2005).
Operation Center
Traditional Distributed Monitoring Large-scale network monitoring and detection systems
Distributed and collaborative monitoring boxes Continuously generating time series data
Existing research focuses on data streaming[1][2]
Centrally collect, store and aggregate network state
Well suited to answeringapproximate queries and continuously recording system state
Incur high overhead!
Monitor 1
Monitor 2
Monitor 3
Local Network 2
Local Network 3
Local Network 1
Bandwidth
Bottleneck! Overloaded!
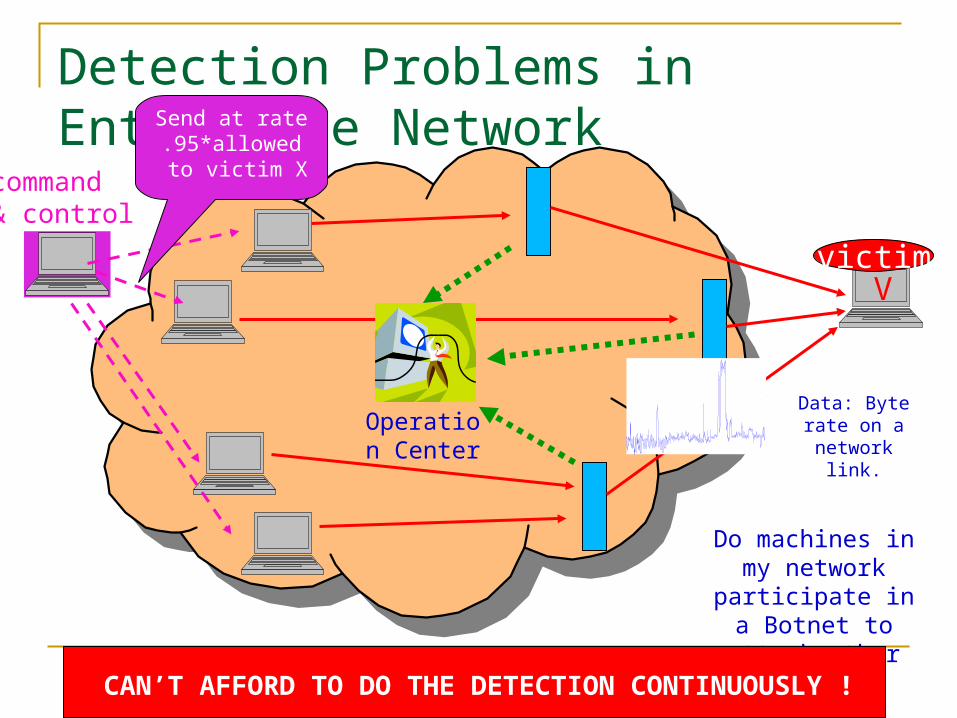
Detection Problems in Enterprise Network
Do machines in my network participate in a Botnet to attack
other machines?
victim
command& control
Send at rate .95*allowed
to victim X
V
Operation Center
Coordinated Detection!
Data: Byte rate on a network
link.
CAN’T AFFORD TO DO THE DETECTION CONTINUOUSLY !

Detection Problems in Enterprise Network
victimV
Operation Center
Data: Byte rate on a network
link.
For efficient and scalable detection, push data processing to the edge of network!
Approximate, decentralized
detection!

Detection Problems in Sensor Network
Is there any vehicle traversing my battlefield?
Need efficient method for continuous, coordinated detection!

Moving Towards Decentralized Detection Today: Distributed Monitoring & Centralized
Computation Stream-based data collection (push) Evaluates sophisticated detection function over periodical
monitoring data Doesn’t scale well in numbers of nodes or to smaller
timescales – high bandwidth and/or central overhead Tomorrow: Distributed Monitoring & Decentralized
Computation Evaluates sophisticated detection function over continuous
monitoring data in a decentralized way Provides low-overhead, rapid response, high accuracy, and
scalability

Outline Motivation & Introduction My Decentralized Detection Framework Detection of Network-Wide Anomalies
Centralized Algorithm Decentralized Detection
Summary & Future work

Research Goals and Achievements Decentralized detection system
Distributed information processing & central decision making Detects violations/anomalies on micro/small timescale Open platform to support a wide-range of applications
General detection functions SUM, MIN, MAX, PCA, SVM, TOP-K,……
Operation on general time series Detection accuracy controllable by a “tuning knob”
Provide user-controllable tradeoff between accuracy and overhead
Communication-efficient Minimize communication at given detection accuracy

The System Setup A set of distributed monitors
Each produces a time series signals Dati(t) Send minimal information to coordinator No communication among monitors
A coordinator X Is aggregation, correlation and
detection center Performs detection X tells monitors the level of
accuracy for signal updates
nmm ,,1

New Ideas for Efficiency and Scalability Local Processing – push tracking capabilities to edges
Monitors do ‘continuous’ monitoring and local processing Use filtering scheme to decide when to push information to
operation center (i.e. only ‘when needed’). Dealing with approximations – algorithms resident at
operation center for doing accurate detection in the face of limited data/information
A framework for putting the above together in a single system
Implemented as protocols that govern actions between monitors and operation center, and manage adaptivity.

Local Processing by Filtering
Filtersx
“push”
Filtersx
adjust
Hosts/Monitors
Operation Center
Don’t send all the data! Don’t need most of them anyway Our applications are anomaly detectors Most of the traffic is normal so don’t need to send. Ideally
hosts should only be sending rare events
DetectionAccuracy

My Decentralized Detection Framework
Dat1(t)
Dat2(t)
Datn(t)
DetectionFunction
PerturbationAnalysis
Feedback:Filter Sizes
original monitored time series Coordinator
Alarms
user inputs: detection error
n ,,1
Distr. Monitors
Mod1(t)
Mod2(t)
Modn(t)Linear
Function
Queue Overflow
Detection
Classificati-on Function
Outlier
Detection

My Dissertation Work: The Components
Decentralized Detection
Linear Functions, Fixed Thresholds
Detection ofCumulative Violations
(ICDCS’07)
Detection of Inst. Violations(MINENET’06)
Sophisticated Detection
Detection of Network-Wide Anomalies
(NIPS’06, INFOCOM’07)
Online Continuous Classification(Ongoing …)
Detection of Cumulative Violations
(ICDCS’07)
Detection of Inst. Violations(MINENET’06)
Detection of Network-Wide Anomalies
(NIPS’06, INFOCOM’07)
Online ContinuousClassification(Ongoing …)
Principal Component
Analysis
Support Vector
Machine
SUM+
Top-K
QueueingModel

Outline Motivation & Introduction My Decentralized Detection Framework Detection of Network-Wide Anomalies
Centralized Algorithm Decentralized Detection
Summary & Future work

Detection of Network-wide Anomalies The anomaly is a sudden change of link
measurement in an Origin-Destination flow Caused by DDoS, device failure, misconfigs, etc.
Given link traffic measurements, detect the volume anomalies
H1
H2
The backbone network
Regional network 1Regional network 2

Observation and correlation across multiple links increases detection capability
Anomalies happen in flows traversing multiple links Capturing spatial correlation across links makes
anomalies stand out Examine the traffic space spanned by all links
Traffic timeseries across different links are highly correlated
Normal traffic can be approximated as occupying a low dimensional subspace
Analysis and detection method is based on Principal Component analysis (PCA)
Detection via Correlation

Traffic on Link 1
Tra
ffic
on
Link
2
Principal Component Analysis (PCA)
y
Anomalous traffic usually results in a large value of
: principal components: minor components
Principal components are top eigenvectors of covariance matrix. They form the subspace projection matrices Cno and Cab

The PCA Method[3][4]
An approach to separate normal from anomalous traffic
Normal Subspace : space spanned by the top k principal components
Anomalous Subspace : space spanned by the remaining components
Then, decompose traffic on all links by projecting onto and to obtain:
Traffic vector of all links at a particular point in time
Normal trafficvector
Residual trafficvector
[3] Lakhina et al. Diagnosing Network-Wide Traffic Anomalies. In ACM SIGCOMM (2004).
[4] Zhang et al. Network Anomography, In IMC (2005).

Detection Illustration
Value ofover time (all traffic)
over time(SPE)
Value of
SPE at anomaly time points clearly stand out
αQ
2
ab
2
ab yCy

Datm
(timestep)
n (nodeID)
Operation center
Y
The Centralized Algorithm
Daton PCA
The Network
Eigen values
αQ
Threshold
Eigen vectors
abC
Projection
Data matrix Dat 1) Each link produces a column of m data over time.
2) n links produces a row data y at each time instance.
α
2
ab QyC
The detection is:
Dat1(t) Dat2(t) Dat3(t) Datn(t)
Periodically
Doesn’t scale well to large network or to smaller timescales The number of monitoring devices
may grow to thousands The anomalies may occur on
second or sub-second time scales

Outline Motivation & Introduction My Decentralized Detection Framework Detection of Network-Wide Anomalies
The Centralized Algorithm The Decentralized Detection
Summary & Future work

My In-Network Detection Framework
Dat1(t)
Dat2(t)
Datn(t)
PCA-BasedDetection
PerturbationAnalysis
Feedback:Filter Sizes
original monitored time series Mod1(t)
Mod2(t)
Modn(t)
Coordinator
Alarms
n ,,1
Distr. Monitorsuser inputs: detection
error

The Protocol At Monitors Each monitor updates information to
coordinator if its incoming signal
where (filtering parameters) are adaptively computed by the coordinator
can be based on any prediction model built by on its data at an update time e.g., the average of last 5 signal values observed
locally at Simple but enough to achieve 10x data reduction
iM
iii tt )(Mod)(Dat *
)(Dat ti
n ,,1
iM
iM
)(Mod *ti*t
)(Mod *t
)(Dat t
iii tt )(Mod)(Dat *
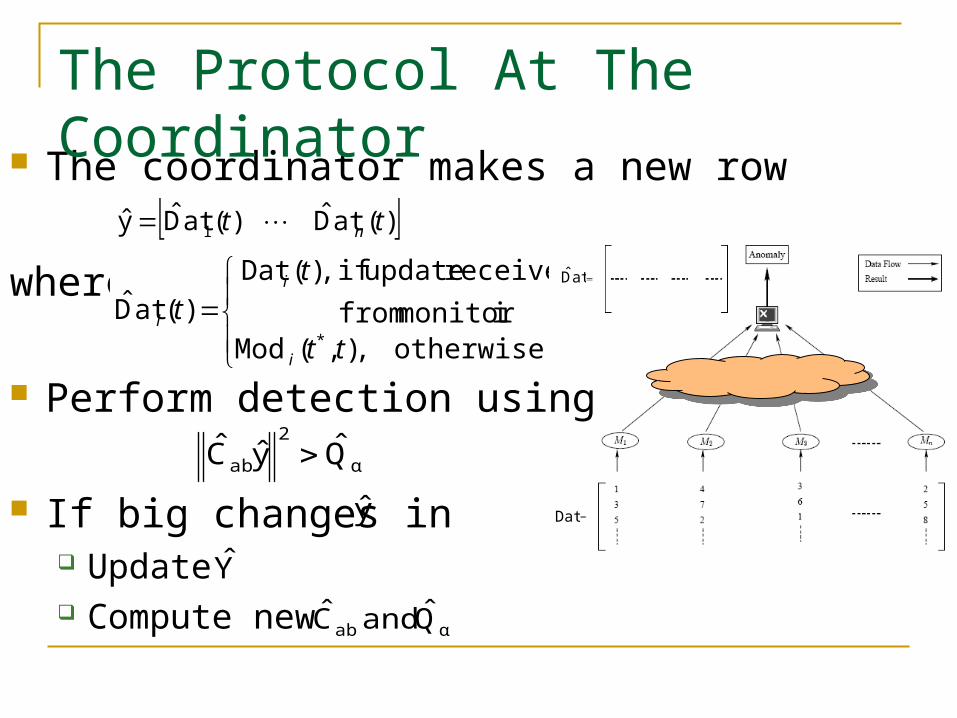
The coordinator makes a new row
where
The Protocol At The Coordinator
otherwise ,),(Mod
imonitor from
received update if ,)(Dat
)(atD* tt
t
t
i
i
i
)(atD)(atDy 1 tt n
Perform detection using
If big changes in Update Compute new
α
2
ab QyC
y
αab Q and C
Y
atD
Dat
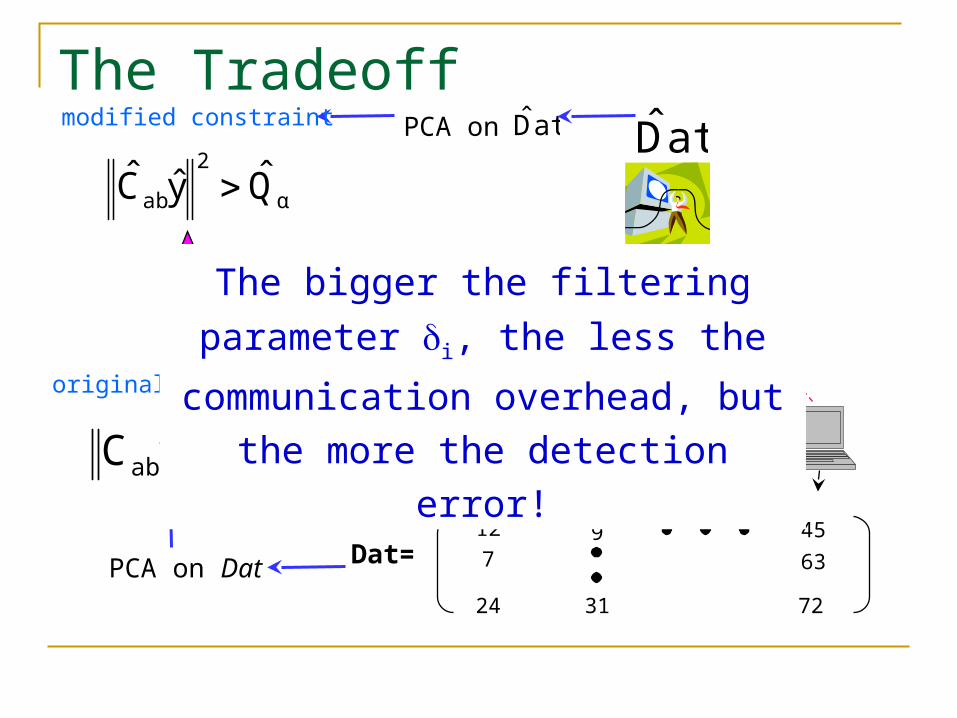
The Tradeoff
α
2
ab QyC
data(t)
12 9 457
24 31
63
72
Dat=
filtered_data(t)
atD
α
2
ab QyC
PCA on Dat
original constraint
PCA on atDmodified constraint
Difference?The bigger the filtering parameter i,
the less the communication
overhead, but the more the detection
error!
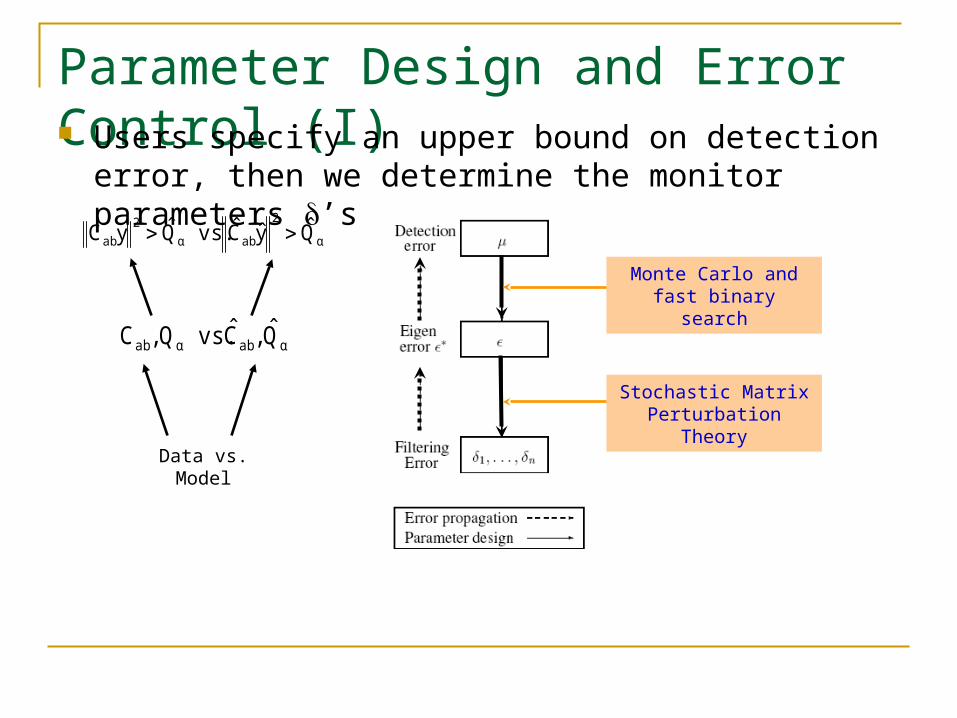
Parameter Design and Error Control (I) Users specify an upper bound on detection error, then
we determine the monitor parameters ’s
α
2
abα
2
ab QyC vs.QyC
αabαab Q ,C vs.Q ,C
Data vs. Model
Monte Carlo and fast binary search
Stochastic Matrix Perturbation Theory

Let and are eigenvalues of the covariance matrices and
Define the perturbation matrix
Define the eigen error
From matrix perturbation theory, we have
So the key point is to estimate in terms of parameters ’s
Parameter Design and Error Control (II)
atDatDm
1A TDatDat
m
1A T

Eigen-Error Monitor Slacks ’s
Where: , , n is number of monitors and m is the number of data points.
The coordinator has all information to compute i’s for all monitors (Huang’06)
3
2i
9
4i
reasonable

Detection Error Eigen-Error Basic idea: study how eigen error impacts
detection error (Huang’07) With full data, false alarm rate is
With approximate data, we only have perturbed version
Given eigen error, we can compute the false alarm rate (though not in closed-form solution) Inverse dependency: given desired false alarm rate, we can
determine tolerable eigen error by fast binary search

Evaluation Given a tolerable deviation of false alarm
rate, we can determine system parameters Using system parameters, we can evaluate
the actual detection accuracy using data- driven emulation
Experiment setup Abilene backbone network data Traffic matrices of size 1008 X 41 Set uniform slack for all monitors

Result
Missed Detections False Alarms Data Reduction
Week 1 Week 2 Week 1 Week 2 Week 1 Week 2
0.01 0 0 0 0 75% 70%
0.03 0 1 1 0 82% 76%
0.06 0 1 0 0 90% 79%
Data Used: Abilene traffic matrix, 2 weeks, 41 links.
error tolerance = upper bound on error vs centralized approach

Outline Motivation & Introduction My Decentralized Detection Framework Detection of Network-Wide Anomalies
The Centralized Algorithm The Decentralized Detection
Summary & Future work

Key Contributions (1/2) Designed decentralized detection systems that
scale well You don’t need all the data! Can do detection with 80+% less than others Enable the detection on very small time scales
Provable mathematical guarantees on errors Detection accuracy is always provable mathematically
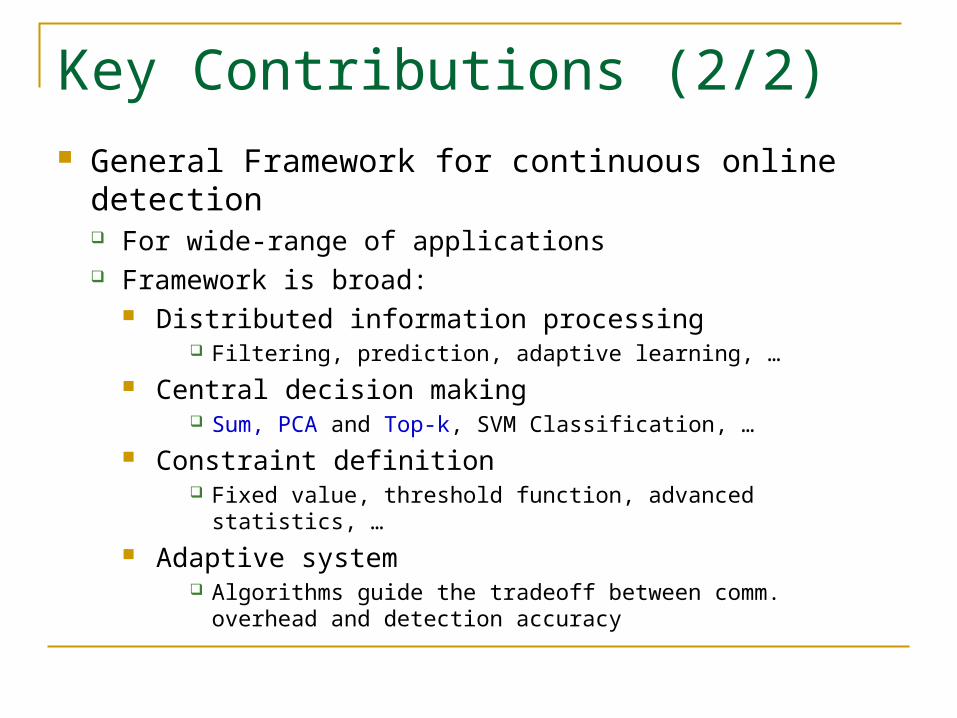
Key Contributions (2/2) General Framework for continuous online detection
For wide-range of applications Framework is broad:
Distributed information processing Filtering, prediction, adaptive learning, …
Central decision making Sum, PCA and Top-k, SVM Classification, …
Constraint definition Fixed value, threshold function, advanced statistics, …
Adaptive system Algorithms guide the tradeoff between comm. overhead and
detection accuracy

Capabilities and Future WorkApplication Constraint Query
Hot-spot detection on
server farm(web, DNS)
On sum of workload or traffic rate
SUM
PCA anomaly detection
On quadratic function of traffic volumes
PCA
SVM classification Online classification
FUTURE
Efficient detection system for operational network
Machine learning in system research
…… ……

My Other Research Work Tapestry: Scalable and Resilient Peer-to-Peer
network infrastructure (JSAC’04) System implementation and wide-area deployment Novel network applications on Tapestry
Efficient mobility via overlay indirection (IPTPS’04 ) Fault-tolerance routing (ICNP’03) Collaborative spam filtering (Middleware’03), Landmark routing on overlay networks (IPTPS’02)

ReferenceReference[Huang’07][Huang’07] Communication-Efficient Tracking of Distributed Cumulative Triggers. Communication-Efficient Tracking of Distributed Cumulative Triggers. L. Huang, M. L. Huang, M. Garofalakis, A. Joseph and N. Taft. To appear in ICDCS’07. Garofalakis, A. Joseph and N. Taft. To appear in ICDCS’07. [Huang’07][Huang’07] Communication-Efficient Online Detection of Network-Wide Anomalies. Communication-Efficient Online Detection of Network-Wide Anomalies. L. Huang, X. L. Huang, X. Nguyen, M. Garofalakis, J. Hellerstein, M. Jordan, A. Joseph and N. Taft. To appear in Nguyen, M. Garofalakis, J. Hellerstein, M. Jordan, A. Joseph and N. Taft. To appear in INFOCOM'07. INFOCOM'07. [Huang’06][Huang’06] In-Network PCA and Anomaly Detection. In-Network PCA and Anomaly Detection. L. Huang, X. Nguyen, M. Garofalakis, M. L. Huang, X. Nguyen, M. Garofalakis, M. Jordan, A. Joseph and N. Taft. In NIPS 19, 2006.Jordan, A. Joseph and N. Taft. In NIPS 19, 2006. [Huang’06][Huang’06] Toward Sophisticated Detection with Distributed Triggers. Toward Sophisticated Detection with Distributed Triggers. L. Huang, M. Garofalakis, L. Huang, M. Garofalakis, A. Joseph and N. Taft. In MineNet 2006. A. Joseph and N. Taft. In MineNet 2006.
Questions

39
Backup Slides

Distributed Trigger Contributions Continuous, online detection and triggering
Provides decentralized data processing and management
Detects and reacts to constraint violations Detects anomalies on micro/small timescale
Practical model for specifying detection accuracy
High performance gain High accuracy with 10x reduction in comm.
overhead

Dealing with approximation Intuition: the operation center has a “approximate”
view of the global data Approximations can lead to errors (false positive/negatives) We want to bound these errors Tradeoff accuracy and communication cost – we make this
tunable Use different statistical analysis tools to explore the
tradeoffs and achieve the bounds Idea: use matrix perturbation theory when global condition is
captured by matrix data Idea: use queueing theory in which queues are used to
measure the size of the “violation”

Efficient Detection of Network-Wide
AnomaliesTrigger an alarm at each time t when
α
2
ab QyC
(NIPS’06, INFOCOM’07)
Statistics Threshold

An Illustration
Observed network link data = aggregate of application-level flows
Each link is a dimension
Unobserved anomalies in flow data
Finding anomalies in high-dimensional, noisy data is difficult !

Efficient Detection of Distributed Cumulative
Violations
Detection of volume-based anomalies; trigger an alarm when overflowsQ
C)(Dat1 t
)(Dat2 t
)(Dat tn
Q
(ICDCS’07)

SumProblem Setup Constraints on aggregate
conditions on subset of nodes Accrue volume penalty when
value exceeds threshold C Fire trigger whenever volume
penalty exceeds error tolerance Aggregate function
Current work supports simple queries Focus on SUM and AVG here Extending to MIN, MAX, TOP-K as ongoing
work Future work to support general and complex functions

Applications Distributed SUM exceeding threshold
Hot-spot detection for server farm Trigger an alarm if any set of 20 servers have workload
more than 80% of the workload of the total 100 servers Botnet detection for enterprise network
Trigger an alarm if the packet rate from all hosts in my network to a destination exceeds 200 MB/second
Cumulative (persistent) violation Sever load are spiky, and it makes more sense to look at
persistent overload over time Network traffic is shaped and routed according to queueing
model In environment monitoring, radiation exposure are
accumulated over time

Problem Statement User Inputs:
Constraint violation threshold: C Tolerable error zone around constraint: Tolerable false alarm rate: Tolerable missed detection rate:
GOAL: fire trigger whenever penalty exceeds error tolerance with required accuracy level AND with minimum communication overhead
(monitor updates)

Let V(t,) be size of penalty, at time t, over past window Instantaneous violation[5][6]
Fixed-window violation
Cumulative violation
C
n
i i t1)(Dat
4
Three Types of Violations
for a any in [1, t]
),(tV
1)(Dat)1,(
1CttV
n
i i
for a user given fixed
dwCwtVt
t
n
ii
1
)(Dat),(
> < >
Key point: One needs to find a special * which maximize V(t, )
1 5
n
ii t
1
)(Dat
[5] Keralapura et al. Communication-efficient distributed monitoring of thresholded counts. In ACM SIGMOD (2006).[6] Sharfman et al. A geometric approach to Monitoring threshold functions over distributed data streams. In ACM SIGMOD (2006).
t
C
C+
>
< >
>

Detection of Cumulative Violation
Key insight: Cumulative trigger is equivalent to a queue overflow problem
The centralized queuing model
rQ
Value, penalty and queue
)(Dat ti
Trigger fires!
1t 2t 3t 4t
dwCwtVt
t
n
ii
1
)(Dat),( ,
Dat1(t)
Dat2(t)
Datn(t)

Outline Motivation & Introduction Detection of Network-Wide Anomalies
The Centralized Algorithm The Decentralized Detection
Detection of Distributed Cumulative Violation The Problem Definition The Decentralized Detection
Summary & Future work
Aggreg./Queueing
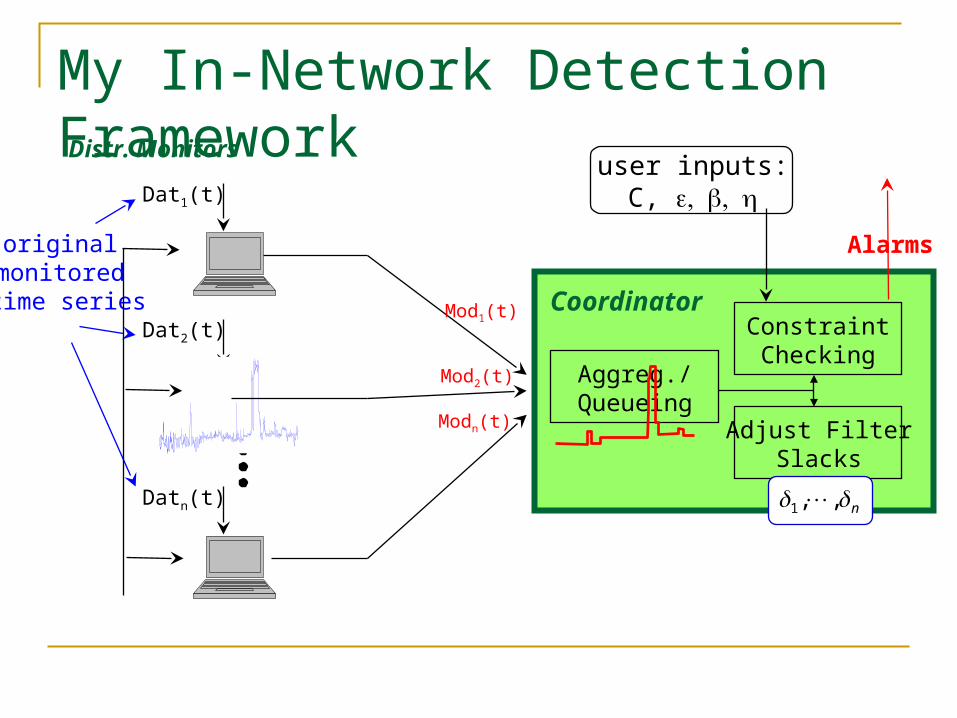
My In-Network Detection Framework
Dat1(t)
Dat2(t)
Datn(t)
ConstraintChecking
Adjust FilterSlacks
original monitored time series Mod1(t)
Mod2(t)
Modn(t)
Coordinator
Alarms
user inputs:C,
n ,,1
Distr. Monitors

sQ
Mod1(t)
Mod2(t)
Modn(t)
Dat1(t)
Dat2(t)
Datn(t)
The Distributed Queuing Model
Distributed queuing model for cumulative triggers
(b) Queue-based filtering(a) Distributed queuing model
under-estimate
over-estimate
)(Mod1 t
)(Mod2 t
)(Mod tn
1, ..., n: monitor queue size; coordinator queue
size
cQ
Nu
mb
er o
f T
CP
Req
ues
ts
Dat1(t)
Dat2(t)
Datn(t)

Queuing Analysis: The Model
Each input is decomposed into two parts Continuous enqueuing with rate Discrete enqueuing/dequeuing with size
How is the detection behavior of solution model different from centralized model?
ii td )(
)(Dat ti
)(Dat ti
n
i i t1)(Dat
(a) The centralized model (b) The Distributed solution model
n
i i t1)(Mod

Queuing Analysis: Missed Detection
)(Dat1 t )(Dat2 t )(Dat tn
C
The centralized model
overflows …
The solution model does not
overflow!
C
)(1 tr )(2 tr )(trn
Queueing model and assumptions! Tell people there is
one equation.

Queuing Analysis: False Alarm
The solution model
overflows!
C
)(Dat1 t )(Dat2 t )(Dat tn
)(Dat1 t )(Dat2 t
C
The centralized model does not
overflow …
)(Dat tn

Results: Model Validation
Desired vs. achieved detection performance
missed detection rate
false alarm rate
Achieved and are always less than desired and indicating that analytical model find upper bounds on the detection performance.
0.1 0.01 0.007 0.02 0.010
0.1 0.02 0.000 0.02 0.008
0.1 0.02 0.000 0.04 0.011
0.2 0.01 0.000 0.02 0.016
0.2 0.02 0.000 0.02 0.013
0.2 0.02 0.000 0.04 0.020
Desired Achieved Desired Achieved

Results: The TradeoffParameters design and tradeoff
between false alarm, missed detection and communication
overhead
Error tolerance = 0.2C
Overhead = # of messages sent / total # of monitoring epochs
False Alarm Rate
Missed Det. Rate
False Alarm RateMissed Det. Rate

Detection Illustration
Value ofover time (all traffic)
over time(SPE)
Value of
SPE at anomaly time points clearly stand out
αQ
2
ab
2
ab yCy

My Distributed Processing Approach User provides:
0-1 detection function (SUM, MAX, PCA, …) Target accuracy level
My approach provides: a communication-efficient framework a distributed protocol for in-network decision making An algorithmic analysis for the tradeoff between detection
accuracy and data communication cost monitor parameters determined from the target accuracy technical tool relies on stochastic matrix perturbation
theory

Let and are eigenvalues of the covariance matrices and
Define the perturbation matrix
Define the eigen error
From matrix perturbation theory, we have
So the key point is to estimate in terms of slaks ’s
Parameter Design and Error Control (II)

Eigen-Error Monitor Slacks ’s
Where: , , n is number of monitors and m is the number of data points.
The coordinator has all information to compute i’s for all monitors (Huang’06)
3
2i
9
4i
reasonable

Detection Error Eigen-Error Basic idea: study how eigen error impacts
detection error (Huang’07) With full data, false alarm rate is
With approximate data, we only have perturbed version
Given eigen error, we can compute the false alarm rate (though not in closed-form solution) Inverse dependency: given desired false alarm rate, we can
determine tolerable eigen error by fast binary search

Data Acquisition with Statistical Prediction
Prediction model can be any of: 1) Last value, 2) Simple averaging,
3) ARMA, 4) Multi-level prediction, 5) Kalman filtering, etc.
Is update available from
monitors?
No, request a prediction
Aggregation/Queuing
Prediction value
Update valueYes
Calibration
Is prediction outside slack
bound?
StreamingSource
PredictionModel
update to coordinatorYes
Calibration
No, drop the data
_
The Dual-Module Data Acquisition Mechanism
PredictionModel
Monitor Coordinator

Let and We have: Standard assumptions on the filtering error
matrix W:
Eigen Error Monitor Slacks ’s (I)

Detection Error Eigen-Error (I) Consider normalized random variable
For approximate data, we only obtain
Let denote an upper bound on The deviation of false alarm rate can be
approximate as
The upper bound of false alarm rate is
X

My In-Network Detection Framework
Anomaly
User inputs
Originalmonitoredtime series
Processedtime series
Distr. Monitors
Coordinator
n ,,1
)(1 tR
)(2 tR
)(tRn
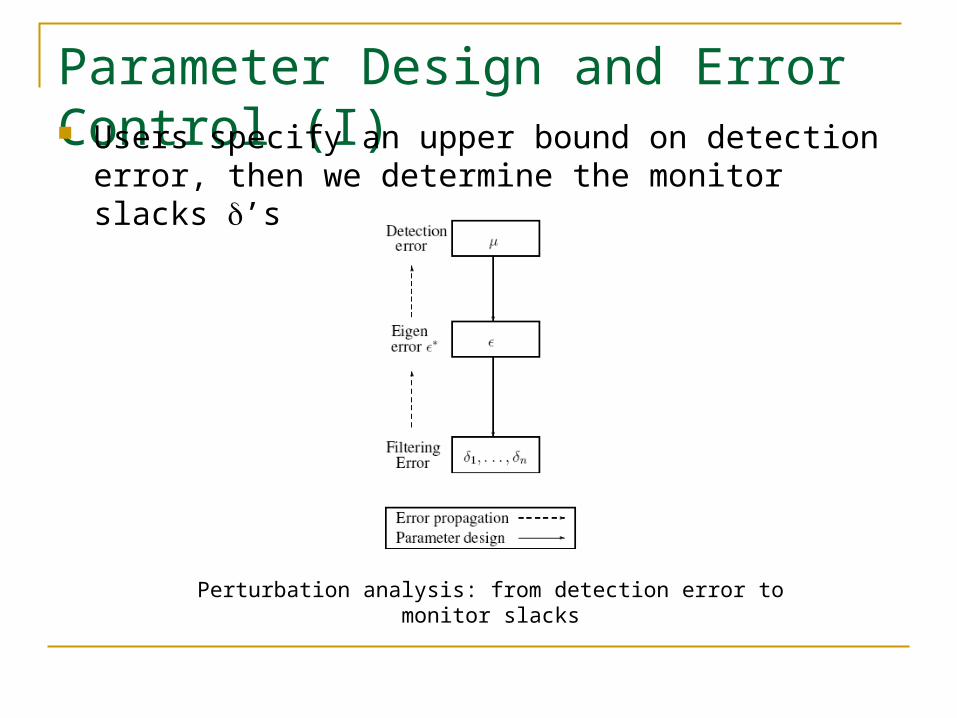
Parameter Design and Error Control (I) Users specify an upper bound on detection error, then
we determine the monitor slacks ’s
Perturbation analysis: from detection error to monitor slacks

Detection error Eigen error (Huang’07) Study how eigen error impacts detection error Inverse dependency: given detection error, we can
determine tolerable eigen error by fast binary search
Eigen-Error Monitor Slacks ’s (Huang’06)
The coordinator has all the information to compute slacks for monitors
Parameter Design and Error Control (II)
3
2i
9
4i

Results (II)
Monitor slacks, communication cost and detection error

Parameter Design and Error Control (I) Given upper bound of false alarm , determine the
monitor slacks ’s
Perturbation analysis: from deviation of false alarm to monitor slacks
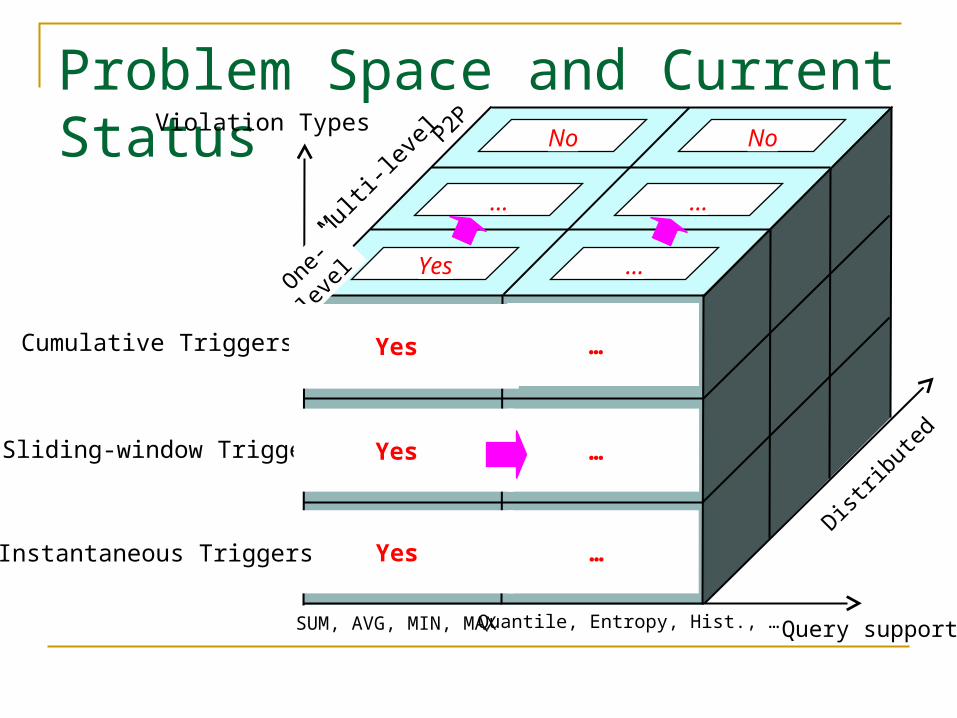
Problem Space and Current Status
Query supportQuantile, Entropy, Hist., …
Sliding-window Triggers
SUM, AVG, MIN, MAX
Cumulative Triggers
Mult
i-leve
l P2P
Distrib
uted
One-
level
Violation Types
Yes
Yes
Yes
Yes
No No
Instantaneous Triggers
…
…
…
…
… …

Outline Motivation & Introduction Detection of Network-Wide Anomalies
The Centralized Algorithm The Decentralized Detection
Detection of Distributed Cumulative Violation The Problem Definition The Decentralized Detection
Summary & Future work

Coordinator simulates a virtual queue of size
Getting an update the coordinator
En-queues with (chunks)
and (rate)
Fires the alarm if the queue gets full
Resets queue = 0 if queue < 0 Updates parameters
Adaptive Protocol for Cumulative Triggers Each monitor simulates
a virtual queue of size
Whenever its local queue under/over-flows, i.e.,
, Monitor Predicts a new Updates to
coordinator Resets and
repeats virtual queue simulation
t
iii dwwwtd0
)(Mod)(Dat)(
)(Mod ti
Cn
ii
1
Mod
)(Mod ),(, ** ttdi ii
)( *tdi
im
i
imii tdt )(:
)(Mod ),( , ttdi ii
0)( tdi

Let start the analysis with uniform , which is easy for analysis and is applicable to the non-uniform case
We want as large as possible to reduce the communication overhead
However, large brings large bursts into the system, which requires a large to absorb the burst
Values of and are constrained by the error Using queuing theory, we can analyze the overflow
probability of the queue, thus determining the values of and
Queuing Analysis: The Setup
L
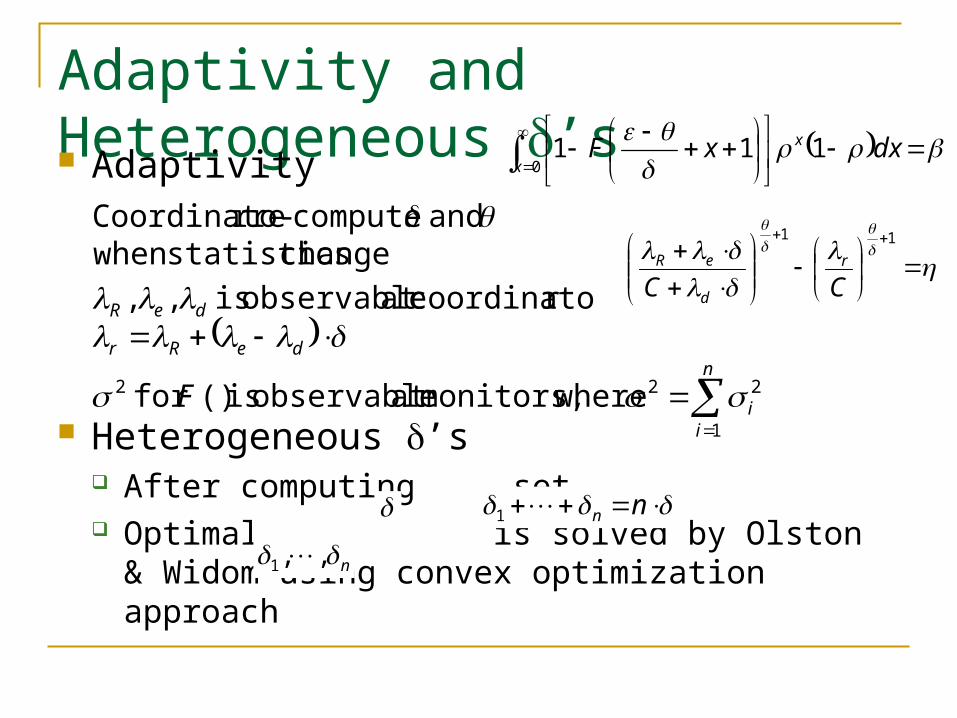
Adaptivity and Heterogeneous ’s Adaptivity
Heterogeneous ’s After computing , set Optimal is solved by Olston & Widom using
convex optimization approach
0111
x
x dxxF
11
CCr
d
eR
nn1
n ,,1
change statisticswhen and compute-rer Coordinato
n
ii
deRr
deR
F1
222 wheremonitors,at observable is ()for
rcoordinatoat observable is , ,

Scalability Issues of Centralized Approach As the number of monitoring devices grow (up to
hundreds or thousands network data features) central processing site overloaded certain networks do not overprovision inter-site connectivity
When anomalies occur on smaller time scales (down to second or sub-second scales) “periodic push” has to be applied on second or sub-second
scales the volume of data transmitted through network would
explode