1. cover sheet - 17a tihgi - revised name of issuer as specified in its charter 5. metro ......
TRANSCRIPT
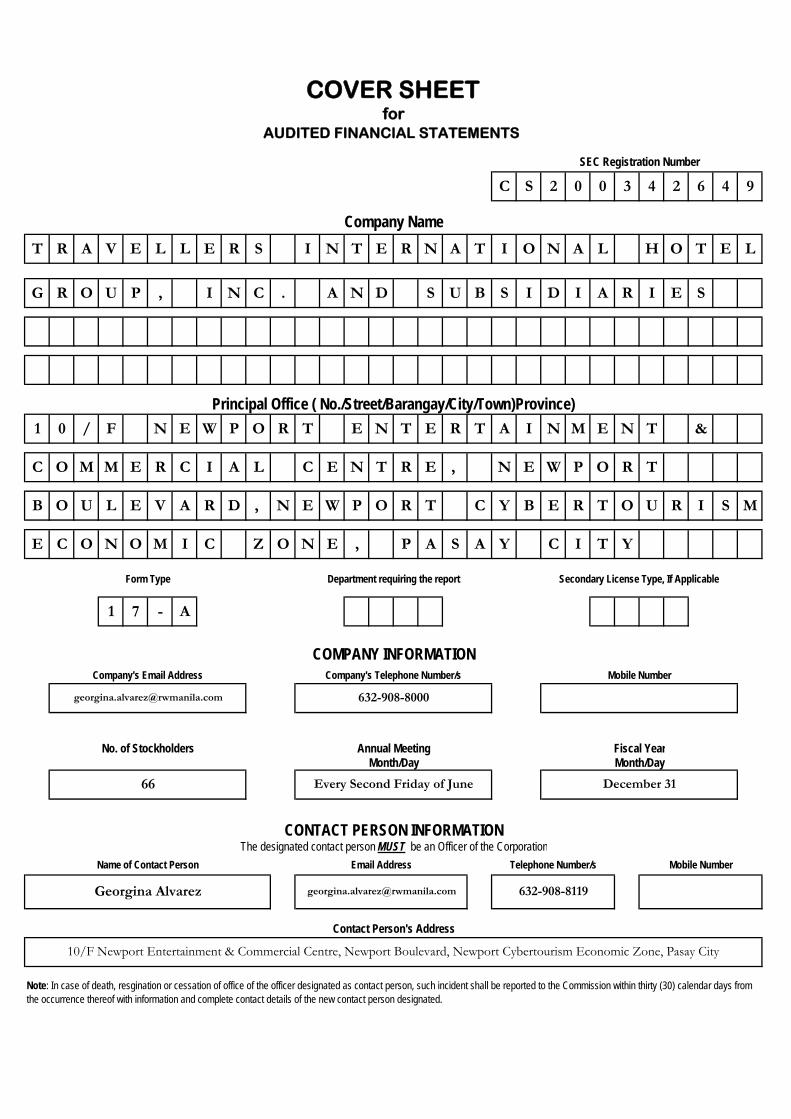
C S 2 0 0 3 4 2 6 4 9
T R A V E L L E R S I N T E R N A T I O N A L H O T E L
G R O U P , I N C . A N D S U B S I D I A R I E S
1 0 / F N E W P O R T E N T E R T A I N M E N T &
C O M M E R C I A L C E N T R E , N E W P O R T
B O U L E V A R D , N E W P O R T C Y B E R T O U R I S M
E C O N O M I C Z O N E , P A S A Y C I T Y
1 7 - A
Contact Person's Address
Note: In case of death, resgination or cessation of office of the officer designated as contact person, such incident shall be reported to the Commission within thirty (30) calendar days from the occurrence thereof with information and complete contact details of the new contact person designated.
10/F Newport Entertainment & Commercial Centre, Newport Boulevard, Newport Cybertourism Economic Zone, Pasay City
Telephone Number/s Mobile Number
No. of Stockholders Annual Meeting Fiscal YearMonth/Day Month/Day
66 Every Second Friday of June December 31
CONTACT PERSON INFORMATIONThe designated contact person MUST be an Officer of the Corporation
COVER SHEETfor
AUDITED FINANCIAL STATEMENTS
SEC Registration Number
Company Name
Principal Office ( No./Street/Barangay/City/Town)Province)
632-908-8000
Georgina Alvarez [email protected] 632-908-8119
Form Type Department requiring the report Secondary License Type, If Applicable
COMPANY INFORMATIONCompany's Email Address Company's Telephone Number/s Mobile Number
Name of Contact Person Email Address

SECURITIES AND EXCHANGE COMMISSION
SEC FORM 17-A
ANNUAL REPORT PURSUANT TO SECTION 17
OF THE SECURITIES REGULATION CODE AND SECTION 141 OF THE CORPORATION CODE
1. For the quarterly period ended December 31, 2017
2. CS 200342649 SEC Identification Number
3. 246-099-058-000 BIR Tax Identification No.
4. TRAVELLERS INTERNATIONAL HOTEL GROUP, INC. Exact name of issuer as specified in its charter
5. METRO MANILA, PHILIPPINES Province, country or other jurisdiction of incorporation or organization
6. Industry Classification Code: (SEC Use Only)
7. 10/F Newport Entertainment & Commercial Centre, Newport Boulevard, Newport Cybertourism Economic Zone, Pasay City 1309 Address of principal office
8. (632) 908- 8000 Registrant's telephone number, including area code
9. Securities registered pursuant to Sections 8 and 12 of the SRC, or secs. 4 and 8 of the RSA Title of Each Class Number of Shares of Stock Outstanding
Common 15,755,874,850
10. Are any or all of these securities listed on a Stock Exchange? Yes, the shares of common stock of the Company are listed on the Philippine Stock Exchange.
11. Indicate by check mark whether the registrant:
(a) has filed all reports required to be filed by Section 17 of the Code and SRC Rule 17 thereunder
or Sections 11 of the RSA and RSA Rule 11(a)-1 thereunder, and Sections 26 and 141 of the Corporation Code of the Philippines, during the preceding twelve (12) months (or for such shorter period the registrant was required to file such reports)
Yes [ ] No [ ] N/A [ ] (b) has been subject to such filing requirements for the past ninety (90) days. Yes [ ] No [ ]
12. The aggregate market value of the voting stock held by non-affiliates of Travellers International Hotel Group, Inc., based on the closing price of its common stock of Three pesos and forty centavos (P3.40) on the Philippine Stock Exchange on February 28, 2018 is P5,374,862,120.

- 1 -
TRAVELLERS INTERNATIONAL HOTEL GROUP, INC. AND SUBSIDIARIES
TABLE OF CONTENTS SEC FORM 17-A
Page
PART I – BUSINESS AND GENERAL INFORMATION Item 1. Business 2 Item 2. Properties 10 Item 3. Legal Proceedings 11 Item 4. Submission of Matters to a Vote of Security Holders 11 PART II - OPERATIONAL AND FINANCIAL INFORMATION Item 5. Market for Issuer's Common Equity and Related Stockholder Matters 11 Item 6. Management's Discussion and Analysis 13 Item 7. Financial Statements 23 Item 8. Information on Independent Accountant and Other Related Matters 23 PART III - CONTROL AND COMPENSATION INFORMATION Item 9. Directors and Executive Officers of the Issuer 24 Item 10. Executive Compensation 29 Item 11. Security Ownership of Certain Beneficial Owners and Management 30 Item 12. Certain Relationships and Related Transactions 32 PART IV – CORPORATE GOVERNANCE Item 13. Corporate Governance 32 PART V - EXHIBITS AND SCHEDULES EXHIBIT 1 – 2017 Audited Consolidated Financial Statements
(including List of Supplementary Information as required by the Securities Regulation Code Rule 68) 32
EXHIBIT 2 – Reports on SEC Form 17-C 32

- 2 -
PART I BUSINESS AND GENERAL INFORMATION Item 1. Business Overview of the Company Travellers International Hotel Group, Inc. (the Company) is the developer and operator of Resorts World Manila (“RWM”), an integrated tourism resort in the Philippines. The Company was awarded one of the first licenses issued by the Philippine Amusement and Gaming Corporation (PAGCOR) in June 2008 to construct and operate integrated leisure and gaming facilities to an international standard with the goal of enhancing tourism in the Philippines. In August 2009, the Company began operations at RWM, the first integrated leisure and resort property in the Philippines that combines privately-operated gaming facilities with hotel, retail, dining, entertainment and other leisure amenities. RWM is an approximately 11.5-hectare integrated tourism resort owned by the Company that is strategically located across from the Ninoy Aquino International Airport (“NAIA”) Terminal 3 (“NAIA-3”) in Pasay City, Manila and approximately five kilometers away from each of NAIA Terminal 1 (“NAIA-1”) and NAIA Terminal 2 (“NAIA-2”) and directly linked to highways leading to Makati. RWM is a 24-hour, one-stop, world-class leisure and entertainment facility within Newport City, a mixed-use community of integrated residential condominiums, hotels, restaurants, shops and offices developed by Megaworld Corporation (“Megaworld”), an Alliance Global Group, Inc. (“AGI”) subsidiary listed on the Philippine Stock Exchange (“PSE”). RWM features a themed shopping and entertainment center, three hotels – Maxims Hotel, an all-suite luxury hotel; the Marriott Hotel Manila, a five-star hotel catering to international business and leisure travelers; and the Remington Hotel, the Company’s mid-range hotel, and a MICE (meetings, incentives, conventions and exhibitions) venue with over 8,000 square meters of function space called the Marriott Grand Ballroom. The construction of RWM commenced in July 2008. And in August 2009, RWM opened its gaming facilities and casino along with the 11,534 sq. m. Newport Mall, which includes a retail mall, a 1,500 seat performing arts theater (the “Newport Performing Arts Theater”), and a four-screen cinema. The Marriott Hotel Manila opened in October 2009 with 342 rooms and suites, and in November 2016 an additional 228 rooms were opened thru the Marriott West Wing. Maxims Hotel opened in December 2010 which offers 172 suites and villas; while Remington Hotel opened in November 2011. The Marriott Grand Ballroom, a world-class events and convention center, formally opened its doors to the public in March 2015. The Company has designed RWM to cater to a broad range of local and international visitors, including the following:
Mass Market players, who represent the highest profit margin gaming segment and are generally characterized by non-rolling chip and slot machine play; Premium Mass Market players, a sub-segment of Mass Market players are characterized by table game play with relatively higher minimum bets than general Mass Market customers but relatively lower bets than VIP players; and,
VIP players, who patronize premium gaming facilities, luxury accommodations and amenities, and are characterized by either rolling chip play or cash play and high minimum bets.
The Company is a joint venture partnership between AGI, which is listed on the PSE, and Genting Hong Kong Limited (“GHK”), a company with shares listed on The Stock Exchange of Hong Kong Limited and traded on the GlobalQuote of Singapore Exchange Securities Trading Limited. The partnership between AGI and GHK commenced in July 2008 following the Company’s award of a gaming license from PAGCOR on June 2, 2008 (the “Provisional License”). Prior to the joint venture partnership, the Company was wholly-owned by AGI and held certain of its land bank intended for future hotel, restaurant, leisure park, and entertainment center projects, as well as other related businesses. The partnership combines AGI’s expertise in the Philippine mixed-use township development, food and beverage (“F&B”) and quick service restaurants, and GHK’s international experience as an owner and operator of casino and gaming businesses, operator of passenger cruise ships and provider of cruise-related leisure, entertainment and hospitality services. GHK is affiliated with Genting Berhad and its subsidiaries and associates (the “Genting Group”).

- 3 -
Subsidiaries, Associate and Joint Venture As of December 31, 2017, the Company holds interests in the following subsidiaries and associate: Date of Percentage Incorporation Ownership Subsidiaries: Agile Fox Amusement and Leisure Corporation (AFALC) May 15, 2015 100% APEC Assets Limited (APEC) February 23, 2000 100% Aquamarine Delphinium Leisure and Recreation Corporation (ADLRC) May 18, 2015 100% Brightleisure Management Inc. (BLMI) December 12, 2008 100% Bright Pelican Leisure and Recreation Inc. September 4, 2013 100% Brilliant Apex Hotels and Leisure Corporation (BAHLC) May 18, 2015 100% Coral Primrose Leisure and Recreation Corporation (CPLRC) May 18, 2015 100% Deluxe Hotels and Recreation Inc. (DHRI) August 3, 2012 100% Entertainment City Integrated Resorts & Leisure Inc. November 16, 2012 100% FHTC Entertainment & Productions Inc. (FHTC) February 15, 2013 100% Golden Peak Leisure and Recreation Inc. (GPLRI) (formerly Yellow Warbler Leisure and Recreation Inc.) September 9, 2013 100% Grand Integrated Hotels and Recreation Inc. (GIHRI) October 19, 2011 100% Grandservices Inc. (GSI) December 12, 2008 100% Grandventure Management Services Inc. (GVMSI) December 16, 2008 100% Lucky Panther Amusement and Leisure Corporation (LPALC) May 18, 2015 100% Lucky Star Hotels and Recreation Inc. (LSHRI) August 3, 2012 100% Luminescent Vertex Hotels and Leisure Corporation (LVHLC) May 15, 2015 100% Magenta Centaurus Amusement and Leisure Corporation (MCALC) May 18, 2015 100% Majestic Sunrise Leisure & Recreation Inc. November 16, 2012 100% Netdeals, Inc. May 25, 2012 100% Newport Star Lifestyle, Inc. (NSLI) August 3, 2012 100% Royal Bayshore Hotels & Amusement, Inc. November 16, 2012 100% Sapphire Carnation Leisure and Recreation Corporation (SCLRC) May 18, 2015 100% Scarlet Milky Way Amusement and Leisure Corporation (SMWALC) May 15, 2015 100% Sparkling Summit Hotels and Leisure Corporation (SSHLC) May 18, 2015 100% Valiant Leopard Amusement and Leisure Corporation (VLALC) May 18, 2015 100% Vermillion Triangulum Amusement and Leisure Corporation (VTALC) May 15, 2015 100% Westside Theatre Inc. (WTI) August 14, 2015 100% Westside City Resorts World Inc. (WCRWI) (formerly Resorts World Bayshore City, Inc.) April 30, 2013 95% Associates: Manila Bayshore Property Holdings, Inc. October 14, 2011 50% Joint Venture: Front Row Theatre Management Inc. October 13, 2015 50% APEC owns a yacht for RWM needs. BLMI employs staff for certain positions in the casino operations of the Company. GVMSI employs staff for Maxims Hotel and Remington Hotel. GSI currently employs staff for Marriott Hotel Manila and Marriott Grand Ballroom. GIHRI operates the RWM steel parking services. NSLI is the company that is targeted to house the membership cards of RWM members. DHRI is the owner of Hilton Manila. LSHRI is the owner of Sheraton Manila Hotel. FHTC houses music recording, theater productions and

- 4 -
other entertainment activities of the Company. WCRWI is the owner of Westside City Resorts World. The Company also has subsidiaries that are not operating as of December 31, 2017 which the Company intends to utilize for some of its operations in the future. Principal Products or Services and Market RWM, the Philippines’ first integrated leisure and lifestyle complex, combines hospitality, entertainment, leisure, shopping and gaming in one grand arena, a one-stop non-stop destination. RWM operates a two-storey gaming facility, which includes the Genting Club (a members-only lifestyle club, with a private gaming area, dining options and other fabulous lifestyle features), and additional gaming halls thru the Remington Hotel with an aggregate area of 16,076 square meters. As of the end of 2017, RWM has 244 casino tables and, 1,381 slot machines/electronic gaming machines (EGMs). RWM also features the upscale Newport Mall (91 retail stores and food-and beverage outlets with a mix of high-end boutiques and mass market option), Newport Cinemas (24 hours on weekends), the 1,500-seat Newport Performing Arts Theater (a majestic venue for concerts, plays, musicals and exclusive productions), the GameZoo arcade, an office space (which features a training academy and a 400-seat capacity call center) and hotels. The three hotels currently in operation at RWM are the following - the five-star 570-room Marriott Hotel Manila, the 172-all-suites Maxims Hotel, and the mid-range 712-room Remington Hotel which will be rebranded to Holiday Inn Express Manila Newport City. RWM also boasts of the Marriott Grand Ballroom, a MICE venue with a 3,000-square meter pillar-less ballroom. It is the largest and most versatile luxury space within Metro Manila and has taken center stage as the preferred venue for conventions and social affairs including internationally acclaimed performances, making full use of the impressive high-tech column free ballrooms. The facility holds 20 individual meeting rooms and its ballroom features 6 VIP multi-use skyboxes, offering a large array of flexibility in hosting multiple events. Foreign Sales Based on the Company’s rated members (those members with gaming activity), the principal foreign market consistently contributing for 2017 are from United States, Korea and China. Foreign guests in Maxims Hotel come from Korea, China, Malaysia, and Singapore; guests in Remington are from the United States, Korea, China and Australia while for Marriott, majority are from the United States followed by Singapore, China and Korea. Distribution Methods The Company engages in direct relationship-based marketing, which is targeted at specific market segments. The marketing team focuses on market research, surveys, promotions and events that can drive visitations and convert them to returning guests. The sales team is responsible for sales revenues and channel performance. In addition, the Company advertises in many types of media both domestically and overseas, including television, radio, newspapers, magazines, social media and billboards to promote general market awareness. RWM uses a mix of different channels to reach the specific targets on gaming, lifestyle, and entertainment, such as:
Direct sales - that comprises of three levels to provide clients with full service: (i) traditional sales, (ii) a business development team and (iii) in-house VIP host services.
Indirect sales through junkets – from the well-established relationships of Genting Group, to source high-end players in different regions.
Indirect sales through travel and tour operators – these accredited operators create group travel packages with discounts, to bring in guests in RWM as part of their itineraries, and in return, receive commissions.
City shuttles – free, convenient, hassle-free shuttle transport for member-players and member-consumers to RWM. The key locations are Quezon City, Manila, Laguna, Rizal and Marikina.

- 5 -
The Company uses a comprehensive membership management and customer database system. It uses Genting’s Dynamic Reporting System (DRS), a fully integrated real-time table games and slots monitoring system. New Products or Services The Company is currently developing several new hotels and other gaming and non-gaming attractions at RWM. And is committed to continuously improve and refresh the current facilities at RWM to create unique customer experience across a variety of gaming and non-gaming amenities. In April 2017, the Company officially opened the RunWay Manila, a 220-meter pedestrian link bridge that connects NAIA Terminal 3 and Newport City, which the public can use free of charge. The project, which stands 65 meters above Andrews Avenue at Pasay City, is a fully enclosed, air-conditioned bridge with moving walkways and elevators. It is designed to accommodate up to 2,000 persons at any time, or up to 216,000 individuals per day. RunWay Manila is fully financed by the Company and costs approximately P1.9 billion. Phase 3 of RWM: RWM’s Phase 3 consists of three luxury hotels: Sheraton Manila Hotel, Hilton Manila and Hotel Okura Manila. Construction of the three hotels is ongoing and the same is projected to be completed by 2018. This project will increase both gaming and non-gaming facilities within RWM. Competition The Company being the first integrated resort with world-class gaming in the Philippines, has set a benchmark in a very high and unique manner. The group competes with both Philippine and foreign owned hotels and resorts. With respect to the gaming business, competition comes from casinos operated by government and other private companies. In particular, there are facilities already built by three developers other than the Company that have been granted provisional licenses by PAGCOR in Entertainment City, all of which are already open to the public. These three other licensees similarly partnered with international resorts and gaming companies – Henry Sy’s SM-consortium has Melco Resorts and Entertainment (Philippines) Corporation of billionaire Lawrence Ho (Macau); Tiger Entertainment Resort of Kazuo Okada (Japanese) and Filipino businessman Antonio Cojuangco, Jr.; Enrique Razon’s Bloomberry Resorts Corporation (Philippines). In addition, Westside City Resorts World will be developed in Entertainment City by the Company’s co-Licensee, WCRWI. While it has the first-mover advantage, the Company continues to develop other leisure and entertainment attractions to complement its gaming business. The Company is expanding its hotel service through additional hotel brands and rooms, and its attractions as a family destination. In addition, PAGCOR operates 13 gaming facilities across the Philippines and 34 satellite gaming facilities (which are smaller casinos and slots clubs). The Philippine gaming market also includes many other private casino and gambling operations, including six licensed private casino operators in special economic zones (“Ecozones”). The Philippine gaming market is also comprised of other gambling competitors specializing in horse racing, cock fighting, jueteng, lotteries, sweepstakes, online gaming operators and other smaller-scale gaming operators. Sources and Availability of Raw Materials Travellers has a large base of contractors and suppliers that provide construction, engineering and consulting services, and is not dependent on any one contractor or supplier. In 2017, the ten largest suppliers – Global Matrix Concept Group, Systech Lighting & Controls Inc., Aristocrat (MACAU) PTY Limited, Empire Automation Philippines Inc., Top Source Maintenance and Contracting Services, RGB LTD, Jay Edwards Group LLC, Vycon Inc, Arcridge Construction, Joint Venture Audio Visual Lighting Inc. – accounted for 49.53% of the total purchases for the year.

- 6 -
Customer Dependence The Company’s businesses are not dependent upon a single or a few customers or tenants, the loss of which would not have a material adverse effect on the Company and its subsidiaries taken as a whole. Transactions with and/or Dependence on Related Parties The Company and its subsidiaries, in their ordinary course of business, engage in transactions with its related parties. The Company’s policy with respect to related party transactions is to ensure that these transactions are entered into terms comparable to those available from third parties. Intercompany transactions between and among the Company and its subsidiaries are eliminated in consolidation and thus are no longer reflected in the consolidated financial statements. Transactions with related parties include investments in and advances granted to or obtained from subsidiaries, associates and other related parties. Advances granted to and obtained from subsidiaries, associates and other related parties are for working capital requirements and other related purposes. Other related parties include investees which investments are accounted for under the equity method and other entities which are owned and managed by investors/owners of the Company. Major related party transactions have been disclosed in Note 22 to the consolidated financial statements appearing elsewhere in this report. Other than those disclosed in the consolidated financial statements, the Company has not entered into any other related party transactions. Licenses, Trademarks, Franchises The Company holds a PAGCOR license to operate casinos and engage in gaming activities in two sites – in Newport City (Site B) where RWM is situated, and in Entertainment City (Site A) where Westside City Resorts World is set to rise. The term of the license is co-terminus with PAGCOR’s franchise which will expire on July 11, 2033 and shall be renewed subject to the terms of the PAGCOR charter. On March 18, 2013, WCRWI entered into a Deed of Accession which was accepted, agreed and consented to by PAGCOR. Pursuant to the Deed of Accession, WCRWI acceded to the rights, title, interests and obligations of the Company under the Provisional License and other relevant agreements with PAGCOR. Accordingly, PAGCOR recognized and included WCRWI as a co-licensee and co-holder of the Provisional License and other relevant agreements. Further, on June 10, 2013, the Company and WCRWI entered into a Cooperation Agreement which designates the parties’ respective rights, interests and obligations under the Provisional License and other relevant agreements. Specifically, the parties agreed that WCRWI would have all the rights and obligations under the Provisional License with respect to Site A (Westside City Resorts World) and that the Company would have all the rights and obligations with respect to Site B (Resorts World Manila). Accordingly, on June 28, 2013, PAGCOR issued an Amended Certificate of Affiliation and Provisional License certifying the Company and WCRWI as co-licensees and co-holders of the Provisional License and other relevant agreements. On September 23, 2014, the Company subscribed to common and preferred shares in WCRWI making it the effective owner of ninety five percent (95%) of WCRWI. The Company also has a non-exclusive non-transferable right and license within Metro Manila to the use of Marriott trademarks for hotel services and other related goods and services offered in connection with the hotel. It has registered trademarks over “Passion,” “Gamezoo,” “Remington Hotel Newport City,” “Remington Hotel Manila,” “Remington Inn,” “Remington Hotel Manila with Chinese Characters,” “Newport Performing Arts Theater,” “Grand Opera House,” “Grand Opera House Manila,” “Fun Fiesta Jackpot,” “Manila Millions Poker,” “Mabuhay Millions Poker,” “Noodle Works,” “iGrab everything I want,” “iGrab,” “Impressions,” “Café

- 7 -
Maxims,” “Mercado,” “Kimchi and Mojou,” “Remington Bar Lounge,” “Bar 360,” “Ginzadon,” “Grabit,” “Thrill Like No Other,” “Newport Performing Arts Theater Bar,” “The Terrace,” “Lucky Noon,” “Laff Laugh Fun,” “Kami Naman ang Taya,” “Musikat Records,” “Oak Tree Inn,” “Regal Inn,” “Hotel Gran Palacio,” “El Castillo de Manila,” “Castillo Manila,” and “The Grand Theatre of Manila,” “Grand Theatre of Manila,” “Chill,” “Grand Fiesta Manila,” “R88,” “Manila Bayshore Heritage Foundation, Inc.,” “The World of Luck,” “House Ultra Lounge,” “Franks Craft Beers Manila,” “Westford Inn,” “Full House Theater Company,” “Victoria Harbour,” “Bayshore City Resorts World,” “Westside Theatre,” “Herald Theatre,” “Fortissimo Theatre,” ”Galaxy Theatre,” “Excelsior Theatre,” “Diamond Theatre,” “Bohemia Theatre,” “Apollo Theatre,” “Front Row Theatre Management,” “Original Pilipino Performing Arts,” “House Manila,” and their related devices which will expire on various dates in 2018-2026, and are renewable thereafter. Government Approval of Principal Products or Services The Company operates its gaming activities through the license granted by PAGCOR, a government-owned and controlled corporation, which was granted the franchise to operate and license gaming casinos, gaming clubs and other similar recreation or amusement places, gaming pools, whether on land or sea, within the Philippines. The franchise of PAGCOR is extended for another 25 years after July 11, 2008, its original term. The activities and operations of RWM are closely monitored by PAGCOR Monitoring Team (PMT) which maintains an office inside RWM where officials are stationed 24 hours a day. The Company is in continuous close contact with PAGCOR regarding compliance with its gaming concession and all applicable Philippine laws. The Company is also required to provide periodic reports to PAGCOR. Shopping malls are regulated by the local government unit of the city or municipality where the shopping mall is located. Retail stores in shopping malls must secure a mayor’s permit before operating and must comply with the fire safety provisions and other applicable local ordinances. Operators of restaurants and other food establishments in shopping malls must obtain a sanitary permit from the same local government unit where the shopping mall is located. Effect of Existing or Probable Government Regulations The Company is subject to 25% and 15% license fees, in lieu of all taxes, with reference to the income component of the gross gaming revenues, as provided under the Provisional License Agreement with PAGCOR. Although the Bureau of Internal Revenue (BIR) issued Revenue Memorandum Circular No. 33-2013 declaring that PAGCOR, its contractees and its licensees are no longer exempt from corporate income tax under the National Internal Revenue Code of 1997, as amended, the Supreme Court, on August 10, 2016, in Bloomberry Resorts and Hotels, Inc. vs. BIR, confirmed the legality of the aforesaid provision of the Provisional License subjecting the Company to 25% and 15% license fees, in lieu of all taxes, with reference to the income component of the gross gaming revenues, when it affirmed that “exemptions granted for earnings derived from the operations conducted under the franchise specifically from the payment of any tax, income or otherwise, as well as any form of charges, fees or levies, shall inure to the benefit of and extend to corporation(s), associations(s), agency(ies) or individual(s) with whom the PAGCOR or the operator has any contractual relationship in connection with the operations of the casino(s) authorized to be conducted under this Franchise, so it must be that all contractees and licensees of PAGCOR, upon payment of the 5% franchise tax, shall be exempted from all other taxes, including income tax realized from the operation of casinos”. This Decision has been affirmed with finality in the Supreme Court Resolution dated November 28, 2016, when it denied the Motion for Reconsideration filed by the BIR. Republic Act (RA) 9160, as amended, or the Anti-Money Laundering Act of 2001 (AMLA), prohibits money laundering, a crime whereby the proceeds of an unlawful activity are transacted, thereby making them appear to have originated from legitimate sources. A “covered transaction” under the AMLA refers to a transaction in cash or other equivalent monetary instrument involving a total amount in excess of P500,000 within one banking day. Covered institutions must report all transactions to the Anti-Money Laundering Council within five working days of occurrence, unless the supervising authority concerned prescribes a longer period, which period shall not exceed 10 working days. Penalties include fines of not less than P100,000 and imprisonment ranging from nine

- 8 -
months to fourteen years, depending on the money laundering committed. As of writing, casinos and all other activities of the Company are not covered by AMLA. The Company is registered with PEZA as a Tourism Economic Zone for Maxims Hotel, Newport Entertainment and Commercial Center, Marriott Hotel Manila, Remington Hotel, Marriott Grand Ballroom, Marriott West Wing, Sheraton Manila Hotel, Hilton Manila and Hotel Okura Manila. As such, the Company is entitled to certain tax incentives. Research and Development The regular research and development activities of the Company for the past three years have not amounted to a significant percentage of revenues. There are no new products or design being developed that would require a material amount of the Company’s resources. Compliance with Environmental Laws The Company and its subsidiaries have incurred minimal costs to comply with environmental laws. Number of Employees As of December 31, 2017, the Group has a total workforce of 4,785 personnel categorized as follows:
Actual as of December 31, 2017
Projected Headcount as at December 31, 2018
Gaming 3,206 3,588
Management & Admin 741 964
Hotel 298 340
F&B 343 394
Marketing 197 235
TOTAL 4,785 5,521
There is no existing collective bargaining agreement between the Company and any of its employees, and the Company’s employees are not part of any labor union. The Company has not experienced any disruptive labor disputes, strikes or threats of strikes, and management believes that the Company’s relationship with its employees in general is satisfactory. Potential Business Risks Risks are integral part of business. Opportunity for advancement cannot be achieved without taking risks. This is why the Company and its subsidiaries adopted a policy whereby risks are identified before they cause significant trouble for the business. They carefully prepare structured/strategic plans to anticipate the inherent risks in their activities and set up methods to mitigate the effects of these risks. Risks are prioritized based on their impact to business, and probability of occurrence. There is a monitoring system that keeps track of the indicators and the actions/corrections undertaken. Feedbacks, both internal and external, are important for current and emerging risks. The Company’s risk management is coordinated with the Board of Directors (BOD) and focuses on actively securing short-to medium-term cash flows by minimizing the exposure to financial markets. Long-term financial investments are managed to generate lasting returns. The Company does not actively engage in the trading of financial assets for speculative purposes.

- 9 -
The potential risks that the present business faces include:
Hazards and natural or other catastrophes. The Company and its subsidiaries’ assets are always exposed to losses or impairment through fire and natural or man-made disasters and accidents, including the outbreak of infectious diseases, that may materially disrupt operations and result in losses. In particular, damage to the Company’s project structures resulting from such natural catastrophes could also give rise to claims from third parties or for physical injuries or loss of property.
Safety measures are undertaken and implemented within the Company’s operations. Adequate insurance policies are likewise in place to cover from these risks. Any material uninsured loss or loss materially in excess of insured limits could materially and adversely affect the Company’s business, financial condition and results of operations, while remaining liable for any financial obligations related to the business.
Regulatory developments. The Philippine integrated tourism industry is highly regulated. The Company is subject to gaming and non-gaming regulations for its operations. The Company’s results of operations could be affected by the nature and extent of any new legislation, interpretation or regulations, including the relative time and cost involved in procuring approvals for projects. If the Company fails to meet safety, health and environmental requirements, it may also be subject to administrative, civil and criminal proceedings initiated by the Philippine Government (the Government), which could result in substantial fines and penalties against the Company, as well as orders that could limit or halt its operations. The Company, thus, keeps abreast of current happenings and immediately institute measures to contain any adverse effect on the Company.
Win rate, money laundering and cheating at gaming areas. The gaming industry is characterized by an element of chance. Win rates for our gaming operations depend on a variety of factors. Casino and gaming activities are cash intensive and involve significant amounts of revenue daily. Customers may seek to influence their gaming returns through cheating or other fraudulent methods. Fraudulent activities, including collusion and automated play, could cause the Company and its customers to experience losses, harm its reputation and ability to attract customers, and materially and adversely affect its business, goodwill, financial condition and results of operations. The Company takes numerous preventive and mitigating measures for the handling of chips, cash and gaming equipment. It uses special technologies to prevent and detect potential fraudulent and counterfeiting activities as well as high value and suspicious transactions.
Supply of raw materials/Construction. As the Company currently has significant ongoing expansion and construction projects within the Newport area, the Company sources construction materials such as lumber, steel and cement, and may experience shortages or increases in prices. Rising price changes will result in unexpected increases in construction costs. Purchasing, therefore, keeps posted about supply sufficiency in the market and always looks out for new potential sources. Construction, equipment, staffing and difficulties in obtaining requisite licenses, permits, and authorization from regulators could increase the total cost, delay project completion, or affect the design and features
Competition. The Company’s primary business operation is subject to intense competition. Some competitors may have substantially greater financial and other resources than the Company, which may allow them to undertake more aggressive marketing and to react more quickly and effectively to changes in the markets and in consumer preferences. In addition, the entry of new competitors into any of the Company’s primary business segments may reduce the Company's sales and profit margins.
Philippine economic/political conditions. The Company’s business is highly dependent on the Philippine economy. The Company’s results of operations are expected to vary from period to period in accordance with fluctuations in the Philippine economy which is in turn influenced by a variety of factors, including political developments among others. Political instability in the Philippines could negatively affect the general economic conditions and operating environment in the Philippines, which could have a material impact on the Company’s business, financial condition and results of operation. While the Philippine economy has generally registered positive economic growth there can be no assurance that current or future Government will adopt economic policies conducive to sustaining economic growth.

- 10 -
Global economic, political, and social environment. A portion of the Company’s revenue comes primarily from foreign visitors. Any global economic disruption or contractions could impact the number of foreign customers who visit our property or the amount which they may be willing to spend. Changes brought about by fears of war and future acts of terrorism may severely disrupt international travel, reduce demand for luxury amenities and leisure activities and may have significant impact on our operational results. Demand for hotel, trade shows, conventions, and other entertainment activities that the Company offers are sensitive to swings in the global economy, which impacts discretionary spending.
Cyber security. We rely on information technology and other systems to maintain and transmit large volumes of customer information and transactions, employee information and information concerning the Company’s operations. The systems and processes that have been implemented to protect this information are subject to the ever-changing risk of compromised security. These risks include cyber and physical security breaches, system failure, computer viruses, and negligent or intentional misuse by customers, company employees or employees of third-party vendors. A significant theft, loss or fraudulent use of customer or company data maintained by us could have an adverse effect on our reputation, cause material disruption to our operations and management team, and litigation by our customers and other parties whose information was subject to such attacks, all of which could have a material adverse effect on our business, results of operations and cash flows.
Anti-Money Laundering Law. Recently, the Philippine government have included casinos in the Anti-Money Laundering Law. Any violation of anti-money laundering law or regulations could affect our business, performance, prospects, value, financial condition, and results of operations. The Company is doing all necessary actions to fully comply with this new development. Internal control policies and procedures, employee training, and compliance programs have been implemented. These, however, may not be sufficient in prohibiting actions that violates our policies and the law. Failure to comply with applicable laws, may result to the Company facing investigations, legal proceedings and actions which may lead to administrative cases, civil penalties, and criminal sanctions.
A further discussion on financial risk management objectives and policies is presented in the notes to the consolidated financial statements. Item 2. Properties The following site map details the principal properties owned or leased by the Company, including those reserved for future developments as of December 31, 2017.

- 11 -
Item 3. Legal Proceedings There are no material litigations or claims pending or, to the best knowledge of the Company, threatened against the Company or any of its subsidiaries or associates or any of their properties that would adversely affect the business or financial position of the Company or any of its subsidiaries or associates. Item 4. Submission of Matters to a Vote of Security Holders No other matter was submitted to a vote of security holders.
PART II OPERATIONAL AND FINANCIAL INFORMATION Item 5. Market for Issuer’s Common Equity and Related Stockholder Matters Market Price Information The common shares of the Company are traded on the PSE under the symbol of RWM. The Company’s common stock was first listed on the PSE on November 5, 2013. The trading prices of the Company’s common shares as reported on the PSE for each quarter within the last two fiscal years and in subsequent trading day in 2018 are set forth below. Year Period High Low 2018 Feb 28 3.43 3.40 2017 Q1 3.49 3.01 Q2 4.04 2.86 Q3 3.98 3.33 Q4 4.49 3.65 2016 Q1 4.29 3.38 Q2 3.83 3.19 Q3 3.67 3.21 Q4 3.67 3.02 Shareholders As of December 31, 2017, the Company had 68 shareholders, including nominees, holding 15,755,874,850 common shares. The following table from Banco de Oro, Stock and Transfer Agent of the Company, sets forth the twenty largest common shareholders of the Company as of December 31, 2017.
Rank Stockholder No. of Shares Held Per Cent to Total 1 Alliance Global Group, Inc. 3,957,112,838 24.781 2 Adams Properties Inc. 3,539,750,000 22.167 3 Star Cruises Philippines Holdings B. V. 2,831,799,980 17.734 4 Asian Travellers Ltd. 1,784,034,000 11.172 5 Premium Travellers Ltd. 1,047,766,000 6.562 6 PCD Nominee Corp. (Filipino) 852,549,399 5.339 7 PCD Nominee Corp. (Non-Filipino) 725,771,962 4.545 8 First Centro, Inc. 707,949,970 4.433 9 Megaworld Corporation 290,587,162 1.820 10 The Andresons Group, Inc. 10,000,000 0.063

- 12 -
Rank Stockholder No. of Shares Held Per Cent to Total 11 The Andresons Group, Inc. 4,000,000 0.025 12 Bingson U. Tecson 1,333,200 0.008 13 Brent Vincent T. Tecson 889,000 0.006 14 Lutgardo V. Cruz 886,500 0.006 15 Arco Equities Inc. 500,000 0.003 16 FLG Management and Development
Corporation 500,000 0.003
17 Alfred Reiterer 138,888 0.001 18 John T. Lao 60,000 Nil 19 Eusebio S. Go 50,000 Nil 20 Lucio W. Yan &/OR Clara Y. Yan 50,000 Nil
Update on Tax Issues As mentioned above, the Company is subject to 25% and 15% license fees, in lieu of all taxes, with reference to the income component of the gross gaming revenues, as provided under the Provisional License Agreement with PAGCOR. In April 2013, however, the BIR issued RMC No. 33-2013 declaring that PAGCOR, its contractees and its licensees are no longer exempt from income tax under the National Internal Revenue Code of 1997, as amended. The issue on whether revenues from gaming operations of the Company are subject to income tax by the BIR under the National Internal Revenue Code of 1997 (NIRC), as amended, was settled in the case of Bloomberry Resorts and Hotel, Inc. vs. Bureau of Internal Revenue, G.R. No. 212530, August 10, 2016, where the Supreme Court ruled that: “As the PAGCOR Charter states in unequivocal terms that exemptions granted for earnings derived from the operations conducted under the franchise specifically from the payment of any tax, income or otherwise, as well as any form of charges, fees or levies, shall inure to the benefit of and extend to corporation(s), association(s), agency(ies), or individual(s) with whom the PAGCOR or operator has any contractual relationship in connection with the operations of the casino(s) authorized to be conducted under this Franchise, so it must be that all contractees and licensees of PAGCOR, upon payment of the 5% franchise tax, shall likewise be exempted from all other taxes, including corporate income tax realized from the operation of casinos.” The Motion for Reconsideration filed by the BIR of the August 10, 2016 Resolution was denied with finality in an Order dated November 28, 2016. Dividends in the Two Most Recent Years and Subsequent Interim Period The Company is authorized under Philippine law to declare dividends, subject to certain requirements. The payment of dividends, either in the form of cash or shares, will depend upon the Company’s earnings, cash flow and financial condition, among other factors. The Company may declare dividends only out of its unrestricted retained earnings. These represent the net accumulated earnings of the Company with its unimpaired capital, which are not appropriated for any other purpose. The Company may pay dividends in cash, by the distribution of property, or by the issue of shares. Dividends paid in cash are subject to the approval by the BOD. Dividends paid in the form of additional shares are subject to approval by both the BOD and at least two-thirds of the outstanding share capital of the shareholders at a shareholders’ meeting called for such purpose. The Company intends to maintain an annual cash and/or share dividend pay-out of up to 20% of its net profit from the preceding year, subject to the requirements of applicable laws and regulations, the terms and conditions of its loan facilities, and the absence of circumstances that may restrict the payment of such dividends, such as where the Company undertakes major projects and developments. Dividends must be approved by the BOD and may be declared only from the unrestricted retained earnings of the Company. The Company’s BOD may, at any time, modify the Company’s dividend policy, depending upon the Company’s capital expenditure plans and/or any terms of financing facilities entered into to fund its current and future operations and projects. On May 8, 2017, the Company’s BOD approved the declaration of a cash dividend of P630.2 million to holders of the Company’s common shares of record as of May 31, 2017, which was paid on various dates in 2017.

- 13 -
On May 16, 2016, the Company’s BOD approved the declaration of a cash dividend of P787.8 million to
holders of the Company’s common shares of record as of May 31, 2016, which was paid on June 9, 2016 and
August 24, 2016.
As of December 31, 2017 and 2016, the Company’s retained earnings are restricted to the extent of the cost of
the treasury shares as of the end of the reporting periods. The Company also has P11.9 billion unrestricted
retained earnings available for dividend distribution.
Item 6. Management’s Discussion and Analysis
A. Key performance indicators
Presented below are the key performance indicators for the year ended December 31, 2017, 2016 and 2015:
In Million Pesos 2017 2016 2015
NET REVENUES 19,258.9 25,094.6 24,602.1
NET PROFIT 241.7 3,398.5 4,017.6
EBITDA 3,458.3 6,420.5 6,161.9
TOTAL ASSETS 86,420.5 76,308.8 69,767.9
CURRENT ASSETS 19,615.3 19,375.5 19,582.4
CURRENT LIABILITIES 29,739.7 31,349.3 12,828.3
TOTAL DEBT 31,443.1 21,879.1 14,243.4
NET CASH/(DEBT) (20,889.9) (8,628.9) (1,942.2)
Net profit margin (%) 1.3% 13.5% 16.3%
EBITDA margin (%) 18.0% 25.6% 25.0%
Net revenues growth (%) -23.3% 2.0% -15.3%
EBITDA growth (%) -46.1% 4.2% -22.1%
Net profit growth (%) -92.9% -15.4% -26.2%
B. Discussion and analysis of operations
B.1. Results of operations for the year ended December 31, 2017 versus 2016
In Million Pesos 2017 2016 % Change
NET REVENUES 19,258.9 25,094.6 -23.3%
Gaming 17,115.3 23,648.8 -27.6%
Hotel, Food, Beverage & Others 2,850.7 2,626.6 8.5%
Other Income 1,167.0 1,215.5 -4.0%
Promotional Allowance (1,874.1) (2,396.3) -21.8%
GROSS PROFIT 10,165.7 14,478.5 -29.8%
OPERATING PROFIT 1,526.4 4,777.4 -68.0%
NET PROFIT 241.7 3,398.5 -92.9%
EBITDA 3,458.3 6,420.5 -46.1%

- 14 -
Normalized operations for the year ended December 31, 2017 and actual results of 2016.
In Million Pesos 2017 2016
Adjusted NET PROFIT 1,952.9 3,398.5
Adjusted EBITDA 4,670.9 6,420.5 Normalized operations are based on applying VIP win percentage of 2.85% to the VIP volume for the year if the actual win percentage is outside the expected range of 2.7% to 3.0%, applying a win percentage of 29.0% to the Grind volume for the year if the actual win percentages are outside the expected ranges of 27.0% to 33.0%, and applying a win percentage of 7.0% to the Slot volume for the year if the actual win percentage is outside the expected range of 6.8% to 7.2%. Due to the temporary closure of the casino in June 2017, the Company used volume and EBITDA and net income margin run-rate of January to May 2017 in translating the first half. Net Revenues Net revenues for the year ended December 31, 2017 declined to P19,258.9 million due to the June 2, 2017 incident that led to the closure of the gaming area for 27 days and portions of the non-gaming segment. Net revenues for the fourth quarter of 2017 increased by 22.9% compared to the third quarter of 2017 as operations began to ramp up. Promotional allowance for the year ended December 31, 2017 decreased by 21.8% to P1,874.1 million from P2,396.3 million for the same period in 2016; while promotional allowance for the three months ended December 31, 2017 decreased by 3.5% to P533.0 million from P522.6 million in the same period last year. Promotional allowance refers to the fair value of points earned by loyalty card members, prize money for tournaments, and revenue share with junket operators. Promotional allowance as a percent of gaming revenue was 10.9% for the year ended December 31, 2017 and 12.4% for the three months ended December 31, 2017, compared to 10.1% and 9.8%, respectively, for the same periods of 2016. Gaming Revenues Gross gaming revenue for the year ended December 31, 2017 reached P17,115.3 million from P23,648.8 million for the same period of 2016. The decline was due to the temporary closure of the casino in the month of June 2017. Gross gaming revenues for the fourth quarter of 2017 increased by 21.5% to P4,314.4 million compared to P3,551.6 million for the third quarter of 2017. Blended win rate for the year ended December 31, 2017 was 5.6% compared to 5.2% for the same period last year. While the VIP segment’s win rate was 2.8% compared to 3.0% of last year. Overall drop volume for 2017 amounted to P304,532 million versus P453,412 million for 2016. Drop volume for the fourth quarter of 2017 increased by 20.0% compared to the third quarter of 2017. On normalized basis, gross gaming revenues would have ended at P19,300.1 million for the year ended December 31, 2017. Due to the temporary closure of the casino in June 2017, drop volume in the months of January to May 2017 translates into the drop volume run rate for the first half. The table below presents key operating summary of the casino and gaming facilities for the year ended December 31, 2017 and 2016:
Gaming Metrics Six Months Ended
FY 2017 Six Months Ended
FY 2016 Jun 2017 Dec 2017 Jun 2016 Dec 2016
Operating Days 154 184 338 182 184 366
Average Daily Property Visitation 26,585 24,922 25,747 27,331 27,701 27,517

- 15 -
Gaming Metrics Six Months Ended
FY 2017 Six Months Ended
FY 2016 Jun 2017 Dec 2017 Jun 2016 Dec 2016
Average Gaming Units
VIP Tables 129 101 115 138 140 139
Mass Tables 163 124 143 174 172 173
Slots 1,704 1,412 1,558 1,901 1,840 1,871
ETG 193 18 106 210 210 210
Gaming Units (as of period end)
VIP Tables 113 120 120 145 134 134
Mass Tables 96 124 124 169 177 177
Slots 1,395 1,381 1,381 1,871 1,798 1,798
ETG 110 0 0 210 210 210
Drop Volume (in PHP Million)
Total Drop 171,523 133,009 304,532 248,299 205,113 453,412
VIP Tables 107,269 74,778 182,047 173,245 130,309 303,554
Mass Tables 8,364 7,239 15,603 11,760 11,577 23,337
Slots 55,317 50,935 106,253 62,610 62,539 125,149
ETG 572 57 629 684 688 1,372
Win Rate, %
Blended Win Rate 5.4% 5.9% 5.6% 4.8% 5.8% 5.2%
VIP Tables 2.5% 3.1% 2.8% 2.5% 3.6% 3.0%
Mass Tables 30.9% 29.5% 30.3% 24.9% 29.9% 25.8%
Slots 7.0% 6.6% 6.8% 7.0% 6.3% 6.7%
ETG 22.6% 21.4% 22.5% 23.0% 25.4% 24.2% * Average property visitation includes RWM main entrances, Marriott Hotel Manila, Marriott Grand Ballroom, Remington Hotel, House Manila, and Jardin The table below presents the normalized operating summary of the casino and gaming facilities for the year ended December 31, 2017 and actual results of 2016:
Gaming Metrics 2017 2016
Drop Volume (in PHP Million)
Total Drop 337,531 453,412
VIP Tables 202,888 303,554
Mass Tables 17,190 23,337
Slots 116,715 125,149
ETG 738 1,372
Win Rate, %
Blended Win Rate 5.7% 5.2%
VIP Tables 2.8% 3.0%
Mass Tables 30.0% 25.8%
Slots 7.0% 6.7%
ETG 22.6% 24.2% Hotel, Food, Beverage & Others Revenue from Hotel, Food, Beverage and Others increased by 8.5% for the year ended December 31, 2017 to P2,850.7 million compared to P2,626.6 million for the same period of 2016. The increase was primarily due to the P476.5 million and P312.7 million revenue contribution of the Marriott West Wing and the Marriott Grand Ballroom, respectively. And with the Philippines hosting the 31st ASEAN summit in November 2017, overall foot traffic increased during the fourth quarter of 2017. Revenue from Hotel, Food, Beverage and Others contributed 13.5% to gross revenues in 2017. For the three months ended December 31, 2017, revenue from Hotel, Food, Beverage and Others amounted to P810.2 million compared to P840.8 million for the same period in 2016.

- 16 -
All hotels registered high occupancy rates averaging at 79%. Occupancy for the three hotels are as follows:
Maxims at 72%, Marriott at 71% and Remington at 89%.
Other Operating Income
Other operating income for the year ended December 31, 2017 amounted to P1,167.0 million compared to
P1,215.6 million for the same period of 2016. The decline was primarily due to decrease in rental and parking
fees as result of the temporary closure of the Newport Mall in June 2017.
Other operating income for the three months ended December 31, 2017 amounted to P307.4 million compared
to P270.8 million for the same period of 2016.
Tenant count from retail and food and beverage is 91 for the year ended December 31, 2017 compared to 96 for
the same period last year.
Other operating income primarily consists of income from the Newport Performing Arts Theater, cinema,
parking, laundry, spa, and rental income from the mall and commercial office space, and others.
Direct Costs
Direct costs decreased by 14.3% to P9,093.2 million for the year ended December 31, 2017 from
P10,616.1 million for the same period of 2016. This was primarily due to the decrease in gaming license
fees by P1,342.9 million in 2017. Gaming license fees consist of a percentage of gross gaming revenues which
are directly remitted to PACGOR in accordance with Provisional License Agreement.
Direct costs for the three months ended December 31, 2017 decreased by 15.0% to P 2,324.0 million from
P2,733.4 million for the same period in 2016.
Direct costs are costs directly associated with gaming, which include license fees, salaries, wages and employee
benefits of casino employees, entertainment, amusement and recreation costs, complimentary costs and
depreciation of gaming equipment; and costs directly associated with rendering of services for the hotels and its
outlets, which include food and beverage, salaries, wages and benefits of hotel personnel, supplies, parking, and
other related expenses.
Gross Profit
For the year and three months ended December 31, 2017, gross profit amounted to P10,165.7 million and
P2,574.9 million, respectively.
General and Administrative Expenses
General and administrative expenses for the year and three months ended December 31, 2017 decreased by
10.9% to P8,639.3 million from P9,701.1 million, and 3.0% to P2,208.5 million from P2,277.9 million,
respectively, for the same periods of 2016.
The decrease was primarily due to the 38.1% decrease in general and marketing expense, which mainly pertains
to commission paid to junket operators.
Depreciation expense classified as general and administrative expenses increased by 24.0% to P1,505.1 million
for the year ended December 31, 2017 from P1,213.9 million for the same period of 2016. The increase was
primarily due to the full year depreciation for Marriott West Wing which was capitalized in November 2016.
Operating Profit
Operating profit fell to P1,526.4 million for the year ended December 31, 2017 from P4,777.4 million for the
same period of 2016. Operating profit for the fourth quarter of 2017 increased by P439.4 million compared to
the third quarter of 2017.
Non-operating Income and Expenses
Other costs decreased by P248.3 million to P1,066.3 million for the year ended December 31, 2017 from the
P1,314.6 million of the same period in 2016. Other costs for the three months ended December 31, 2017

- 17 -
decreased to P97.6 million compared to P805.7 million for the same period of 2016. The decrease was primarily due to the maturity of the USD300.0 million bond in November 2017 which took away exposure in foreign exchange fluctuation and brought down interest expense. Interest expense decreased by P14.0 million to P686.3 million for the year ended December 31, 2017, from P700.3 million for the same period of 2016. Losses from casualty as a result of the June 2, 2017 incident recognized as of December 31, 2017 amounted to P430.4 million. Profit Before Tax Profit before tax for the year ended December 31, 2017 amounted to P460.1 million. Tax Expense Tax expense for the year ended December 31, 2017 amounted to P218.4 million compared to P64.3 million for the same period of 2016. The increase was due to the expiration of a previously recognized deferred tax asset in 2014. Net Profit Net profit for the year ended December 31, 2017 was P241.7 million. On normalized basis, net profit would have ended at P1,952.9 million for the year ended December 31, 2017. EBITDA The Company’s EBITDA for the year ended December 31, 2017 was P3,458.3 million compared to P6,420.5 million for the same period last year. EBITDA for fourth quarter of 2017 amounted to P869.4 million compared to P401.3 million for the third quarter of 2017.
In Million Pesos 2017 2016
Operating Profit 1,526.4 4,777.4 Depreciation 1,931.9 1,643.1 EBITDA 3,458.3 6,420.5
On normalized basis, EBITDA would have ended at P4,670.9 million for the year ended December 31, 2017. B.2. Results of Operations for the year ended December 31, 2016 versus 2015
In Million Pesos 2016 2015 % Change
NET REVENUES 25,094.6 24,602.1 2.0% Gaming 23,648.8 24,216.7 -2.3% Hotel, F&B 2,626.6 2,468.6 6.4% Other Income 1,215.5 1,034.4 17.5% Promotional Allowances (2,396.3) (3,117.6) -23.1%
GROSS PROFIT 14,478.5 14,111.5 2.6%
OPERATING PROFIT 4,777.4 4,759.0 0.4%
NET PROFIT 3,398.5 4,017.6 -15.4%
EBITDA 6,420.5 6,161.9 4.2% Net Revenues Net revenue increased by P492.5 million to P25,094.6 million in 2016 compared to P24,602.1 million in 2015.

- 18 -
Promotional allowances decreased by 23.1% from P3,117.6 million in 2015 to P2,396.3 million in 2016, primarily due to a decrease in revenue sharing arrangements with junkets. Promotional allowance refers to the relative fair value of points earned by loyalty card members, revenue share and prizes. Gaming Revenues The Company generated gross gaming revenue of P23,648.8 million in 2016 compared to P24,216.7 million in 2015. The Company’s Non-VIP segment drop volume increased by 8.3%, while the drop volume in the VIP segment contracted by 17.4%. Overall drop in 2016 decreased by 10.4% compared to 2015. The Company’s win rate improved to a blended rate of 5.2% compared to the 4.8% registered in 2015. The VIP segment win rate, likewise, improved to 3.0% in 2016 from 2.8% in the previous year. The following table below summarizes key operating results:
Gaming Metrics Six Months Ended
FY 2016 Six Months Ended
FY 2015 June 2016 Dec 2016 June 2015 Dec 2015
Operating Days 182 184 366 181 184 365
Average Daily Property Visitation* 27,331 27,701 27,517 27,406 25,381 26,385
Average Gaming Units VIP Tables 138 140 139 118 138 128 Non-VIP Tables 174 172 173 145 167 156 Slots 1,901 1,840 1,871 1,840 1,846 1,843 ETG 210 210 210 210 210 210
Gaming Units (as of period end) VIP Tables 142 134 134 142 134 134 Non-VIP Tables 169 177 177 169 177 177 Slots 1,830 1,798 1,798 1,830 1,798 1,798 ETG 210 210 210 210 210 210
Drop Volume (in PHP Million) Total Drop 248,299 205,113 453,412 241,492 264,502 505,994
VIP Tables 173,245 130,309 303,554 174,918 192,695 367,612 Non-VIP Tables 11,760 11,577 23,337 10,989 11,713 22,701 Slots 62,610 62,539 125,149 55,018 59,452 114,469 ETG 684 688 1,372 569 643 1,211
Win Rate, % Blended Win Rate 4.8% 5.8% 5.2% 5.2% 4.4% 4.8%
VIP Tables 2.5% 3.6% 3.0% 3.3% 2.4% 2.8% Non-VIP Tables 24.9% 29.9% 25.8% 24.7% 24.8% 24.8% Slots 7.0% 6.3% 6.7% 7.1% 6.7% 6.9% ETG 23.0% 25.4% 24.2% 22.5% 22.5% 22.5%
*Average daily property visitation includes RWM main entrances, Marriott Hotel Manila, Marriott Grand Ballroom, Remington Hotel, House Manila, and Jardin.
Hotel, Food, Beverage & Others Revenue from hotel, food, beverage and others increased by 6.4% to P2,626.6 million in 2016 from P2,468.6 million in 2015. All hotels registered high occupancy rates in 2016 as follows: Maxims at 81%, Remington at 88% and Marriott at 81%. Complimentary and promo rooms for Maxims accounted for 71% of 2016 occupancy versus 64% in 2015. For Remington, complimentary and promo rooms accounted for 53% of occupancy in 2016 compared to 39% in 2015. Food and beverage average revenue per cover increased by 1.0% in 2016, while non-complimentary revenue accounted for 40% of total food and beverage revenue.

- 19 -
Other Operating Income Other operating income increased by P181.1 million to P1,215.5 million in 2016, compared to P1,034.4 million in 2015. The 17.5% increase was driven by higher revenue from theatre operations, mall and miscellaneous income. The retail and F&B tenant space remained at 90, with 96.8% occupancy in 2016. Other operating income primarily consisted of income from Newport Performing Arts Theater, rental income for the mall and commercial office space rentals, income from cinema, laundry, spa and others. Direct Costs Directs costs increased by 1.2% to P10,616.1 million in 2016 compared to P10,490.7 million in 2015. The increase was primarily due to higher casino operating expenses incurred in 2016. Gross Profit Gross profit increased by 2.6% or P367.0 million to P14,478.5 million in 2016 compared to P14,111.5 million in 2015. General and Administrative Expenses General and administrative expenses amounted to P9,701.1 million in 2016 from P9,352.5 million in 2015. The P348.6 million increase was due to (a) full year depreciation for Marriott Grand Ballroom which was capitalized in December 2015; (b) increase in general marketing as a result of change in arrangement with junket operators from revenue sharing last year to the traditional rolling based commission; and (c) settlement of tax assessment from prior years. Operating Profit Operating profit remained flat at P4,777.4 million in 2016 compared to P4,759.0 million in 2015. Non-operating Income and Expenses Finance cost amounted to P1,458.6 million in 2016 compared to P775.4 million in 2015. The increase was due to unrealized foreign exchange losses on the outstanding USD300.0 million bond given the depreciation of the Philippine peso. Finance income decreased by P29.9 million from P116.3 million in 2015 to P86.4 million in 2016. Investment in associate and joint venture resulted to share in net profit amounting to P57.6 million in 2016. Profit Before Tax Profit before tax amounted to P3,462.8 million in 2016, 14.9% lower than the P4,067.0 million in 2015. Net Profit Net profit amounted to P3,398.5 million in 2016. Unrealized foreign exchange losses due to the outstanding bond amounted to P794.1 million. EBITDA EBITDA increased by 4.2% or P258.6 million to P6,420.5 million in 2016 compared to P6,161.9 million in 2015. The increase was due to higher revenue from hotel and other operating income coupled with disciplined cost management implemented during the year. Depreciation, on the other hand, increased from P1,402.9 million in 2015 to P1,643.1 million in 2016 primarily due to certain non-gaming assets becoming fully operational in 2016.
In Million Pesos 2016 2015
Operating Profit 4,777.4 4,759.0 Depreciation 1,643.1 1,402.9 EBITDA 6,420.5 6,161.9

- 20 -
B.3. Liquidity and Capital Resources For the year ended December 31, 2017 and 2016 Total Assets The Company’s total assets increased by 13.3% or P10,111.7 million to P86,420.5 million for the year ended December 31, 2017 from P76,308.8 million at the beginning of the year. Current Assets Cash and cash equivalents decreased by 20.4% or P2,697.0 million to P10,553.2 million as of December 31, 2017 from P13,250.2 million at the beginning of the year. The decrease was primarily due to the acceleration of progress of the Phase 3 development in Site B. Trade and other receivables increased by 69.10% or P2,761.1 million to P6,756.7 million as of December 31, 2017 from P3,995.6 million at the beginning of the year. The increase was primarily due to increase in downpayments made to contractors in line with the ongoing Phase 3 construction amounting to P1,661 million and the recognition of insurance recovery amounting to P762.6 million. Inventories declined by P47.9 million to P126.4 million as of December 31, 2017 from P174.3 million at the beginning of the year. Advances to related parties decreased by 47.1% or P380.4 million to P428.0 million as of December 31, 2017 from P808.4 million at the beginning of the year. Prepayments and other current assets increased by 52.7% or P604.1 million to P1,751.0 million as of December 31. 2017 from P1,147.0 million at the beginning of the year. This is mainly due to increase in prepaid taxes and insurance during the year. Non-Current Assets Property, plant and equipment increased by 18.2% or P9,315.1 million to P60,468.3 million as of December 31, 2017 from P51,153.2 million. The increase was primarily due completion and ongoing construction of various the expansion projects at Site B. As of December 31, 2017, total spent for Phase 3 construction amounted to P19,992.4 million. In April 2017, the Company officially opened RunWay Manila to the public. This is a pedestrian link bridge, which connects Ninoy Aquino International Airport Terminal 3 to Newport City and is open to the public free of charge. Phase 3 which will be named the Grand Wing will comprised of three luxury hotels – Sheraton Manila Hotel, Hilton Manila and Hotel Okura Manila. The new wing will also include a new gaming area, additional retail space and six basement parking decks. The entire project is expected to be completed by the end of 2018. Total Liabilities As of December 31, 2017, total liabilities increased by P10,503.1 million to P42,186.8 million from P31,683.7 million at the beginning of the year. Current Liabilities Trade and other payables increased by P1,170.3 million to P10,145.5 million as of December 31, 2017 from P8,975.2 million at the beginning of the year. This represents trade payables to suppliers, retention payables to contractors, liability for unredeemed gaming points, and unredeemed gaming chips. Loans and borrowings increased to P19,500.0 million from P7,000.0 million at the beginning of the year. This was primarily due to availment of credit facilities from various banks intended for capital expenditure requirements. In November 2017, the Company paid its USD 300.0 million bond as well as derivative liability.

- 21 -
Advances from related parties decreased by P72.8 million to P94.2 million as of December 31, 2017 from P167.0 million at the beginning of the year. Non-Current Liabilities Long term loans and borrowings of the year ended December 31, 2017 amounted to P11,943.1 million after conversion of the Company’s short-term borrowing. Retirement benefit obligation increased by P165.6 million to P328.1 million as of December 31, 2017 from P162.5 million at the beginning of the year. This relates to the defined benefit plan for qualified employees’ retirement benefits. Other non-current liabilities increased by P3.9 million to P175.9 million as of December 31, 2017 from P172.0 million at the beginning of the year. Net Cash/(Debt) The Company’s net debt position amounted to P20,889.9 million as of December 31, 2017 from a net debt position of P8,628.9 million at the beginning of the year, as illustrated below:
In Million Pesos 2017 2016
Total Cash 10,553.2 13,250.2 Total Debt* 31,443.1 21,879.1 Net Cash/(Debt) (20,889.9) (8,628.9) *Total Debt covers interest-bearing loans and borrowings and note payable
Equity Total equity remains relatively flat at P44,233.7 million as of December 31, 2017 from P44,625.1 million at the beginning of the year. For the Year Ended December 31, 2016 and 2015 Total Assets The Company’s total assets increased by 9.4% or P6,540.9 million to P76,308.8 million for the year ended December 31, 2016 compared to P69,767.9 million for year ended December 31, 2015. Current Assets As of December 31, 2016 and 2015, the Company’s cash and cash equivalents were P13,250.2 million and P12,301.2 million, respectively. Trade and other receivables decreased by 33.7% to P3,995.6 million as of December 31, 2016 compared to P6,025.3 million at the beginning of the year primarily due to settlement of downpayment made to various suppliers and contractors. Advances to related parties increased by P619.8 million to P808.4 million as of December 31, 2016 from P188.6 million at the beginning of the year primarily due to recognition of receivable from an associate. Inventories increased by P27.8 million to P174.3 million as of December 31, 2016 from P146.5 million as of December 31, 2015. Prepayments and other current assets increased by 24.6%from P920.7 million at the beginning of the year to P1,147.0 million as of December 31, 2016. Prepayments and other current assets consists of investments in time deposits that are made for a period of 360 days and prepaid taxes, insurances and rentals. Non-Current Assets Property, plant and equipment increased by 24.2% to P51,153.2 million as of December 31, 2016 compared to P41,169.7 million as of December 31, 2015. The P9,983.5 million increase was predominantly is in line with the
- 22 -
construction progress of Phases 2 and 3 projects. Total spent for Phases 2 and 3 as of December 31, 2016 is at P12,990.7 million and P12,274.2 million, respectively. Phase 2 is the expansion of the existing Marriott Hotel Manila through Marriott Grand Ballroom and the Marriott West Wing. The Marriott Grand Ballroom formally opened its doors to the public in March 2015, while the Marriott West Wing formally opened its doors to the public in November 2016 adding 228 rooms to the existing Marriott Hotel Manila. Phase 3 is comprised of three luxury hotels – Sheraton Manila Hotel, Hilton Manila and Maxims II. Phase 3 shall also include a new gaming area, additional retail space and six basement parking decks. The entire Phase 3 is expected to be completed by 2018. Current Liabilities Trade and other payables decreased 6.8% or P654.9 million to P8,969.0 million as of December 31, 2016 from P9,623.9 million as of December 31, 2015. This represents trade payable to suppliers, retention payable to contractors, liability of unredeemed gaming points, and unredeemed gaming chips. As of December 31, 2016, the Company has outstanding fixed and floating rate short term loans with an aggregate principal amount of P7,000.0 million. These short term loans are for general corporate purposes. Advances from related parties decreased by P2,815.6 million to P167.0 million as of December 31, 2016 from P2,982.6 million as of December 31, 2015. The decrease was due to settlement of advances made to a related party for the development of the Entertainment City Project. Bonds payable increased by 6.1% or P857.5 million to P14,879.1 million as of December 31, 2016 from P14,021.6 million at the beginning of the year. This represents the outstanding USD300.0 million bond that will mature on November 2017. As of December 31, 2016, the Company’s derivative liability decreased 46.7% to P327.9 million as of December 31, 2016 from P615.0 million at the beginning of the year as a result of payment made during the year. Non-Current Liabilities Retirement benefit obligation increased by P34.0 million from P128.5 million as of December 31, 2015 to P162.5 million as of December 31, 2016. Other Non-Current Liabilities increased to P172.0 million as of December 31, 2016 from P154.2 million as of December 31, 2015. Net Cash/(Debt) The Company is in a net debt position amounting to P8,628.9 million as of December 31, 2016 as illustrated below:
In Million Pesos 2016 2015
Total Cash 13,250.2 12,301.2 Total Debt* 21,879.1 14,243.4 Net Cash/(Debt) (8,628.9) (1,942.2) *Total Debt covers interest-bearing loans and borrowings and note payable
Equity The Company’s total equity increased by 6.2% or P2,604.7 million to P44,625.1 million as of December 31, 2017 from P42,020.4 at the beginning of the year. The increase was primarily due to the Company’s increase in Retained Earnings from P17,635.8 million at the beginning of the year to P20,250.1 million for the year ended December 31, 2016.

- 23 -
Tax Related Matters The Company is subject to 25% and 15% license fees, in lieu of all taxes, with reference to the income component of the gross gaming revenues, as provided under the Provisional License Agreement with PAGCOR (see Note 21.2). In April 2013, however, the BIR issued RMC 33-2013 declaring that PAGCOR, its contractees and its licensees are no longer exempt from corporate income tax under the National Internal Revenue Code of 1997, as amended. The issue on whether revenues from gaming operations of the Company are subject to income tax by the BIR under the National Internal Revenue Code of 1997 (NIRC), as amended, was settled in the case of Bloomberry Resorts and Hotel, Inc. vs. Bureau of Internal Revenue, G.R. No. 212530, August 10, 2016, where the Supreme Court ruled that: “As the PAGCOR Charter states in unequivocal terms that exemptions granted for earnings derived from the operations conducted under the franchise specifically from the payment of any tax, income or otherwise, as well as any form of charges, fees or levies, shall inure to the benefit of and extend to corporation(s), association(s), agency(ies), or individual(s) with whom the PAGCOR or operator has any contractual relationship in connection with the operations of the casino(s) authorized to be conducted under this Franchise, so it must be that all contractees and licensees of PAGCOR, upon payment of the 5% franchise tax, shall likewise be exempted from all other taxes, including corporate income tax realized from the operation of casinos.” The Motion for Reconsideration filed by the BIR of the August 10, 2016 Resolution was denied with finality in an Order dated November 28, 2016. Prospects for the Future The Company has further undertaken extensive expansion with the development of three new hotel offerings. The Hilton Manila, Sheraton Manila Hotel and Hotel Okura Manila will bring approximately 940 five-star rooms for a truly integrated resorts offering. All three hotels are earmarked for completion by 2018. The new Phase 3 development will house expanded gaming and retail facilities. Looking ahead, the Company’s Phase 4 development will give way to more retail alternatives and other international hotel brands. The diversified integrated resorts operations strategically located across the NAIA continues to attract both domestic and international guests. Item 7. Financial Statements The audited consolidated financial statements meeting the requirements of Securities Regulation Code (SRC) Rule 68, together with Statement of Management’s Responsibility and Auditors’ Report, and supplementary schedules are attached hereto as Exhibit 1 and incorporated herein by reference. The consolidated financial statements have been prepared in compliance with the Philippine Financial Reporting Standards (PFRS), on the historical cost basis except for the measurement of certain financial assets and financial liabilities. The preparation of the consolidated financial statements in compliance with PFRS requires management to make judgments, estimates and assumptions that affect the amounts reported in the consolidated financial statements and related notes. The estimation and judgments are based upon management’s evaluation of relevant facts and circumstances of the financial statements. Actual results may ultimately vary from those estimates. Item 8. Information on Independent Accountant and Other Related Maters Audit and audit-related services In compliance with Securities and Exchange Commission (SEC) Memorandum Circular No. 8, Series of 2003, which was subsequently incorporated in SRC Rule 68, paragraph 3(b)(iv), and the Company’s Manual of Corporate Governance, which require that the Company’s external auditor be rotated or the handling partner changed every five (5) years or earlier, Mr. Renan A. Piamonte of Punongbayan and Araullo (P&A) was designated as handling partner for the audit of the financial statements of the Company starting the year ended December 31, 2016. P&A was also the auditor of the Company from 2009 to 2015.
- 24 -
Tax fees and all other fees There were no separate tax fees billed and no other products and services provided by P&A to the Company for the last two fiscal years. Changes in and disagreements with accountants on accounting and financial disclosure P&A, as principal auditors, issued an unqualified opinion on the consolidated financial statements. There are no disagreements with the auditors on any matter of accounting principles or practices, financial statement disclosure, or auditing scope or procedure, which, if not resolved to their satisfaction, would have caused the auditors to make reference thereto in their reports on the financial statements of the Company and its subsidiaries.
PART III CONTROL AND COMPENSATION INFORMATION Item 9. Directors and Executive Officers of the Issuer Board of Directors and Senior Management The overall management and supervision of the Company is undertaken by the Company’s Board of Directors (the Board or BOD). The Company’s executive officers and management team cooperate with its Board by preparing appropriate information and documents concerning the Company’s business operations, financial condition and results of operations for its review. Pursuant to the Company’s Articles of Incorporation as amended on March 12, 2014, the Board shall consist of seven members, of which two are independent directors. All of the directors were elected at the Company’s annual shareholders meeting on June 10, 2016 and will hold office until their successors have been duly elected and qualified. The table below sets forth each member of the Company’s Board as of December 31, 2017. Name Age Nationality Position Chua Ming Huat 55 Malaysian Chairman and Director Kingson U. Sian 56 Filipino President, Chief Executive Officer and Director Dr. Andrew L. Tan 68 Filipino Director Tan Sri Lim Kok Thay 66 Malaysian Director Jose Alvaro D. Rubio 64 Filipino Director Laurito E. Serrano 57 Filipino Independent Director Enrique M. Soriano III 50 Filipino Independent Director The table below sets forth Travellers’ executive officers in addition to its executive directors listed above as of December 31, 2017. Name Age Nationality Position Stephen James Reilly(1) 51 British Chief Operating Officer Bernard Than Boon Teong(1) 47 Malaysian Chief Financial Officer, Treasurer, and Investor Relations Officer M. Hakan Dagtas(1) 49 Turkish Chief Gaming Operations and Marketing Officer and Chief International Gaming Marketing Officer __________________________________________________________________ (1) Engaged as consultants pursuant to an operations and management agreement between Star Cruises Hong Kong
Management Services (Philippines), Inc and the Company.

- 25 -
Name Age Nationality Position Ma. Georgina A. Alvarez 47 Filipino Corporate Information Officer, Chief Legal and Corporate Services Officer, and Assistant Corporate Secretary Stanley Chee Khoon Fong(1) 56 Malaysian Chief Surveillance & Systems Officer Ravi D. Ganesan(1) 51 Malaysian Chief Resorts Administration and Training Officer Randy Reyes 44 Filipino Chief Technology Officer Allan Martin L. Paz 46 Filipino Chief Integrated Marketing Officer Mary Ann E. Moreno 49 Filipino Senior Director for Gaming Treasury Carlito B. Banaag 53 Filipino Director for Audit & Risk Management Emmanuel C. Paras 68 Filipino Corporate Secretary __________________________________________________________________ (1) Engaged as consultants pursuant to an operations and management agreement between Star Cruises Hong Kong
Management Services (Philippines), Inc and the Company.
The business experience for the past five years of each of our directors and key executive officers is set forth below. Chua Ming Huat Director and Chairman Mr. David Chua Ming Huat was appointed Chairman and Chief Executive Officer of the Company in 2008. In October 2014, Mr. David Chua Ming Huat ceased the position Chief Executive Officer. He was the former President of Genting Hong Kong Limited (GHK) and was also a director of Norwegian Cruise Line Holdings Ltd., a company listed on the NASDAQ Global Select Market. Prior to that, he held key management positions in various international securities companies in Malaysia, Singapore and Hong Kong with extensive knowledge in the management of securities, futures and derivatives trading, asset and unit trust management, corporate finance and corporate advisory business. He was a director and member of the Listing Committee of the MESDAQ market of Bursa Malaysia Securities Berhad. He has a Bachelor of Arts degree in Political Science and Economics from the Carleton University in Ottawa, Canada. Kingson U. Sian Director, President and Chief Executive Officer Mr. Kingson Uy Shiok Sian was promoted to Chief Executive Officer in October 2014. He was appointed Director and President of the Company in 2008. Mr. Sian has also been President and Director of AGI since February 2007. He is currently a member of the board and executive director of Megaworld Corporation. Mr. Sian is concurrently the Chairman and President of Prestige Hotels & Resorts, Inc.. He graduated from the University of the Philippines with a Bachelor of Science degree in Business Economics and has a Masters Degree in Business Administration for Finance and Business Policy from the University of Chicago. Dr. Andrew L. Tan Director Dr. Andrew L. Tan was appointed a Director of the Company in 2008. He pioneered the live-work-play-learn model in the real estate industry through development of integrated township communities, fueling the growth of the business process outsourcing (BPO) industry, food and beverage, and quick service restaurants industries. Among the positions previously and currently held by Dr. Tan are: Chairman and CEO of AGI, and Global-Estate Resorts, Inc.; Chairman, President and CEO of Megaworld Corporation; Chairman of Empire East Land Holdings, Inc., Emperador Inc., Suntrust Properties, Inc., Emperador Distillers, Inc., Alliance Global Brands, Inc., and Megaworld Foundation, Inc.; Vice Chairman and Treasurer of Golden Arches Development Corporation and Golden Arches Realty Corporation.

- 26 -
Dr. Tan graduated magna cum laude from the University of the East with a Bachelor of Science degree in Business Administration. In 2011, Dr. Tan was conferred by the University of the East the Degree of Doctor of Humanities, honoris causa. Tan Sri Lim Kok Thay Director Tan Sri Lim Kok Thay was appointed a Director of the Company in 2009. Tan Sri Lim spearheads the Genting Group, a Malaysian based conglomerate and one of the most dynamic companies in this region. Since his appointment as a director of Genting Berhad in August 1976 and re-designation as the Chairman and Chief Executive of Genting Berhad in July 2007, he has expanded the Genting Group’s presence globally and his commitment to excellence, innovation and growth has resulted in the birth of premier global leisure brands. This includes Resorts World Genting, the Genting Group’s prime leisure brand in Malaysia; the Burswood International Resort & Casino in Perth; the Adelaide Casino in South Australia; the Lucayan Beach Resort & Casino in the Bahamas; the Subic Bay Resort & Casino in the Philippines; and Resorts World Sentosa in Singapore, an award-winning destination resort and one of the largest integrated resort destinations in Asia; and the Genting UK Plc, one of the leading casino operators in the UK with over 40 casinos. Tan Sri Lim pioneered the Asian cruise industry by founding Star Cruises in the 1990s and subsequently expanded Star Cruises’ focus from sea to land-based operations. As an entrepreneur, Tan Sri Lim focuses on innovation, re-invention and redefining the leisure and hospitality industry. He has led the Genting Group to develop prominent consumer brands in the leisure and hospitality sector, such as “Resorts World,”, “Maxims,”, “Crockfords,”, “Crystal Cruises”, “Dream Cruises”, “Star Cruises” and “Zouk”. Jose Alvaro D. Rubio Director Mr. Jose Alvaro D. Rubio was appointed Director of the Company in 2009. Mr. Rubio was Senior Vice President at Philippine National Bank (“PNB”) and has over 35 years of banking industry experience, including various positions in international banking, remittance, budgeting, corporate planning, controllership, systems design/improvement, branch banking, audit and lending operations including the head of the corporate banking group at PNB, overseeing the financing activities for major corporate accounts in areas including real estate, construction, telecommunications, power and energy, manufacturing, hotels, tourism and services. He was a former member and Director of the Bank Administration Institute of the Philippines, an association of local and foreign banks. Mr. Rubio has a Bachelor of Science in Business Administration in Accounting from the University of the East in Manila (cum laude) and a Certified Public Accountant. Laurito E. Serrano Independent Director Mr. Laurito E. Serrano was appointed Director of the Company on June 8, 2013. He is concurrently a director in 2GO Group, Inc., Philippine Veterans Bank, Atlas Consolidated Mining Corporation, Axelum Resources Corp., Pacific Online Systems Corporation, among other entities. Mr. Serrano's professional practice involves financial and similar advisory work involving transaction structuring, public offerings, listings of shares, asset securitization and monetization, work-out deals, project studies, business acquisitions and debt and equity capital-raisings. He was likewise a partner in the Corporate Finance Consulting Group of SGV & Co. from 1992 to 1997 and worked in the Audit and Business Advisory Group of SGV & Co. as well from 1980-1992. Mr. Serrano graduated cum laude from the Polytechnic University of the Philippines, where he obtained his Bachelor of Science degree in Commerce. He is a Certified Public Accountant. He also obtained his Master’s degree in Business Administration from the Harvard Business School in Boston, Massachusetts, U.S.A. Enrique M. Soriano III Independent Director Professor Enrique Soriano III was appointed Director of the Company on October 30, 2013. He is a World Bank/IFC consultant, International Family Business Coach, book author, professor of Global Marketing, at Ateneo Graduate School of Business, Dean of School of Business, Accountancy and Real Estate at Manuel L.

- 27 -
Quezon University, and a Senior Fellow at the IPMI International Business School in Jakarta, Indonesia. He is also the Executive Director of the Wong and Bernstein (W+B) Advisory Group, an Asia Pacific based business advisory firm whose clients range from Asia’s Top 500 corporations to the region’s small and medium enterprises. As a Business Coach through W+B's Family Enterprise Unit, he does extensive collaborative work with leading Family Advisory Groups based in Cambridge, Massachusetts. His advocacy and academic work related to Strategic Management and Family Business Governance has made him a sought after advisor and resource speaker in international conferences in the US, Europe, Singapore, Malaysia, Indonesia, Vietnam and China. As an educator and business mentor, he has helped and re-engineered dozens of companies to growth and profitability. He writes weekly columns in newspapers and business magazines in the Philippines and in a leading Asian-American Newspaper in the US. He holds a B.A., MBA and Doctorate units from the University of the Philippines and De La Salle University and pursued Executive Education at the National University of Singapore Business School. Stephen James Reilly Chief Operating Officer Mr. Stephen James Reilly has served as the Chief Operating Officer of the Company since January 1, 2013 and has served as Executive Vice President of the Company since November 2011. Mr. Reilly is responsible for the day to day operations and projects of the Company. Mr. Reilly has also served as Country Head (Philippines) and Senior Vice President of GHK Group beginning in November 2011 and was responsible for the regional operating headquarters and GHK Group support services. Mr. Reilly joined GHK Group in January 1995, initially in the Surveillance Department where he was promoted to Director of Surveillance in 1997 and Vice President of Surveillance in 2003. Prior to joining the Company, Mr. Reilly had ten years of experience working in the United Kingdom, where he held the positions of Chief Security Officer and Surveillance Officer in London casinos, responsible for the security and surveillance of gaming operations. Bernard Than Boon Teong Chief Financial Officer, Treasurer, and Investor Relations Officer Mr. Bernard Than Boon Teong is the Chief Financial Officer and Treasurer of the Company. He was appointed as Investor Relations Officer on May 30, 2015. Prior to becoming Chief Financial Officer, he held the position of Vice President for Treasury. He has over 18 years of working experience in external audit, hospitality industry and casino/ gaming/ cruise line industries. Mr. Than held various positions throughout his career with Star Cruises from 1997 to 2008, starting as Accountant before being promoted to Assistant Controller, Controller, Director, then AVP. He was responsible for introducing a Computerized Tracking Program for the calculation of VIP players, level of gaming, and calculation of commission. He earned his business degree from Monash University in Melbourne, Australia. M. Hakan Dagtas Chief Gaming Operations and Marketing Officer Mr. M. Hakan Dagtas is the Chief Gaming Operations and Marketing Officer of the Company. He has over 24 years of working experience in the hospitality industry and casino/gaming/cruise line industries. Mr. Dagtas served under various capacities throughout his career with Star Cruises from 1996 to 2008 in Hong Kong, Singapore, Malaysia and Thailand. He started as Inspector and was promoted to Shift Manager, Assistant Casino Manager and Casino Manager of different vessels of Star Cruises. He was in charge of the entire training team for the biggest ship of the fleet. He planned, organized and conducted several new games, upgrades, and service related courses. He graduated from the School of Tourism and Hotel Management of Cukurova University.

- 28 -
Ma. Georgina A. Alvarez Corporate Information Officer, Chief Legal and Corporate Services Officer, and Assistant Corporate Secretary Atty. Ma. Georgina Alvarez is the Corporate Information Officer, Chief Legal and Corporate Services Officer, and Assistant Corporate Secretary of the Company. She oversees the following departments: Legal & Corporate Affairs, Human Resources, Administration & Training, Audit & Risk Management and Security, Environment and Business Continuity. Prior to joining the Company, Atty. Alvarez was the Senior Vice President for Legal & Corporate Services of Global-Estates Resort, Inc. She worked for CJH Development Corporation from 1998 to 2008, her last position being Senior Vice President for Legal & Corporate Services. Atty. Alvarez started her career with Angara Abello Concepcion Regala & Cruz Law Offices as a litigation lawyer from 1995 to 1998. Atty. Alvarez graduated second in rank from the San Beda College of Law and earned with distinction her Masters in Management Major in Industrial Relations at the University of the Philippines. She obtained a Bachelor of Science degree with a Commerce Major in Economics and Marketing from Saint Louis University. Stanley Chee Khoon Fong Chief Surveillance & Systems Officer Mr. Stanley Chee is the Chief Surveillance & Systems Officer of the Company. He is responsible for the installation of a state-of-the-art digital CCTV system equipped with over 2,500 cameras, and the set-up of a Las Vegas-style casino surveillance monitoring room. Mr. Chee has over 27 years of casino experience with an understanding of the Asian gaming environment and popular table games, having worked at Star Cruises before joining the Company, serving Director of Surveillance and specializing in the operation of numerous ship-based casino surveillance monitor rooms. Ravi D. Ganesan Chief Resorts Administration and Training Officer Mr. Ravi Ganesan is the Chief Resorts Administration and Training Officer of the Company. He has approximately 30 years of working experience in the casino/gaming/cruise line industries. Mr. Ganesan graduated from TAR College with a Course in Matriculation. Allan Martin L. Paz Chief Integrated Marketing Officer Mr. Allan Martin L. Paz is the Chief Integrated Marketing Officer of the Company. He has over 20 years of extensive experience and background in professional integrated communication, advertising and marketing. In 2009, Mr. Paz worked as Client Service Director for DDB Worldwide. Mr. Paz received an A.B. degree in Communication Arts, with an emphasis on Advertising/Marketing from the University of Santo Tomas. Mary Ann E. Moreno Senior Director for Gaming Treasury Ms. Mary Ann Moreno is Senior Director for Gaming Treasury of the Company. She has over 20 years of experience in the casino/gaming industry. Ms. Moreno graduated from Polytechnic University of the Philippines with a Bachelor of Science degree with a major in Computer Data Processing Management. Carlito B. Banaag Director for Audit & Risk Management Mr. Carlito B. Banaag was appointed Director for Audit & Risk Management for Resorts World Manila’s Audit and Risk Management Department in July 2010. Mr. Banaag was previously the Operational Risk Management Officer at China Banking Corporation, where he participated in risk awareness campaigns and bank personnel training. He has served as Internal Audit Head for Philippine Deposit Insurance Corporation and as Risk Management/Compliance Officer for several private banks. He is a Certified Public Accountant with a bachelor’s degree in Accountancy from the Polytechnic University of the Philippines.
- 29 -
Emmanuel C. Paras Corporate Secretary
Atty. Emmanuel C. Paras is the Corporate Secretary of the Company. He is a partner at Sycip, Salazar, Hernandez & Gatmaitan Law Offices. Atty. Paras has solid experience in real estate, mergers and acquisitions, securities regulation, foreign investments, joint ventures, corporate restructuring and reorganization, and commercial law. Atty. Paras graduated from the Ateneo de Manila University Law School and was admitted to the Philippine Bar in 1977. He obtained a Bachelor of Arts degree in Economics and a Bachelor of Science degree in Accounting from De La Salle University.
Significant Employees
The Company does not have significant employees, i.e., persons who are not executive officers but expected to make significant contribution to the business.
Family Relationships
There are no family relationships between any Directors and any members of the Company’s senior management as of the date of this report.
Involvement in Certain Legal Proceedings
As of December 2017, to the best of the Company’s knowledge and belief and after due inquiry, none of the Company’s directors, nominees for election as director, or executive officer have in the five year period prior to the date of this Report: (1) had any petition filed by or against any business of which such person was a general partner or executive officer either at the time of the bankruptcy or within a two-year period of that time; (2) convicted by final judgment in a criminal proceeding, domestic or foreign, or have been subjected to apending judicial proceeding of a criminal nature, domestic or foreign, excluding traffic violations and other minoroffenses; (3) subjected to any order, judgment, or decree, not subsequently reversed, suspended or vacated, ofany court of competent jurisdiction, domestic or foreign, permanently or temporarily enjoining, barring,suspending or otherwise limiting their involvement in any type of business, securities, commodities or bankingactivities; or (4) found by a domestic or foreign court of competent jurisdiction (in a civil action), to have violateda securities or commodities law or regulation and the judgment has not been reversed, suspended, or vacated.
Item 10. Executive Compensation
Compensation
The following are the Company’s President and four most highly compensated executive officers for the year ended December 31, 2017:
Name PositionSian, Kingson Uy Shiok President and Chief Executive Officer Alvarez, Ma. Georgina Aragon Chief Legal and Corporate Services Officer Bernabe, Ethel Asido Senior Director for Gaming Operations Moreno, Mary Ann Encabo Senior Director for Gaming Treasury Paz, Allan Martin Liwag Chief Integrated Marketing Officer
The following table identifies and summarizes the aggregate compensation of the Company’s President and the four most highly compensated executive officers of the Company in 2015, 2016 and 2017.
Year Total(1) President and the four most highly compensated executive officers 2015 44,136,201 named above 2016 48,579,897
2017 48,326,532

- 30 -
Aggregate compensation paid to all other officers as a group unnamed 2015 291,006,226 2016 276,132,658 2017 269,730,605
Note: Includes salary, bonuses and other income.
Standard Arrangements Other than payment of reasonable per diem as may be determined by the Board for every meeting, there are no standard arrangements pursuant to which directors of the Company are compensated, or were compensated, directly or indirectly, for any services provided as a director and for their committee participation or special assignments for 2011 up to the present. Other Arrangements There are no other arrangements pursuant to which any director of the Company was compensated, or to be compensated, directly or indirectly, during 2017 for any service provided as a director. Employment Contracts The Company has no special employment contracts with the named executive officers. Warrants and Options Outstanding There are no outstanding warrants or options held by the President and CEO, the named executive officers, and all officers and directors as a group. Item 11. Security Ownership of Certain Beneficial Owners and Management Security Ownership of Certain Record and Beneficial Owners of more than 5% of the Company’s voting securities as of December 31, 2017.
Name and Address of
Record Owners
Name of Beneficial Owner and Relationship
with Record Owner
Citizenship
No. of Common Shares Held
No. of Preferred B Shares Held
Total No. of Shares Held
% of Total Outstanding
Shares
Adams Properties, Inc., 20/F IBM Plaza Bldg., Eastwood City, Bagumbayan, Quezon City, Philippines
N/A Filipino 3,539,750,000 8,333,333,333 11,873,083,333 46.10%
Alliance Global Group, Inc., 20/F IBM Plaza Bldg., Eastwood City, Bagumbayan, Quezon City, Philippines
N/A Filipino 3,957,112,838 – 3,957,112,838 15.36 %
Star Cruises Philippines Holdings B.V.,
N/A Dutch 2,831,799, 980 1,666,666,667 4,498,466,667 17.47%

- 31 -
Name and Address of
Record Owners
Name of Beneficial Owner and Relationship
with Record Owner
Citizenship
No. of Common Shares Held
No. of Preferred B Shares Held
Total No. of Shares Held
% of Total Outstanding
Shares
Herikerbergweg 238, Luna Arena, 1101CM, Amsterdam, Zuidoost, The Netherlands Asian Travellers, Ltd., Officers of Portcullis TrustNet (BVI) Limited, Portcullis TrustNet Chambers, P.O., Box 3444, Road Town Tortola, British Virgin Islands
N/A British Indian
1,784,034,000 – 1,784,034,000 6.93%
As of December 31, 2017, the Company’s level of foreign ownership is 31.28% of its equity. Security Ownership of Directors and Officers as of December 31, 2017 Title of Class Name of Beneficial Owner Amount and Nature of
Beneficial Ownership Citizenship % of Total
Outstanding Shares
Common Tan, Andrew L. (Director)
1,000 shares (direct) Filipino Nil
Common Sian, Kingson Uy Shiok (President/Chief Executive Officer/Director)
1,000 shares (direct) Filipino Nil
Common Lim, Tan Sri Kok Thay (Director)
1,000 shares (direct) Malaysian Nil
Common Chua, Ming Huat (Chairman/Director)
1,000 shares (direct) Malaysian Nil
Common Rubio, Jose Alvaro D. (Director)
51,000 shares (direct) Filipino Nil
Common Serrano, Laurito E. (Independent Director)
1,000 shares (direct) Filipino Nil
Common Soriano, Enrique (Independent Director)
1,000 shares (direct) Filipino Nil
Common
Reilly, Stephen James (Chief Operating Officer)
22,100 shares (direct)
British
Nil
Total: 79,100 shares
Voting Trust Holders of 5% or More To the best of the Company’s knowledge and belief, there were no persons holding more than 5% of a class of shares of the Company under a voting trust or similar agreement as of the date of this report. Change in Control As of the date of this report, there are no arrangements which may result in a change in control of the Company.

- 32 -
Item 12. Certain Relationships and Related Transactions Except for the material related party transactions described in the notes to the consolidated financial statements of the Company for the years 2017 and 2016 (please see as filed elsewhere in here), there has been no material transaction during the last two years, nor is there any material transaction currently proposed, to which the Company was or is to be a party, in which any director or executive officer, any nominee for election as director, stockholder of more than ten percent (10%) of the Company’s voting shares, and any member of the immediate family (including spouse, parents, children, siblings, and in-laws) of any such director or officer or stockholder of more than ten percent (10%) of the Company’s voting shares had or is to have a direct or indirect material interest. The Company has no transaction for the covered period with parties that fall outside the definition of “related parties” under PAS 24, Related Party Disclosures, but with whom the Company or its related parties has a relationship that enables the parties to negotiate terms of material transactions that may not be available from other, more clearly independent parties on an arm’s length basis.
PART IV – CORPORATE GOVERNANCE
Item 13. Corporate Governance Please refer to the attached ACGR.
PART V - EXHIBITS AND SCHEDULES Item 14. Exhibits and Reports on SEC Form 17-C
a) Exhibits
Exhibit No. Description of Exhibit 1 Audited Consolidated Financial Statements as of December 31, 2017 and
2016
b) Reports on SEC Form 17-C The following reports have been submitted by the Company during and subsequent to 2017 through official disclosure letters:
Date Disclosures 16 January 2017 Quarterly Summary of Application of Proceeds 16 January 2017 Annual Summary of Application of Proceeds
7 March 2017 Notice on Investors’ Briefing on 16 March 2017 16 March 2017 Press Release - Travellers' FY 2016 EBITDA rise to P6.4 billion 30 March 2017 Clarification of News Article posted in Business World online 31 March 2017 Compliance Report on Corporate Governance
10 April 2017 Notice of Annual Stockholders' Meeting 9 May 2017 Declaration of Cash Dividends
15 May 2017 List of Stockholders as of Record Date, 15 May 2017 15 May 2017 Press Release - Travellers’ 1Q EBITDA hits P1.4billion 31 May 2017 Updated Annual Corporate Governance Report (ACGR) 5 June 2017 Postponement of Annual Stockholders' Meeting 6 June 2017 Press Release - Official Statement of Resorts World Manila

- 33 -
Date Disclosures 6 June 2017 Press Release - SECOND OFFICIAL STATEMENT OF TRAVELLERS
INTERNATIONAL HOTEL GROUP, INC. 14 June 2017 TIHGI Disclosure re Suspension of Provisional License 14 June 2017 Reply to Exchange Query: Possible Effects of PAGCOR Suspension 30 June 2017 TIHGI Disclosure re: PAGCOR Lifting of Suspension Order of
Provisional License 30 June 2017 Resorts World Manila resumes gaming operations
14 August 2017 Travellers announces 1H 2017 results 10 November 2017 Press Release - Travellers announces nine months 2017 results
9 January 2018 Travellers formalizes partnership with Hotel Okura
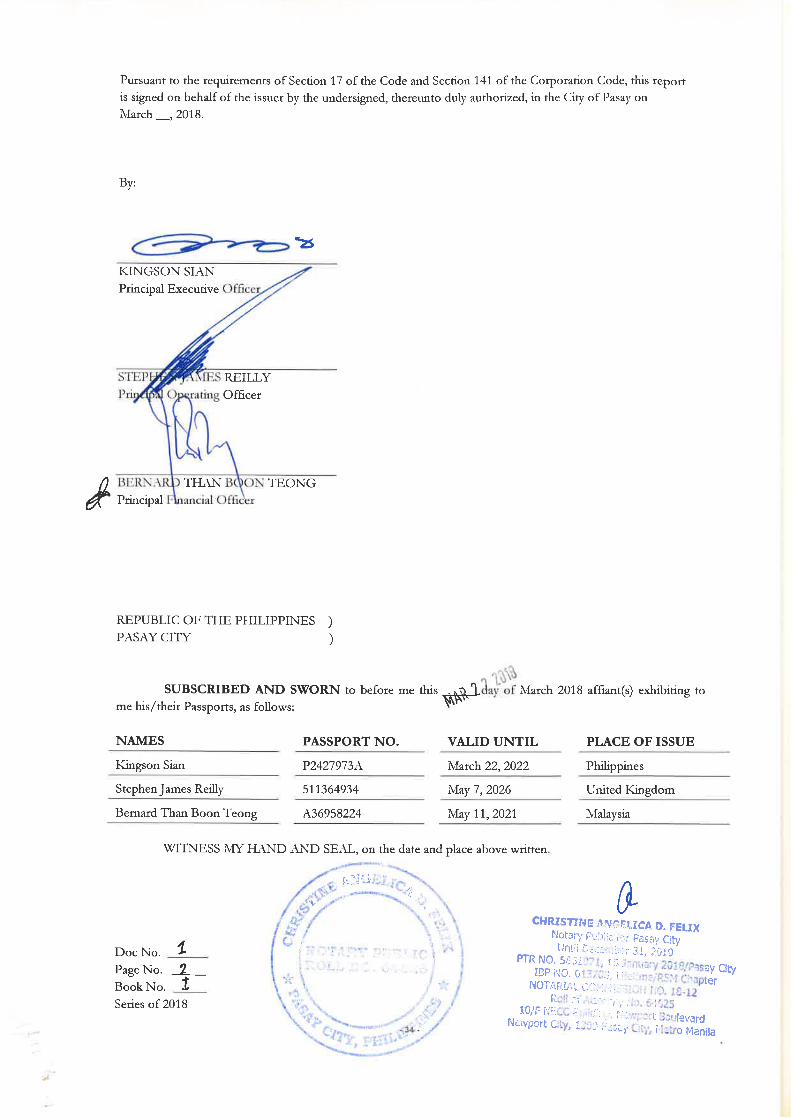


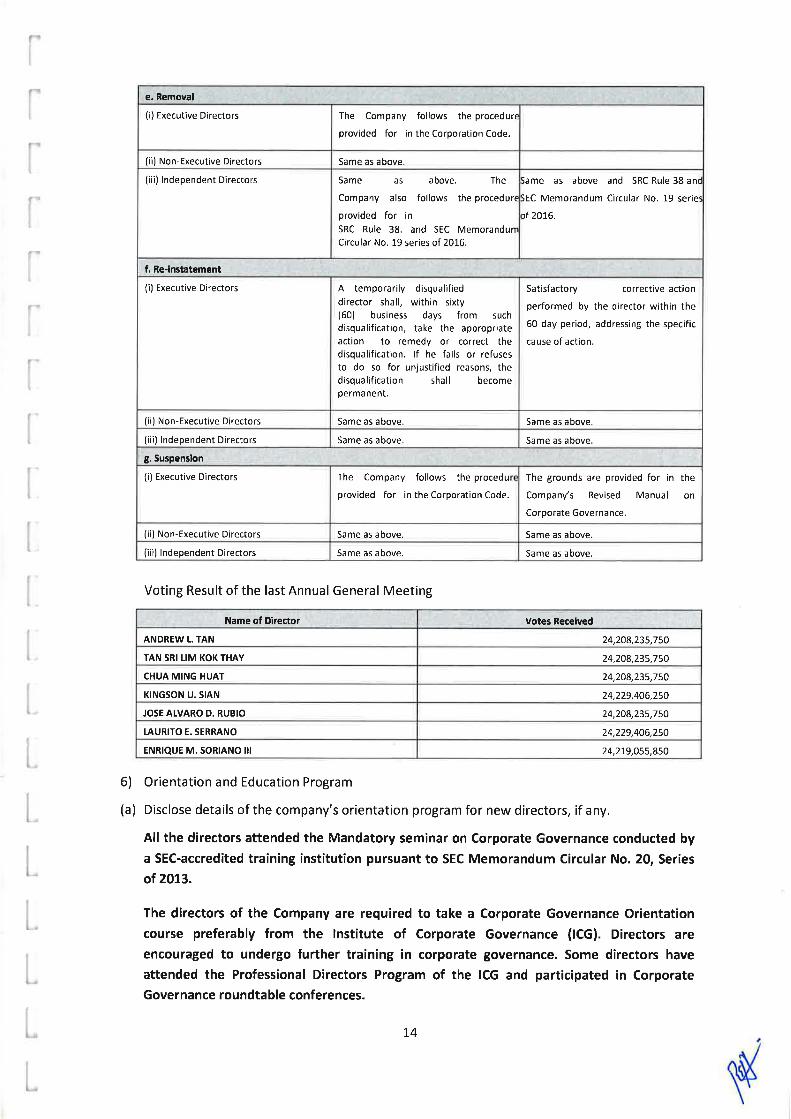

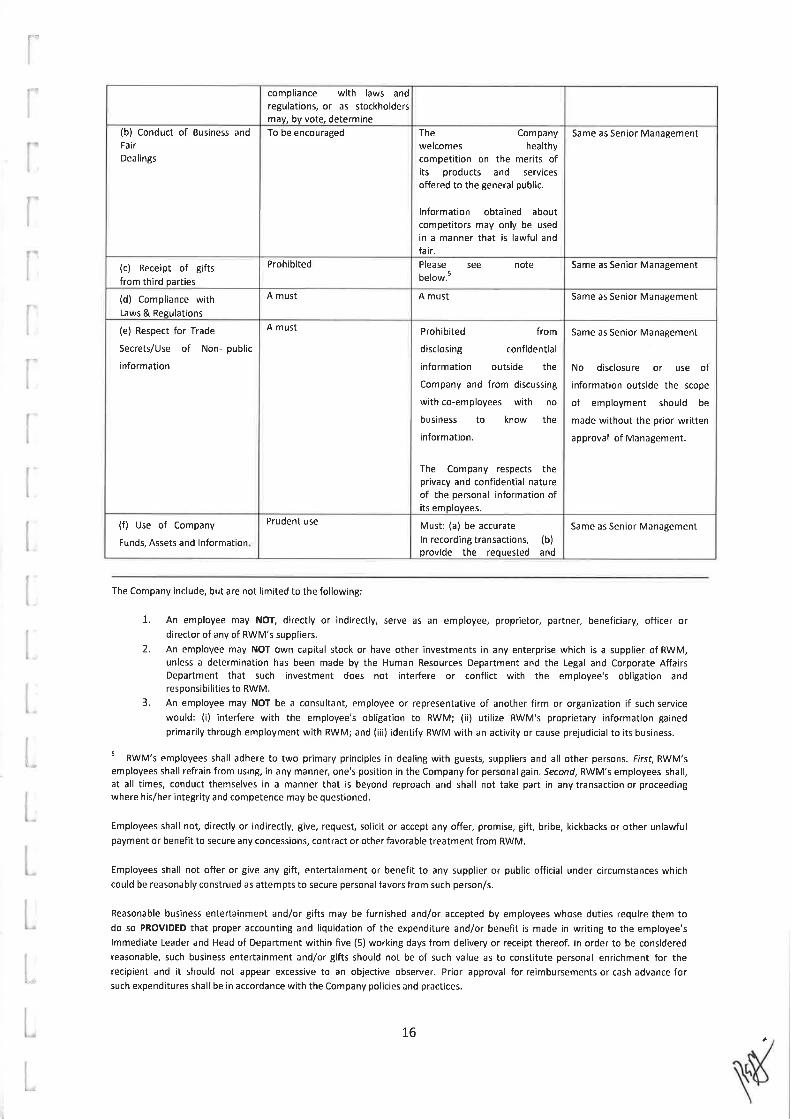


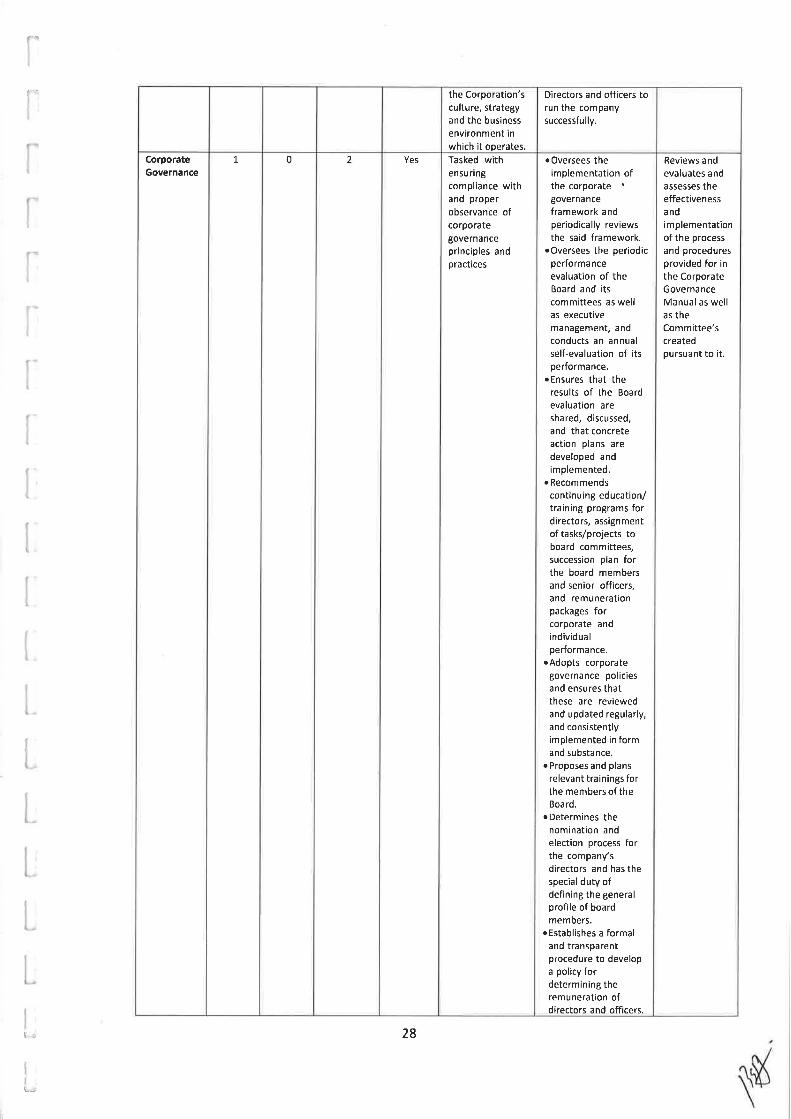


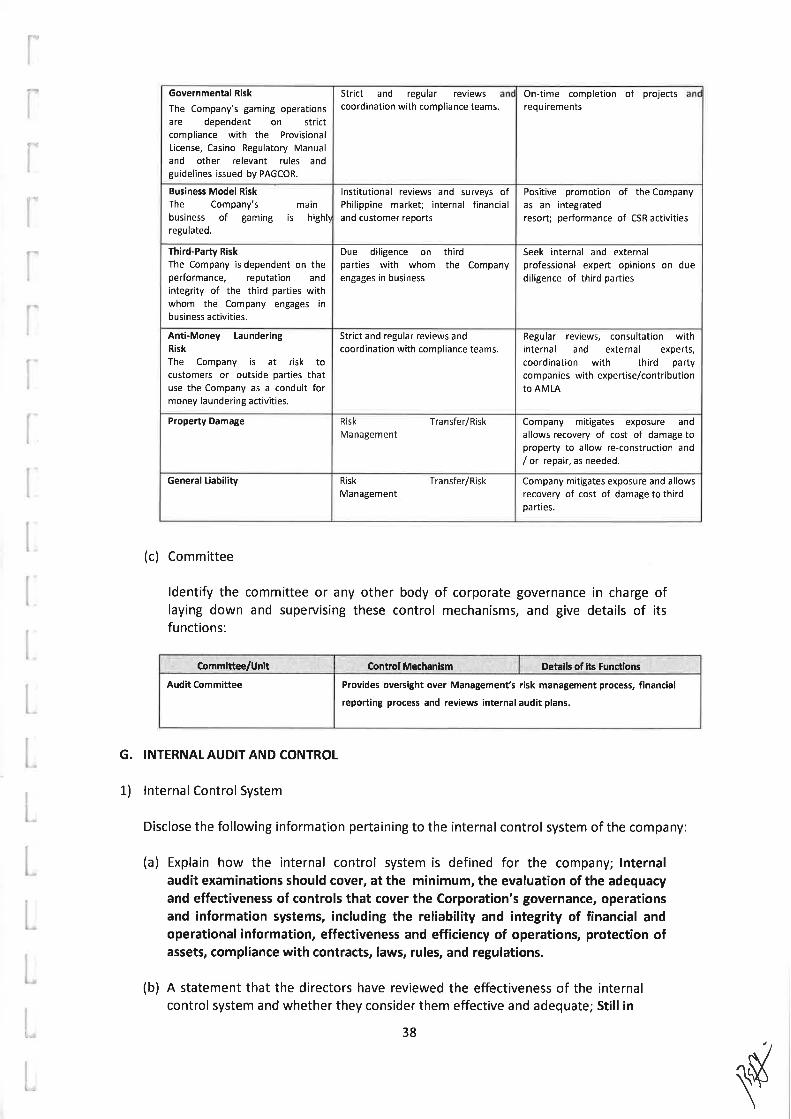


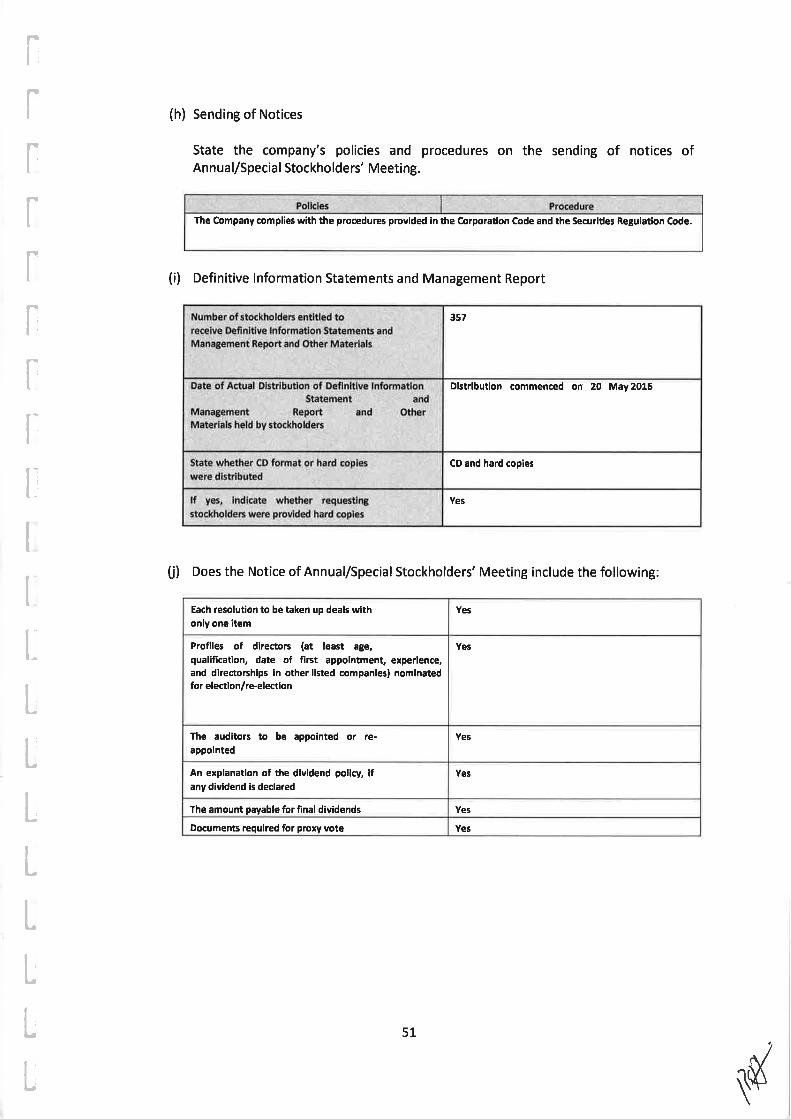


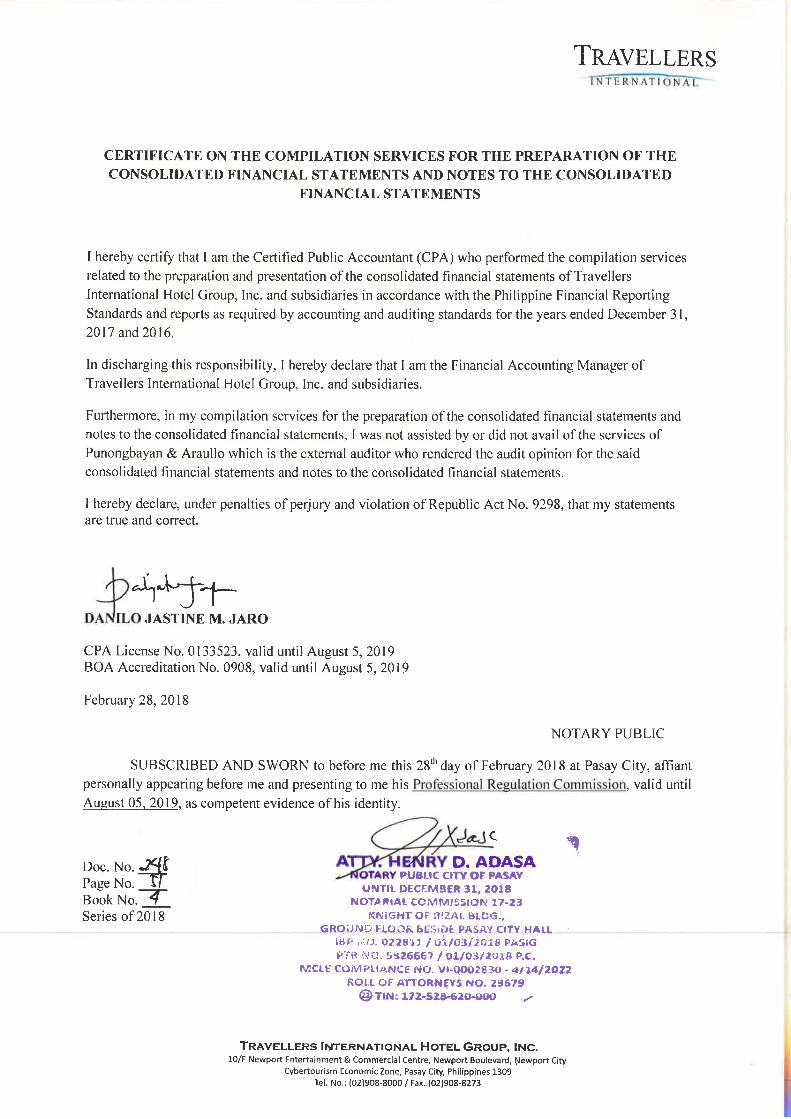

Notes 2017 2016
CURRENT ASSETS
Cash and cash equivalents 5 10,553,173,676 P 13,250,208,941 P
Trade and other receivables 6 6,756,696,394 3,995,565,762
Advances to related parties 22 427,980,591 808,425,160
Inventories 7 126,422,720 174,292,740
Prepayments and other current assets 8 1,751,032,789 1,146,957,413
Total Current Assets 19,615,306,170 19,375,450,016
NON-CURRENT ASSETS
Available-for-sale financial assets 27 78,200,000 69,900,000
Investments in associate and joint venture 9 1,662,915,980 1,472,826,151
Advances for future investment 10 1,556,429,882 968,194,588
Property and equipment - net 11 60,468,277,940 51,153,214,272
Investment property - net 12 1,419,887,463 1,482,632,970
Deferred tax assets 21 32,431,308 164,549,627
Other non-current assets - net 13 1,587,002,903 1,622,022,372
Total Non-current Assets 66,805,145,476 56,933,339,980
TOTAL ASSETS 86,420,451,646 P 76,308,789,996 P
CURRENT LIABILITIES
Interest-bearing loans and borrowings 14 19,500,000,000 P 7,000,000,000 P
Trade and other payables 15 10,145,512,573 8,975,248,288
Advances from related parties 22 94,204,942 167,039,625
Notes payable 16 - 14,879,062,940
Derivative liability 16 - 327,939,175
Total Current Liabilities 29,739,717,515 31,349,290,028
NON-CURRENT LIABILITIES
Interest-bearing loans and borrowings 14 11,943,147,332 -
Retirement benefit obligation 20 328,065,227 162,480,247
Other non-current liabilities 15 175,863,371 171,957,924
Total Non-current Liabilities 12,447,075,930 334,438,171
Total Liabilities 42,186,793,445 31,683,728,199
EQUITY
Equity attributable to parent company 23
Capital stock 10,000,000,000 10,000,000,000
Additional paid-in capital 22,417,157,066 22,417,157,066
Treasury shares, at cost 8,324,412,515 )( 8,324,412,515 )(
Revaluation reserves 50,775,747 53,642,311
Retained earnings 19,871,007,620 20,250,091,757
Total equity attributable to shareholders
of the parent company 44,014,527,918 44,396,478,619
Non-controlling interests 2, 9 219,130,283 228,583,178
Total Equity 44,233,658,201 44,625,061,797
TOTAL LIABILITIES AND EQUITY 86,420,451,646 P 76,308,789,996 P
DECEMBER 31, 2017 AND 2016
TRAVELLERS INTERNATIONAL HOTEL GROUP, INC. AND SUBSIDIARIES
(A Subsidiary of Alliance Global Group, Inc.)
CONSOLIDATED STATEMENTS OF FINANCIAL POSITION
(Amounts in Philippine Pesos)
A S S E T S
LIABILITIES AND EQUITY
See Notes to Consolidated Financial Statements.

Notes 2017 2016 2015
NET REVENUES
Gaming 2 17,115,322,152 P 23,648,754,406 P 24,216,681,861 P
Non-gaming:
Hotel, food, beverage and others 2 2,850,695,985 2,626,607,716 2,468,610,922
Other operating income - net 18 1,166,998,511 1,215,555,841 1,034,396,124
21,133,016,648 27,490,917,963 27,719,688,907
Less promotional allowances 2 1,874,089,153 2,396,289,323 3,117,567,390
19,258,927,495 25,094,628,640 24,602,121,517
DIRECT COSTS 17 9,093,211,903 10,616,130,623 10,490,666,045
GROSS PROFIT 10,165,715,592 14,478,498,017 14,111,455,472
GENERAL AND ADMINISTRATIVE EXPENSES 17 8,639,316,326 9,701,071,386 9,352,463,240
OPERATING PROFIT 1,526,399,266 4,777,426,631 4,758,992,232
OTHER INCOME (CHARGES)
Finance costs 19 844,457,539 )( 1,458,618,238 )( 775,371,564 )(
Losses from casualty, net of insurance claims 24 430,354,462 )( - -
Finance income 19 168,416,307 86,434,568 116,287,960
Share in net profit (loss) of an associate and joint venture 2, 9 40,089,829 57,598,061 32,929,706 )(
1,066,305,865 )( 1,314,585,609 )( 692,013,310 )(
PROFIT BEFORE TAX 460,093,401 3,462,841,022 4,066,978,922
TAX EXPENSE 21 218,395,439 64,314,408 49,370,190
NET PROFIT 241,697,962 3,398,526,614 4,017,608,732
OTHER COMPREHENSIVE INCOME (LOSS)
Item that will not be reclassified
subsequently to profit or loss
Actuarial gains (losses) on remeasurement of
retirement benefit obligation 20, 23 7,373,913 )( 6,866,435 )( 21,946,326
Tax expense 21, 23 3,792,651 )( 5,426,341 )( 3,454,432 )(
11,166,564 )( 12,292,776 )( 18,491,894
Item that will be reclassified
subsequently to profit or loss
Net unrealized fair value gains
on available-for-sale financial assets 23, 27 8,300,000 6,220,000 1,992,730
23 2,866,564 )( 6,072,776 )( 20,484,624
TOTAL COMPREHENSIVE INCOME
FOR THE YEAR 238,831,398 P 3,392,453,838 P 4,038,093,356 P
Net profit attributable to:
Parent company’s shareholders 251,150,857 P 3,402,125,080 P 4,021,379,516 P
Non-controlling interests 9,452,895 )( 3,598,466 )( 3,770,784 )(
241,697,962 P 3,398,526,614 P 4,017,608,732 P
Total comprehensive income attributable to:
Parent company’s shareholders 248,284,293 P 3,396,052,304 P 4,041,864,140 P
Non-controlling interests 9,452,895 )( 3,598,466 )( 3,770,784 )(
238,831,398 P 3,392,453,838 P 4,038,093,356 P
Earnings per Share:
Basic and diluted 29 0.02 P 0.22 P 0.26 P
See Notes to Consolidated Financial Statements.
TRAVELLERS INTERNATIONAL HOTEL GROUP, INC. AND SUBSIDIARIES
(A Subsidiary of Alliance Global Group, Inc.)CONSOLIDATED STATEMENTS OF COMPREHENSIVE INCOME
FOR THE YEARS ENDED DECEMBER 31, 2017, 2016 AND 2015
(Amounts in Philippine Pesos)
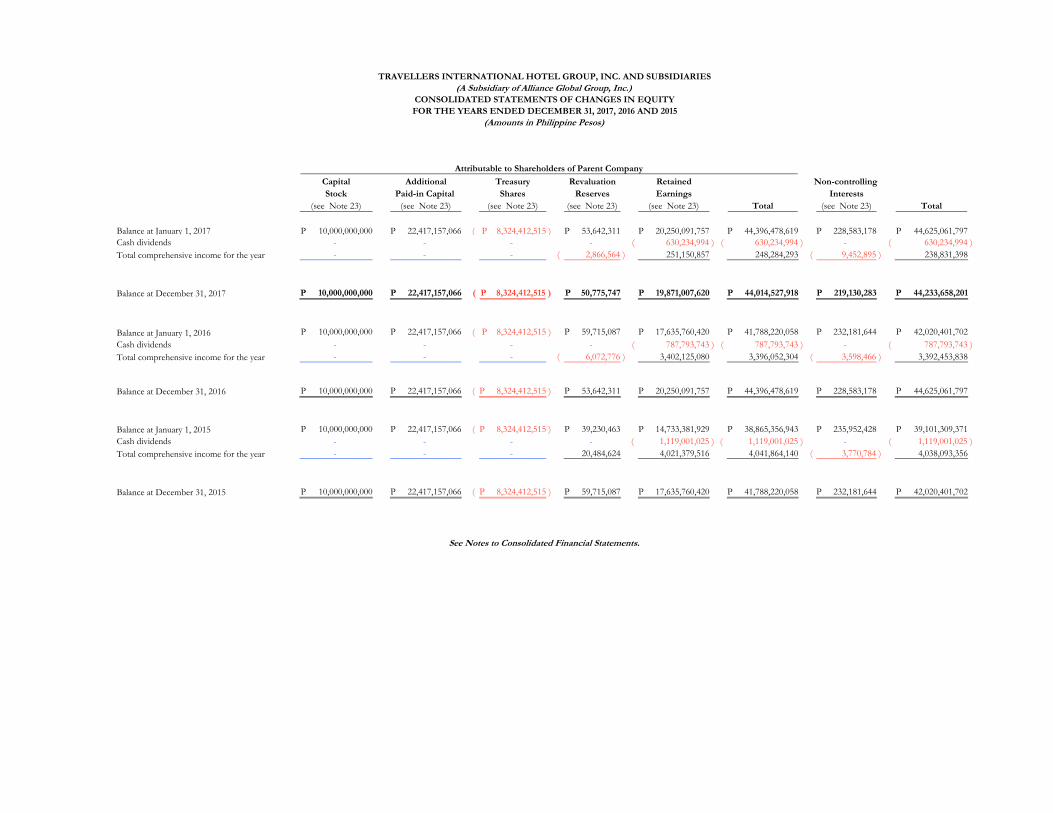
Capital Additional Treasury Revaluation Retained Non-controlling
Stock Paid-in Capital Shares Reserves Earnings Interests
(see Note 23) (see Note 23) (see Note 23) (see Note 23) (see Note 23) Total (see Note 23) Total
Balance at January 1, 2017 10,000,000,000 P 22,417,157,066 P 8,324,412,515 )( P 53,642,311 P 20,250,091,757 P 44,396,478,619 P 228,583,178 P 44,625,061,797 P
Cash dividends - - - - 630,234,994 )( 630,234,994 )( - 630,234,994 )(
Total comprehensive income for the year - - - 2,866,564 )( 251,150,857 248,284,293 9,452,895 )( 238,831,398
Balance at December 31, 2017 10,000,000,000 P 22,417,157,066 P 8,324,412,515 )( P 50,775,747 P 19,871,007,620 P 44,014,527,918 P 219,130,283 P 44,233,658,201 P
Balance at January 1, 2016 10,000,000,000 P 22,417,157,066 P 8,324,412,515 )( P 59,715,087 P 17,635,760,420 P 41,788,220,058 P 232,181,644 P 42,020,401,702 P
Cash dividends - - - - 787,793,743 )( 787,793,743 )( - 787,793,743 )(
Total comprehensive income for the year - - - 6,072,776 )( 3,402,125,080 3,396,052,304 3,598,466 )( 3,392,453,838
Balance at December 31, 2016 10,000,000,000 P 22,417,157,066 P 8,324,412,515 )( P 53,642,311 P 20,250,091,757 P 44,396,478,619 P 228,583,178 P 44,625,061,797 P
Balance at January 1, 2015 10,000,000,000 P 22,417,157,066 P 8,324,412,515 )( P 39,230,463 P 14,733,381,929 P 38,865,356,943 P 235,952,428 P 39,101,309,371 P
Cash dividends - - - - 1,119,001,025 )( 1,119,001,025 )( - 1,119,001,025 )(
Total comprehensive income for the year - - - 20,484,624 4,021,379,516 4,041,864,140 3,770,784 )( 4,038,093,356
Balance at December 31, 2015 10,000,000,000 P 22,417,157,066 P 8,324,412,515 )( P 59,715,087 P 17,635,760,420 P 41,788,220,058 P 232,181,644 P 42,020,401,702 P
Attributable to Shareholders of Parent Company
See Notes to Consolidated Financial Statements.
TRAVELLERS INTERNATIONAL HOTEL GROUP, INC. AND SUBSIDIARIES
(A Subsidiary of Alliance Global Group, Inc.)
CONSOLIDATED STATEMENTS OF CHANGES IN EQUITY
FOR THE YEARS ENDED DECEMBER 31, 2017, 2016 AND 2015
(Amounts in Philippine Pesos)

Notes 2017 2016 2015
CASH FLOWS FROM OPERATING ACTIVITIES
Profit before tax 460,093,401 P 3,462,841,022 P 4,066,978,922 P
Adjustments for:
Depreciation 17 1,931,946,081 1,643,106,203 1,402,874,562
Interest expense 19 659,083,204 740,067,690 194,532,794
Losses from property damages 11 652,604,324 - -
Unrealized foreign exchange losses (gains) - net 189,243,458 )( 671,607,073 547,769,984
Interest income 19 168,416,307 )( 86,434,568 )( 116,287,960 )(
Share in net loss (profit) of an associate and joint venture 9 40,089,829 )( 57,598,061 )( 32,929,706
Loss on interest rate swap 19 27,235,637 31,769,386 30,186,511
Loss (gain) on sale of property and equipment - net 11, 18 4,179,829 )( 2,933,560 -
Operating profit before working capital changes 3,329,033,224 6,408,292,305 6,158,984,519
Decrease (increase) in trade and other receivables 2,759,582,488 )( 2,008,462,399 1,750,030,290 )(
Increase in advances to related parties 380,444,569 619,851,281 )( 28,695,498 )(
Decrease (increase) in inventories 47,870,020 27,766,724 )( 69,475,983 )(
Increase in prepayments and other current assets 604,075,376 )( 219,970,315 )( 213,861,884 )(
Increase in other non-current assets 1,376,888 )( 22,126,888 )( 62,925,000 )(
Increase (decrease) in trade and other payables 1,058,165,074 675,658,431 )( 1,533,058,111
Increase in advances from related parties 72,834,683 )( 892,694,925 1,069,359,781
Increase in retirement benefit obligation 146,790,178 27,150,614 28,141,941
Increase in other non-current liabilities 3,905,447 17,792,898 7,435,546
Cash generated from operations 1,528,339,077 7,789,019,502 6,671,991,243
Cash paid for income taxes 75,488,142 )( 66,530,835 )( 60,899,651 )(
Net Cash From Operating Activities 1,452,850,935 7,722,488,667 6,611,091,592
CASH FLOWS FROM INVESTING ACTIVITIES
Acquisitions of property and equipment 11 10,707,470,404 )( 10,882,155,064 )( 7,818,860,070 )(
Increase in advances for future investment 10 588,235,294 )( 588,235,294 )( 1,500,000,000 )(
Interest received 166,868,164 89,566,060 121,188,615
Additional investment in associate 9 150,000,000 )( - 495,078,216 )(
Decrease in other non-current assets 36,396,357 135,718,836 55,450,527
Proceeds from sale of property and equipment 11 6,903,114 20,884,276 29,665,804
Net Cash Used in Investing Activities 11,235,538,063 )( 11,224,221,186 )( 9,607,633,340 )(
Balance Carried Forward 9,782,687,128 )( P 3,501,732,519 )( P 2,996,541,748 )( P
TRAVELLERS INTERNATIONAL HOTEL GROUP, INC. AND SUBSIDIARIES
(A Subsidiary of Alliance Global Group, Inc.)CONSOLIDATED STATEMENTS OF CASH FLOWS
FOR THE YEARS ENDED DECEMBER 31, 2017, 2016 AND 2015
(Amounts in Philippine Pesos)

Notes 2017 2016 2015
Balance Brought Forward 9,782,687,128 )( P 3,501,732,519 )( P 2,996,541,748 )( P
CASH FLOWS FROM FINANCING ACTIVITIES
Proceeds from interest-bearing loans and borrowings 14 33,947,500,000 7,000,000,000 -
Payment of notes payable 16 14,944,636,538 )( - -
Repayments of interest-bearing loans and borrowings 14 9,500,000,000 )( 225,000,000 )( -
Interest paid 1,621,045,251 )( 1,395,667,296 )( 1,358,882,593 )(
Dividends paid 23 630,234,994 )( 787,793,743 )( 1,119,001,025 )(
Payments of derivative liability 16 360,478,688 )( 339,463,500 )( 324,351,375 )(
Net Cash From (Used in) Financing Activities 6,891,104,529 4,252,075,461 2,802,234,993 )(
EFFECTS OF EXCHANGE RATES CHANGES ON CASH
AND CASH EQUIVALENTS 194,547,334 198,669,223 243,573,107
NET INCREASE (DECREASE) IN CASH
AND CASH EQUIVALENTS 2,697,035,265 )( 949,012,165 5,555,203,634 )(
CASH AND CASH EQUIVALENTS
AT BEGINNING OF YEAR 13,250,208,941 12,301,196,776 17,856,400,410
CASH AND CASH EQUIVALENTS
AT END OF YEAR 10,553,173,676 P 13,250,208,941 P 12,301,196,776 P
Supplemental Information on Non-cash Investing Activities:
1) The Group capitalized borrowing costs amounting to P1.1 billion, P705.6 million, and P1.0 billion in 2017, 2016 and 2015, respectively, representing the
actual borrowing costs, net of related investment income, incurred on loans obtained for the development of a portion of the Group’s properties (see Note 11).
2) In 2017, the Group wrote-off certain properties and equipment amounting to P652.6 million which were damaged due to an arson incident
(see Notes 11 and 24.6).
3) In 2016, the Group applied a portion of the Advances for Future Investment account against Advances from Related Parties account amounting to P3.7 billion
(see Notes 10 and 22)
See Notes to Consolidated Financial Statements.
- 2 -

TRAVELLERS INTERNATIONAL HOTEL GROUP, INC. AND SUBSIDIARIES (A Subsidiary of Alliance Global Group, Inc.)
NOTES TO CONSOLIDATED FINANCIAL STATEMENTS DECEMBER 31, 2017 AND 2016 (Amounts in Philippine Pesos)
1. CORPORATE INFORMATION
Travellers International Hotel Group, Inc. (the Company or Parent Company) was incorporated in the Philippines on December 17, 2003 primarily to engage in the business of hotels, restaurants, leisure parks, entertainment centers and other related businesses, which include holding investments in and operating casinos and other gaming activities as part of its main operations. On October 14, 2010, the Philippine Securities and Exchange Commission (SEC) approved the Company’s amendment to its Articles of Incorporation, as approved in a resolution by the Company’s stockholders on August 29, 2010, to include in its primary purposes the guaranteeing of obligations of other related entities. The Company’s casinos and restaurants in Resorts World Manila started commercial operations on August 28, 2009 while the Company’s hotel and restaurant operations in Maxims Manila Hotel (Maxims), Marriott Hotel Manila (Marriott) and Remington Hotel (Remington) started on various dates in 2009 to 2011. The Marriott Grand Ballroom (MGB), a world-class events and convention center, formally opened its doors to the public in 2015, while the Marriott West Wing (MWW), an expansion of Marriott, opened in 2016 (see Note 11). The Company engages in casino operations under the Provisional License Agreement with the Philippine Amusement and Gaming Corporation (PAGCOR) dated June 2, 2008 (see Note 24.4). The Company’s common shares were listed and traded in the Philippine Stock Exchange (PSE) beginning November 5, 2013 (see Note 23.1). As at December 31, 2017, 2016 and 2015, the Company holds direct ownership interests in the following companies (together with the Company, collectively referred to as “the Group”) that were established to engage in businesses related to the main business of the Company:
Explanatory Percentage of Name of Subsidiaries Notes Ownership Subsidiaries: Agile Fox Amusement and Leisure Corporation (AFALC) (a) 100.0% APEC Assets Limited (APEC) (b) 100.0% Aquamarine Delphinium Leisure and Recreation Corporation (ADLRC) (a) 100.0% Bright Pelican Leisure and Recreation, Inc. (BPLRI) (a) 100.0% Brightleisure Management, Inc. (BLMI) (c) 100.0% Brilliant Apex Hotels and Leisure Corporation (BAHLC) (a) 100.0% Coral Primrose Leisure and Recreation Corporation (CPLRC) (a) 100.0% Deluxe Hotels and Recreation, Inc. (DHRI) (a) 100.0% Entertainment City Integrated Resorts & Leisure, Inc. (ECIRLI) (a) 100.0% FHTC Entertainment & Productions Inc. (FHTC) (d) 100.0%
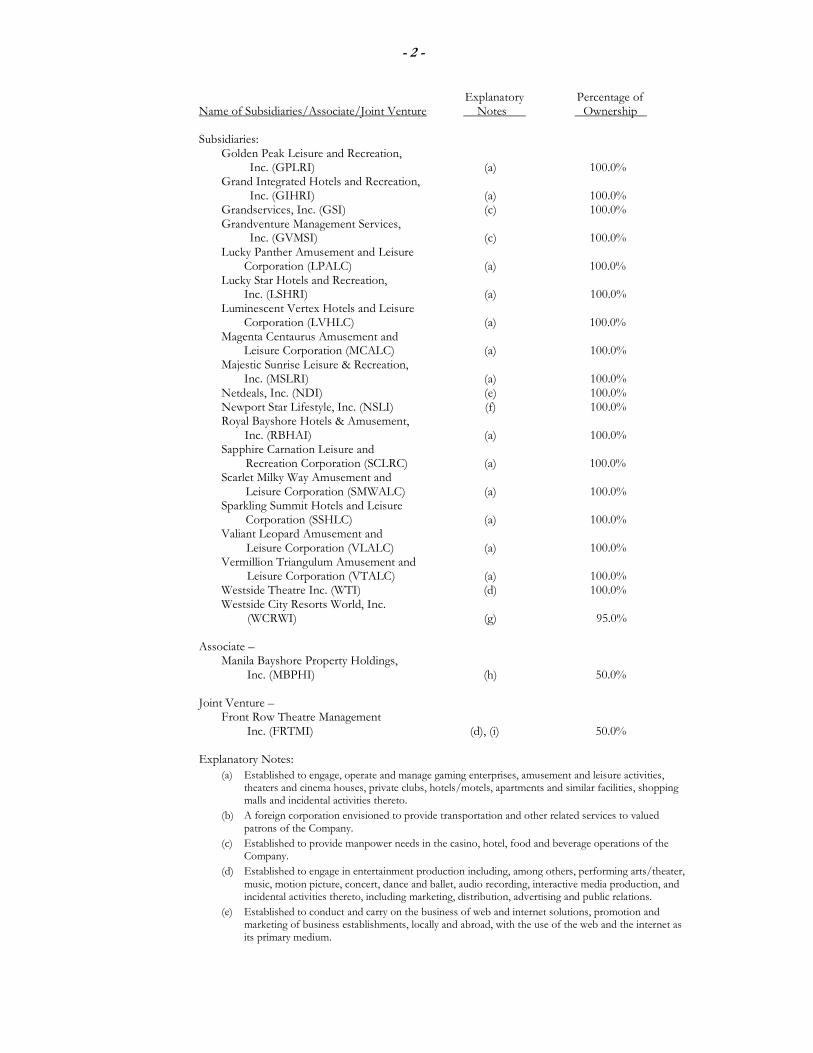
- 2 -
Explanatory Percentage of Name of Subsidiaries/Associate/Joint Venture Notes Ownership Subsidiaries: Golden Peak Leisure and Recreation, Inc. (GPLRI) (a) 100.0% Grand Integrated Hotels and Recreation, Inc. (GIHRI) (a) 100.0% Grandservices, Inc. (GSI) (c) 100.0% Grandventure Management Services, Inc. (GVMSI) (c) 100.0% Lucky Panther Amusement and Leisure Corporation (LPALC) (a) 100.0% Lucky Star Hotels and Recreation, Inc. (LSHRI) (a) 100.0% Luminescent Vertex Hotels and Leisure Corporation (LVHLC) (a) 100.0% Magenta Centaurus Amusement and Leisure Corporation (MCALC) (a) 100.0% Majestic Sunrise Leisure & Recreation, Inc. (MSLRI) (a) 100.0% Netdeals, Inc. (NDI) (e) 100.0% Newport Star Lifestyle, Inc. (NSLI) (f) 100.0% Royal Bayshore Hotels & Amusement, Inc. (RBHAI) (a) 100.0% Sapphire Carnation Leisure and Recreation Corporation (SCLRC) (a) 100.0% Scarlet Milky Way Amusement and Leisure Corporation (SMWALC) (a) 100.0% Sparkling Summit Hotels and Leisure Corporation (SSHLC) (a) 100.0% Valiant Leopard Amusement and Leisure Corporation (VLALC) (a) 100.0% Vermillion Triangulum Amusement and Leisure Corporation (VTALC) (a) 100.0% Westside Theatre Inc. (WTI) (d) 100.0% Westside City Resorts World, Inc. (WCRWI) (g) 95.0%
Associate –
Manila Bayshore Property Holdings, Inc. (MBPHI) (h) 50.0%
Joint Venture – Front Row Theatre Management Inc. (FRTMI) (d), (i) 50.0%
Explanatory Notes:
(a) Established to engage, operate and manage gaming enterprises, amusement and leisure activities, theaters and cinema houses, private clubs, hotels/motels, apartments and similar facilities, shopping malls and incidental activities thereto.
(b) A foreign corporation envisioned to provide transportation and other related services to valued patrons of the Company.
(c) Established to provide manpower needs in the casino, hotel, food and beverage operations of the Company.
(d) Established to engage in entertainment production including, among others, performing arts/theater, music, motion picture, concert, dance and ballet, audio recording, interactive media production, and incidental activities thereto, including marketing, distribution, advertising and public relations.
(e) Established to conduct and carry on the business of web and internet solutions, promotion and marketing of business establishments, locally and abroad, with the use of the web and the internet as its primary medium.

- 3 -
(f) Established to facilitate enhancements to services of various institutions, within and outside the Philippines by providing related services to promote the sale consumption, utilization and patronage of goods, merchandise and services of producers, retailers, wholesalers and traders.
(g) Established to primarily engage in the business of hotels, restaurants, leisure parks, entertainment centers and other related businesses which include holding investments in and opening casinos and other gaming activities as part of its main operations. WCRWI has two wholly owned subsidiaries namely, Purple Flamingos Amusement and Leisure Corporation and Red Falcon Amusement and Leisure Corporation, which have not yet started commercial operations as of December 31, 2017.
(h) Established to engage in real estate business, particularly construction of condominium units and buildings.
(i) FRTMI is a joint venture between FHTC and Viva Live, Inc., (VLI) each owning 50.0% interest and exercising joint control (see Note 9).
The subsidiaries, associate and joint venture under the Group are all incorporated in the Philippines, except for APEC which is incorporated in the British Virgin Islands. The principal place of business of these domestic subsidiaries, associate and joint venture is within Metro Manila, Philippines. As at December 31, 2017, NDI already ceased operations while all other subsidiaries have not yet started commercial operations except for APEC, BLMI, FHTC, GIHRI, GSI and GVMSI (see Note 9).
As at December 31, 2017, 2016 and 2015, the following stakeholders have direct ownership interests in the Company’s outstanding common shares: Explanatory Percentage of Name of Stockholders Notes Ownership Alliance Global Group, Inc. (AGI) (a) 25.1% Adams Properties, Inc. (Adams) (b) 22.5% Star Cruises Philippines Holdings B.V. (SCP) (c) 18.0% Asian Travellers Ltd. (ATL) (d) 11.3% Premium Travellers Ltd. (PTL) (d) 6.7% First Centro, Inc. (FCI) (e) 4.5% Megaworld Corporation (Megaworld) (f) 1.8% Other related parties (g) 0.1% Public ownership (g) 10.0% 100.0%
Explanatory Notes:
(a) AGI, the Company’s parent company, is a publicly listed domestic holding company with diversified investments in real estate, food and beverage, quick service restaurant, and tourism-oriented business. The registered office of AGI is located at 7th Floor, 1880 Eastwood Avenue, Eastwood City Cyberpark, 188 E. Rodriguez, Jr. Avenue, Bagumbayan, Quezon City.
(b) A domestic company and a subsidiary of AGI with registered office located at 7th Floor, 1880 Eastwood Avenue, Eastwood City CyberPark, 188 E. Rodriguez, Jr. Avenue, Bagumbayan, Quezon City.
(c) A foreign holding entity, wholly owned by Genting Hongkong Limited (GHL), duly incorporated and with registered offices at Herikerbergweg 238 Luna Arena, 1101 CM Amsterdam, Zuidoost, The Netherlands.
(d) Foreign entities duly incorporated and with registered offices at Portcullis Trustnet Chambers, P.O. Box 3444, Road Town, Tortola, British Virgin Islands.
(e) A wholly owned subsidiary of AGI engaged in the business of developing and selling its own real estate properties and acting as agent or broker for sale transactions of real properties of other entities. The registered office of FCI is located at 7th Floor, 1880 Eastwood Avenue, Eastwood City Cyberpark, 188 E. Rodriguez, Jr. Avenue, Bagumbayan, Quezon City.

- 4 -
(f) A publicly listed subsidiary of AGI which is presently engaged in property-related activities, such as, project design, construction and property management. The registered office of Megaworld is located at 30th Floor, Alliance Global Tower, 36th Street cor. 11th Avenue, Uptown Bonifacio, Taguig City.
(g) The enumeration of the other related parties and their respective percentages of ownership in the total outstanding common shares of the Company, as well as the computation for public ownership percentage is expounded in the Public Ownership Report as of December 31, 2017 disclosed by the Company to the PSE on January 12, 2018.
The Company’s registered office, which is also its principal place of business, is located at 10/F Newport Entertainment & Commercial Centre, Newport Boulevard, Newport Cybertourism Economic Zone, Pasay City. The consolidated financial statements of the Group as of and for the year ended December 31, 2017 (including the comparative financial statements as of December 31, 2016 and for the years ended December 31, 2016 and 2015) were authorized for issue by the Company’s Board of Directors (BOD) on February 28, 2018.
2. SUMMARY OF SIGNIFICANT ACCOUNTING POLICIES
The significant accounting policies that have been used in the preparation of these consolidated financial statements are summarized below and in the succeeding pages. These policies have been consistently applied to all the years presented, unless otherwise stated.
2.1 Basis of Preparation of Consolidated Financial Statements
(a) Statement of Compliance with Philippine Financial Reporting Standards
The consolidated financial statements of the Group have been prepared in accordance with Philippine Financial Reporting Standards (PFRS). PFRS are adopted by the Financial Reporting Standards Council (FRSC) from the pronouncements issued by the International Accounting Standards Board, and approved by the Philippine Board of Accountancy.
The consolidated financial statements have been prepared using the measurement bases specified by PFRS for each type of asset, liability, income and expense. The measurement bases are more fully described in the accounting policies that follow.
(b) Presentation of Consolidated Financial Statements The consolidated financial statements are presented in accordance with Philippine Accounting Standard (PAS) 1, Presentation of Financial Statements. The Group presents all items of income and expenses and other comprehensive income or loss in a single consolidated statement of comprehensive income.
The Group presents a third consolidated statement of financial position as at the beginning of the preceding period when it applies an accounting policy retrospectively, or makes a retrospective restatement or reclassification of items that has a material effect on the information in the consolidated statement of financial position at the beginning of the preceding period. The related notes to the third consolidated statement of financial position are not required to be disclosed.

- 5 -
(c) Functional and Presentation Currency These consolidated financial statements are presented in Philippine pesos, the Group’s functional and presentation currency, and all values represent absolute amounts except when otherwise indicated. Items included in the consolidated financial statements of the Group are measured using its functional currency. Functional currency is the currency of the primary economic environment in which the Group operates.
2.2 Adoption of New and Amended PFRS
(a) Effective in 2017 that are Relevant to the Group
The Group adopted for the first time the following amendments to PFRS which are mandatorily effective for annual periods beginning on or after January 1, 2017: PAS 7 (Amendments) : Statement of Cash Flows – Disclosure Initiative PAS 12 (Amendments) : Income Taxes – Recognition of Deferred Tax Assets for Unrealized Losses Discussed below are the relevant information about these amendments.
(i) PAS 7 (Amendments), Statement of Cash Flows – Disclosure Initiative.
The amendments are designed to improve the quality of information provided to users of financial statements about changes in an entity’s debt and related cash flows (and non-cash changes). The amendments require an entity to provide disclosures that enable users to evaluate changes in liabilities arising from financing activities. An entity applies its judgment when determining the exact form and content of the disclosures needed to satisfy this requirement. Moreover, the amendments suggest a number of specific disclosures that may be necessary in order to satisfy the above requirement, including: (a) changes in liabilities arising from financing activities caused by changes in financing cash flows, foreign exchange rates or fair values, or obtaining or losing control of subsidiaries or other businesses; and, (b) a reconciliation of the opening and closing balances of liabilities arising from financing activities in the statement of financial position including those changes identified immediately above.
Management has applied these amendments in the current year and has not disclosed comparative figures as allowed by the transitional provisions. A reconciliation between the opening and closing balances of liabilities arising from financing activities, which includes both cash and non-cash changes are presented in Notes 14 and 16.

- 6 -
(ii) PAS 12 (Amendments), Income Taxes – Recognition of Deferred Tax Assets for Unrealized Losses. The focus of the amendments is to clarify how to account for deferred tax assets related to debt instruments measured at fair value, particularly where changes in the market interest rate decrease the fair value of a debt instrument below cost. The amendments provide guidance in the following areas where diversity in practice previously existed: (a) existence of a deductible temporary difference; (b) recovering an asset for more than its carrying amount; (c) probable future taxable profit against which deductible temporary differences are assessed for utilization; and, (d) combined versus separate assessment of deferred tax asset recognition for each deductible temporary difference. The application of this amendment has had no impact on the Group’s consolidated financial statements.
(b) Effective in 2017 that is not Relevant to the Group
The only improvement to existing standards effective for annual periods beginning on or after January 1, 2017, is the annual improvement to PFRS (2014-2016 Cycle) – PFRS 12 (Amendment), Disclosure of Interest in Other Entities, in relation to scope clarification on disclosure of summarized financial information for interests classified as held for sale, which is not relevant to the Group.
(c) Effective Subsequent to 2017 but not Adopted Early
There are new PFRS, amendments, interpretations and annual improvements to existing standards effective for annual periods subsequent to 2017, which are adopted by the FRSC. Management will adopt the following relevant pronouncements in accordance with their transitional provisions; and, unless otherwise stated, none of these are expected to have significant impact on the Group’s consolidated financial statements: (i) PAS 40 (Amendment), Investment Property – Reclassification to and from Investment
Property (effective from January 1, 2018). The amendment states that an entity shall transfer a property to or from investment property when, and only when, there is evidence of a change in use. A change of use occurs if property meets, or ceases to meet, the definition of investment property. A change in management’s intentions for the use of a property by itself does not constitute evidence of a change in use. The amendment provided a non-exhaustive list of examples constituting change in use.
(ii) PFRS 9 (2014), Financial Instruments (effective from January 1, 2018). This new standard on financial instruments will replace PAS 39, Financial Instruments: Recognition and Measurement, and PFRS 9 (2009, 2010 and 2013 versions). This standard contains, among others, the following:
• three principal classification categories for financial assets based on the business model on how an entity is managing its financial instruments;
• an expected credit loss (ECL) model in determining impairment of all financial assets that are not measured at fair value through profit or loss (FVTPL), which generally depends on whether there has been a significant increase in credit risk since initial recognition of a financial asset; and,

- 7 -
• a new model on hedge accounting that provides significant improvements principally by aligning hedge accounting more closely with the risk management activities undertaken by entities when hedging their financial and non-financial risk exposures.
In accordance with the financial asset classification principle of PFRS 9 (2014), a financial asset is classified and measured at amortized cost if the asset is held within a business model whose objective is to hold financial assets in order to collect the contractual cash flows that represent solely payments of principal and interest (SPPI) on the principal outstanding. Moreover, a financial asset is classified and subsequently measured at fair value through other comprehensive income (FVTOCI) if it meets the SPPI criterion and is held in a business model whose objective is achieved by both collecting contractual cash flows and selling the financial assets. All other financial assets are measured at FVTPL.
In addition, PFRS 9 (2014) allows entities to make an irrevocable election to present subsequent changes in the fair value of an equity instrument that is not held for trading in other comprehensive income.
The accounting for embedded derivatives in host contracts that are financial assets is simplified by removing the requirement to consider whether or not they are closely related, and, in most arrangements, does not require separation from the host contract.
For liabilities, the standard retains most of the PAS 39 requirements which include amortized cost accounting for most financial liabilities, with bifurcation of embedded derivatives. The amendment also requires changes in the fair value of an entity’s own debt instruments caused by changes in its own credit quality to be recognized in other comprehensive income rather than in profit or loss. Based on an assessment of the Group’s financial assets and liabilities as at December 31, 2017, which has been limited to the facts and circumstances existing at that date, management has identified the following areas that are expected to be most impacted by the application of PFRS 9 (2014):
• On classification and measurement of the Group’s financial assets, management holds most financial assets to hold and collect the associated cash flows and is currently assessing the underlying types of cash flows to classify financial assets correctly.
• Trade and other receivables are composed of receivables from customers, advances to related parties, and other receivables which are held to collect contractual cash flows representing SPPI (see Note 6). These financial assets will continue to be measured at amortized cost upon application of PFRS 9 (2014).

- 8 -
• Equity securities classified as available-for-sale (AFS) financial assets are composed of golf club shares. In applying PFRS 9 (2014), the Group shall make an irrevocable designation whether these equity securities shall be classified as financial assets at FVTPL or at FVTOCI. The Group initially assessed that these equity securities shall be designated, on date of initial application, as financial assets at FVTOCI. Thus, these instruments will continue to be measured at fair value, with mark-to-market fluctuations and realized gain (loss) on sale directly recognized in other comprehensive income.
• In applying the ECL methodology of PFRS 9 (2014), the Group initially assessed to use the simplified approach for trade and other receivables as allowed by the standard.
(iii) PFRS 10 (Amendments), Consolidated Financial Statements, and PAS 28
(Amendments), Investments in Associates and Joint Ventures – Sale or Contribution of Assets between an Investor and its Associates or Joint Venture (effective date deferred indefinitely). The amendments to PFRS 10 require full recognition in the investor’s financial statements of gains or losses arising on the sale or contribution of assets that constitute a business as defined in PFRS 3, Business Combinations, between an investor and its associate or joint venture. Accordingly, the partial recognition of gains or losses (i.e., to the extent of the unrelated investor’s interests in an associate or joint venture) only applies to those sale of contribution of assets that do not constitute a business. Corresponding amendments have been made to PAS 28 to reflect these changes. In addition, PAS 28 has been amended to clarify that when determining whether assets that are sold or contributed constitute a business, an entity shall consider whether the sale or contribution of those assets is part of multiple arrangements that should be accounted for as a single transaction.
(iv) PFRS 15, Revenue from Contract with Customers (effective from January 1, 2018). This standard will replace PAS 18, Revenue, and PAS 11, Construction Contracts, the related Interpretations on revenue recognition: International Financial Reporting Interpretations Committee (IFRIC) 13, Customer Loyalty Programmes, IFRIC 15, Agreement for the Construction of Real Estate, IFRIC 18, Transfers of Assets from Customers and Standing Interpretations Committee 31, Revenue – Barter Transactions Involving Advertising Services. This new standard establishes a comprehensive framework for determining when to recognize revenue and how much revenue to recognize. The core principle in the said framework is for an entity to recognize revenue to depict the transfer of promised goods or services to the customer in an amount that reflects the consideration to which the entity expects to be entitled in exchange for those goods or services. Based on an assessment of the Group’s revenue streams as at December 31, 2017, which has been limited to the facts and circumstances existing at that date, management determined that its significant sources of revenues pertain to revenues from gaming activities, hotel, food, beverage and others, rentals, and rendering of services.

- 9 -
Management has assessed that its existing revenue recognition policy on revenues from hotel, food, beverage and others, and rendering of services is consistent with the requirements of PFRS 15. On the other hand, gaming transactions of the Group with fixed-odds known at the time of bet are considered to be financial instruments (derivative contracts) and accordingly assessed to be outside the scope of PFRS 15. Management is currently assessing the full impact of this new standard in its consolidated financial statements.
(v) IFRIC 22, Foreign Currency Transactions and Advance Consideration – Interpretation
on Foreign Currency Transactions and Advance Consideration (effective from January 1, 2018). The interpretation provides more detailed guidance on how to account for transactions that include the receipt or payment of advance consideration in a foreign currency. The interpretation states that the date of the transaction, for the purpose of determining the exchange rate, is the date of initial recognition of the non-monetary asset (arising from advance payment) or liability (arising from advance receipt). If there are multiple payments or receipts in advance, a date of transaction is established for each payment or receipt.
(vi) Annual Improvements to PFRS 2014-2016 Cycle. Among the improvements, PAS 28 (Amendment), Investment in Associates – Clarification on Fair Value through Profit or Loss Classification (effective from January 1, 2018) is relevant to the Group. The amendment clarifies that the option for venture capital organization, mutual funds and other similar entities to elect the fair value through profit or loss classification in measuring investments in associates and joint ventures shall be made at initial recognition, separately for each associate or joint venture.
(vii) PAS 28 (Amendment), Investment in Associates – Long-term Interest in Associates
and Joint Venture (effective from January 1, 2019). The amendment clarifies that the scope exclusion in PFRS 9 (2014) applies only to ownership interests accounted for using the equity method. Thus, the amendment further clarifies that long term interests in an associate or joint venture – to which the equity method is not applied – must be accounted for under PFRS 9 (2014), which shall also include long term interests that, in substance, form part of the entity’s net investment in an associate or joint venture.
(viii) PFRS 9 (Amendment), Financial Instruments – Prepayment Features with Negative Compensation (effective from January 1, 2019). The amendment clarifies that prepayment features with negative compensation attached to financial instruments may still qualify under the SPPI test. As such, the financial assets containing prepayment features with negative compensation may still be classified at amortized cost or at FVTOCI.

- 10 -
(ix) PFRS 16, Leases (effective from January 1, 2019). The new standard will eventually replace PAS 17, Leases.
For lessees, it requires to account for leases “on-balance sheet” by recognizing a “right-of-use” asset and a lease liability. The lease liability is initially measured as the present value of future lease payments. For this purpose, lease payments include fixed, non-cancellable payments for lease elements, amounts due under residual value guarantees, certain types of contingent payments and amounts due during optional periods to the extent that extension is reasonably certain. In subsequent periods, the “right-of-use” asset is accounted for similar to a purchased asset subject to depreciation or amortization. The lease liability is accounted for similar to a financial liability which is amortized using the effective interest method.
However, the new standard provides important reliefs or exemptions for short-term leases and leases of low value assets. If these exemptions are used, the accounting is similar to operating lease accounting under PAS 17 where lease payments are recognized as expenses on a straight-line basis over the lease term or another systematic basis (if more representative of the pattern of the lessee’s benefit). For lessors, lease accounting is similar to PAS 17’s approach. In particular, the distinction between finance and operating leases is retained. The definitions of each type of lease, and the supporting indicators of a finance lease, are substantially the same as PAS 17 approach. The basic accounting mechanics are also similar, but with some different or more explicit guidance in few areas. These include variable payments, sub-leases, lease modifications, the treatment of initial direct costs and lessor disclosures.
(x) IFRIC 23, Uncertainty over Income Tax Treatments (effective from January 1, 2019). The interpretation provides clarification on the determination of taxable profit, tax bases, unused tax losses, unused tax credits, and tax rates when there is uncertainty over income tax treatments. The core principle of the interpretation requires the Group to consider the probability of the tax treatment being accepted by the taxation authority.
When it is probable that the tax treatment will be accepted, the determination of the taxable profit, tax bases, unused tax losses, unused tax credits, and tax rates shall be on the basis of the accepted tax treatment. Otherwise, the Group has to use the most likely amount or the expected value, depending on the surrounding circumstances, in determining the tax accounts identified immediately above.
(xi) Annual Improvements to PFRS 2015-2017 Cycle. Among the improvements, the following amendments are relevant to the Group but have no material impact on the Group’s consolidated financial statements as these amendments merely clarify existing requirements:
• PAS 12 (Amendments), Income Taxes – Tax Consequences of Dividends. The amendments clarify that all income tax consequence of dividend payments should be recognized in profit or loss.

- 11 -
• PAS 23 (Amendments), Borrowing Costs – Eligibility for Capitalization. The amendments clarify that any specific borrowing which remains outstanding after the related qualifying asset is ready for its intended purpose, such borrowing will then form part of the entity’s general borrowings when calculating the capitalization rate for capitalization purposes.
2.3 Basis of Consolidation, Investments in Subsidiaries, Associate and
Joint Venture
The Group’s consolidated financial statements comprise the accounts of the Company and its subsidiaries as enumerated in Note 1, after the elimination of intercompany transactions. All intercompany assets and liabilities, equity, income, expenses and cash flows relating to transactions between entities under the Group, are eliminated in full on consolidation. Unrealized profits and losses from intercompany transactions that are recognized in assets are also eliminated in full. Intercompany losses that indicate impairment are recognized in the consolidated financial statements. The financial statements of subsidiaries, associate and joint venture are prepared for the same reporting period as that of the Company, using consistent accounting policies.
The Parent Company accounts for its investments in subsidiaries, associate and joint venture as follows:
(a) Investments in Subsidiaries
Subsidiaries are entities (including structured entities) over which the Parent Company has control. The Parent Company controls an entity when (a) it has power over the entity, (b) it is exposed, or has rights to, variable returns from its involvement with the entity, and (c) it has the ability to affect those returns through its power over the entity. Subsidiaries are consolidated from the date the Company obtains control. The Company reassesses whether or not it controls an entity if facts and circumstances indicate that there are changes to one or more of the three elements of controls indicated above. Accordingly, entities are deconsolidated from the date that control ceases.
The acquisition method is applied to account for acquired subsidiaries. This requires recognizing and measuring the identifiable assets acquired, the liabilities assumed and any non-controlling interest in the acquiree. The consideration transferred for the acquisition of a subsidiary is the fair values of the assets transferred, the liabilities incurred and the equity interests issued by the Company, if any. The consideration transferred also includes the fair value of any asset or liability resulting from a contingent consideration arrangement. Acquisition-related costs are expensed as incurred and subsequent change in the fair value of contingent consideration is recognized directly in profit or loss. Identifiable assets acquired and liabilities and contingent liabilities assumed in a business combination are measured initially at their fair values at the acquisition date. On an acquisition-by-acquisition basis, the Group recognizes any non-controlling interest in the acquiree, either at fair value or at the non-controlling interest’s proportionate share of the recognized amounts of acquiree’s identifiable net assets.

- 12 -
The excess of the consideration transferred, the amount of any non-controlling interest in the acquiree and the acquisition-date fair value of any existing equity interest in the acquiree over the acquisition-date fair value of identifiable net assets acquired is recognized as goodwill. If the consideration transferred is less than the fair value of the net assets of the subsidiary acquired in the case of a bargain purchase, the difference is recognized directly as gain in profit or loss. For the purpose of impairment testing, goodwill is allocated to cash-generating units or groups of cash-generating units that are expected to benefit from the business combination in which the goodwill arose. Goodwill is tested annually for impairment. Gains and losses on the disposal of an entity include the carrying amount of goodwill relating to the entity sold (see Note 2.13).
(b) Investments in Associate
Associate is an entity over which the Company is able to exert significant influence but which are neither subsidiaries nor interests in a joint venture. Investments in associate are initially recognized at cost and subsequently accounted for using the equity method. Acquired investments in associate are subject to the purchase method. The purchase method involves the recognition of the acquiree’s identifiable assets and liabilities, including contingent liabilities, regardless of whether they were recorded in the financial statements prior to acquisition. Goodwill represents the excess of acquisition cost over the fair value of the Company’s share of the identifiable net assets of the acquiree at the date of acquisition. Any goodwill or fair value adjustment attributable to the Company’s share in the associate is included in the amount recognized as investment in associate. All subsequent changes to the ownership interest in the equity of the associate are recognized in the Company’s carrying amount of the investments. Changes resulting from the profit or loss generated by the associate are reported as part of Share in Net Profit (Loss) of an Associate and Joint Venture account in profit or loss.
Impairment loss is provided when there is objective evidence that the investment in associate will not be recovered (see Note 2.18). Changes resulting from other comprehensive income of the associate or items recognized directly in the associate’s equity are recognized in other comprehensive income or equity of the Company, as applicable. However, when the Company’s share of losses in an associate equals or exceeds its interest in the associate, including any other unsecured receivables, the Company does not recognize further losses, unless it has incurred obligations or made payments on behalf of the associate. If the associate subsequently reports profits, the Company resumes recognizing its share of those profits only after its share of the profits exceeds the accumulated share of losses that has previously not been recognized. If the investment in associate is subsequently sold, the Company recognizes in profit and loss the difference between the consideration received and the carrying amount of the investment. The excess consideration received over the carrying amount of the investment is recognized as Reversal of accumulated share of net losses in an associate and is presented as part of Other Operating Income – net account in the consolidated statement of comprehensive income.

- 13 -
Distributions received from the associate are accounted for as a reduction of the carrying value of the investments. In computing for the share in net profit or loss of associate, unrealized gains or losses on transactions between the Parent Company and its associate are eliminated to the extent of the Parent Company’s interest in the associate. Where unrealized losses are eliminated, the underlying asset is also tested for impairment from a Group perspective.
(c) Investment in Joint Venture A jointly controlled entity is a corporation, partnership, or other entity in which two or more venturers have an interest, under a contractual arrangement that establishes joint control over the entity. Each venturer usually contributes cash or other resources to the jointly controlled entity. Those contributions are included in the accounting records of the venturer and recognised in the venturer’s financial statements as an investment in the jointly controlled entity. Investments in joint venture are initially recognized at cost and subsequently accounted for using the equity method.
Acquired investment in the jointly controlled entity is subject to the purchase method. The purchase method involves the recognition of the jointly controlled entity’s identifiable assets and liabilities, including contingent liabilities, regardless of whether they were recorded in the financial statements prior to acquisition. Goodwill represents the excess of acquisition cost over the fair value of the venturer’s share of the identifiable net assets of the joint venture at the date of acquisition. Any goodwill or fair value adjustment attributable to the venturer’s share in the joint venture is included in the amount recognized as investment in joint venture. All subsequent changes to the ownership interest in the equity of the joint venture are recognized in the venturer’s carrying amount of the investments. Changes resulting from the profit or loss generated by the joint venture are credited or charged against the Share in Net Profit (Loss) of an Associate and Joint Venture account in profit or loss. Impairment loss is provided when there is objective evidence that the investments in joint venture will not be recovered (see Note 2.18). Changes resulting from other comprehensive income of the jointly controlled entity or items recognized directly in the jointly controlled entity’s equity are recognized in other comprehensive income or equity of the venturer, as applicable. However, when the venturer’s share of losses in a joint venture equals or exceeds its interest in the joint venture, including any other unsecured receivables, the venturer does not recognize further losses, unless it has incurred obligations or made payments on behalf of the jointly controlled entity. If the jointly controlled entity subsequently reports profits, the venturer resumes recognizing its share of those profits only after its share of the profits exceeds the accumulated share of losses that has previously not been recognized. Distributions received from the jointly controlled entity are accounted for as a reduction of the carrying value of the investments.

- 14 -
(d) Transactions with Non-controlling Interests
The Group’s transactions with non-controlling interests that do not result in loss of control are accounted for as equity transactions – that is, as transactions with the owners of the Group in their capacity as owners. The difference between the fair value of any consideration paid and the relevant share acquired of the carrying value of the net assets of the relevant share acquired of the carrying value of the net assets of the subsidiary is recognized in equity. Disposals of equity investments to non-controlling interests results in gains and losses for the Group that are also recognized in equity.
When the Group ceases to have control over a subsidiary, any retained interest in the entity is remeasured to its fair value at the date when control is lost, with the change in carrying amount recognized in profit or loss. The fair value is the initial carrying amount for the purposes of subsequently accounting for the retained interest as an associate, joint venture or financial asset. In addition, any amounts previously recognized in other comprehensive income in respect of that entity are accounted for as if the Group had directly disposed of the related assets or liabilities. This may mean that amounts previously recognized in other comprehensive income are reclassified to profit or loss.
2.4 Segment Reporting Operating segments are reported in a manner consistent with the internal reporting provided to the Company’s Executive Committee (ExeCom), its chief operating decision-maker. The ExeCom is responsible for allocating resources and assessing performance of the operating segments. In identifying its operating segments, management generally follows the Group’s main service lines as disclosed in Note 4, which represent the main services provided by the Group. Each of these operating segments is managed separately as each of these service lines requires different resources as well as marketing approaches. All intersegment transfers are carried out at arm’s length prices. The measurement policies the Group uses for segment reporting under PFRS 8, Operating Segments, are the same as those used in its consolidated financial statements.
There have been no significant changes from prior periods in the measurement methods used to determine reported segment profit or loss. 2.5 Financial Assets Financial assets are recognized when the Group becomes a party to the contractual terms of the financial instrument. For purposes of classifying financial assets, an instrument is considered as an equity instrument if it is non-derivative and meets the definition of equity for the issuer in accordance with the criteria of PAS 32, Financial Instruments: Presentation. All other non-derivative financial instruments are treated as debt instruments.

- 15 -
(a) Classification and Measurement of Financial Assets Financial assets other than those designated and effective as hedging instruments are classified into the following categories: financial assets at FVTPL, loans and receivables, held-to-maturity investments and AFS financial assets. Financial assets are assigned to the different categories by management on initial recognition, depending on the purpose for which the investments were acquired. Regular purchases and sales of financial assets are recognized on their trade date. All financial assets that are not classified as at FVTPL are initially recognized at fair value plus any directly attributable transaction costs. Financial assets carried at FVTPL are initially recorded at fair value and transaction costs related to it are recognized in profit or loss. A more detailed description of the categories of financial assets that are relevant to the Group is as follows:
(i) Loans and Receivables Loans and receivables are non-derivative financial assets with fixed or determinable payments that are not quoted in an active market. They arise when the Group provides money, goods or services directly to a debtor with no intention of trading the receivables. They are included in current assets, except for those with maturities greater than 12 months after the end of each reporting period, which are classified as non-current assets. The Group’s financial assets categorized as loans and receivables are presented as Cash and Cash Equivalents, Trade and Other Receivables (except Advances to suppliers), Advances to Related Parties, Investments in time deposits under Prepayments and Other Current Assets and Refundable deposits and Accumulated jackpot seed money under Other Non-current Assets in the consolidated statement of financial position. Cash and cash equivalents include cash on hand, demand deposits and short-term, highly liquid investments with original maturities of three months or less, readily convertible to known amounts of cash and which are subject to insignificant risk of changes in value. Loans and receivables are subsequently measured at amortized cost using the effective interest method, less impairment loss, if any.
(ii) AFS Financial Assets
This category includes non-derivative financial assets that are either designated to this category or do not qualify for inclusion in any of the other categories of financial assets. They are presented as Available-for-sale Financial Assets account in the non-current assets section of the consolidated statement of financial position unless management intends to dispose of the investment within 12 months from the end of the reporting period. The Group’s AFS financial assets include golf and other club shares which are proprietary membership club shares.

- 16 -
All financial assets within this category are subsequently measured at fair value, except for equity instruments that do not have a quoted market price in an active market and whose fair value cannot be reliably measured which are measured at cost, less impairment loss, if any. Gains and losses are recognized in other comprehensive income, net of any income tax effects, and are reported as part of the Revaluation Reserves account in equity, except for interest and dividend income, impairment losses and foreign exchange differences on monetary assets, which are recognized in profit or loss. When the financial asset is disposed of or is determined to be impaired, that is, when there is a significant or prolonged decline in the fair value of the security below its cost, the cumulative fair value gains or losses recognized in other comprehensive income is reclassified from equity to profit or loss and is presented as reclassification adjustment within other comprehensive income even though the financial asset has not been derecognized.
(b) Impairment of Financial Assets The Group assesses at the end of each reporting period whether there is objective evidence that a financial asset or group of financial assets is impaired. The Group recognizes impairment loss based on the category of financial assets as described in the succeeding page.
(i) Carried at Amortized Cost – Loans and Receivables
If there is objective evidence that an impairment loss on loans and receivables carried at cost has been incurred, the amount of the impairment loss is determined as the difference between the assets’ carrying amount and the present value of estimated future cash flows (excluding future credit losses that have not been incurred), discounted at the financial asset’s original effective interest rate or current effective interest rate determined under the contract if the loan has a variable interest rate.
The carrying amount of the asset shall be reduced either directly or through the use of an allowance account. The amount of the loss shall be recognized in profit or loss.
If in subsequent period, the amount of the impairment loss decreases and the decrease can be related objectively to an event occurring after the impairment was recognized (such as an improvement in the debtor’s credit rating), the previously recognized impairment loss is reversed by adjusting the allowance account. The reversal shall not result in a carrying amount of the financial asset that exceeds what the amortized cost would have been had the impairment not been recognized at the date the impairment is reversed. The amount of the reversal is recognized in profit or loss.

- 17 -
(ii) Carried at Fair Value – AFS Financial Assets
When a decline in the fair value of an AFS financial asset has been recognized in other comprehensive income and there is objective evidence that the asset is impaired, the cumulative loss – measured as the difference between the acquisition cost (net of any principal repayment and amortization) and current fair value, less any impairment loss on that financial asset previously recognized in profit or loss – is reclassified from Revaluation Reserves to profit or loss as a reclassification adjustment even though the financial asset has not been derecognized.
Impairment losses recognized in profit or loss on equity instruments are not reversed through profit or loss. Reversal of impairment losses are recognized in other comprehensive income, except for financial assets that are debt securities which are recognized in profit or loss only if the reversal can be objectively related to an event occurring after the impairment loss was recognized.
(c) Items of Income and Expense Related to Financial Assets
All income and expenses, including impairment losses, relating to financial assets that are recognized in profit or loss are presented as part of Finance Income or Finance Costs account in the consolidated statement of comprehensive income. Non-compounding interest, dividend income and other cash flows resulting from holding financial assets are recognized in profit or loss when earned, regardless of how the related carrying amount of financial assets is measured.
(d) Derecognition of Financial Assets
The financial assets are (or where applicable, a part of a financial asset or part of a group of financial assets) derecognized when the contractual rights to receive cash flows from the financial instruments expire, or when the financial assets and all substantial risks and rewards of ownership have been transferred to another party. If the Group neither transfers nor retains substantially all the risks and rewards of ownership and continues to control the transferred asset, the Group recognizes its retained interest in the asset and an associated liability for amounts it may have to pay. If the Group retains substantially all the risks and rewards of ownership of a transferred financial asset, the Group continues to recognize the financial asset and also recognizes a collateralized borrowing for the proceeds received.
2.6 Derivative Financial Instruments
The Group uses derivative financial instruments to manage its risks associated with interest rates. Such derivative financial instruments are initially recognized at fair value on the date in which the derivative contract is entered into and are subsequently remeasured at fair value. Derivatives are carried as assets when the fair value is positive and as liabilities when the fair value is negative (see Note 2.11). The Group’s derivative instruments provide economic hedges but are not designated as accounting hedges and any gains or losses arising from changes in fair value are recognized directly in profit or loss for the period.

- 18 -
2.7 Inventories
Inventories are stated at the lower of cost or net realizable value. Cost, which includes purchase price, import duties and other taxes that are not subsequently recoverable from taxing authorities, is determined using the weighted average method. Net realizable value is the estimated selling price in the ordinary course of business, less estimated costs of completion and the estimated costs necessary to make the sale. Net realizable value of operating and other supplies is the current replacement cost.
2.8 Prepayments and Other Assets
Prepayments and other assets pertain to other resources controlled by the Group as a result of past events. They are recognized in the consolidated financial statements when it is probable that the future economic benefits will flow to the Group and the asset has a cost or value that can be measured reliably.
Other recognized assets of similar nature, where future economic benefits are expected to flow to the Group beyond one year after the end of the reporting period or in the normal operating cycle of the business, if longer, are classified as non-current assets. Leasehold rights pertain to the upfront cash payment made by the Group to Nayong Pilipino Foundation (NPF) for the right to lease and use NPF’s land located in a certain entertainment site for the Group’s construction and development of a casino complex. The cost of the asset is the amount of cash or cash equivalents paid, which is equivalent to the transaction price at the inception of the lease. Leasehold rights are amortized over 20 years on a straight-line basis, which is in accordance with the amortization period that is part of the lease term as approved by NPF (see Note 13). The asset’s carrying amount is written down immediately to its recoverable amount if the asset’s carrying amount is greater than its estimated recoverable amount (see Note 2.18). Leasehold rights are derecognized upon disposal or when no future economic benefits are expected to arise from the continued use of the asset. Any gain or loss arising on derecognition of the asset is included in profit or loss in the year the item is derecognized.
2.9 Property and Equipment
Land is measured at cost less any impairment in value. All other property and equipment are stated at cost less accumulated depreciation and any impairment in value.
The cost of an asset comprises its purchase price and directly attributable costs of bringing the asset to working condition for its intended use. Expenditures for additions, major improvements and renewals are capitalized while expenditures for repairs and maintenance are charged to expense as incurred. Depreciation is computed on a straight-line basis over the estimated useful lives of the assets as follows:
Buildings and building improvements 30 years Gaming machines and equipment 5 to 10 years Transportation equipment 5 to 10 years Furniture, fixtures and equipment 3 to 5 years

- 19 -
Construction in progress represents properties under construction and is stated at cost. This includes cost of construction, applicable borrowing cost and other direct costs (see Note 2.21). The account is not depreciated until such time that the assets are completed and available for use. The residual values, estimated useful lives and methods of depreciation of property and equipment are reviewed, and adjusted if appropriate, at the end of each reporting period.
Fully depreciated assets are retained in the accounts until these are no longer in use and no further charge for depreciation is made in respect of those assets. An asset’s carrying amount is written down immediately to its recoverable amount if the asset’s carrying amount is greater than its estimated recoverable amount (see Note 2.18). An item of property and equipment, including the related accumulated depreciation and any impairment losses, is derecognized upon disposal or when no future economic benefits are expected to arise from the continued use of the asset. Any gain or loss arising on derecognition of the asset (calculated as the difference between the net disposal proceeds and the carrying amount of the item) is included in profit or loss in the year the item is derecognized.
2.10 Investment Property
Investment property is property held either to earn rental income or for capital appreciation or for both, but not for sale in the ordinary course of business, use in the production or supply of goods or services or for administrative purposes. Investment property, which pertains to a portion of buildings and building improvements held under operating leases, is stated at cost less accumulated depreciation and any impairment in value. The cost of an asset comprises its purchase price and directly attributable costs of bringing the asset to working condition for its intended use. Expenditures for additions, major improvements and renewals are capitalized while expenditures for repairs and maintenance are charged to expense as incurred.
Depreciation of investment property is computed on a straight-line basis over the asset’s estimated useful life of 30 years. The carrying amount of investment property is written down immediately to its recoverable amount if the asset’s carrying amount is greater than its estimated recoverable amount (see Note 2.18).
Investment property, including the related accumulated depreciation and impairment losses, is derecognized upon disposal or when permanently withdrawn from use and no future economic benefit is expected from its disposal. Any gain or loss on the retirement or disposal of an investment property is recognized in profit or loss in the year of retirement or disposal.
Transfers to investment property are made when there is a change in use, evidenced by ending of owner-occupation or commencement of an operating lease to another property. Transfers from investment property are made when there is a change in use evidenced by commencement of the owner-occupation or commencement of development with a view to sell.

- 20 -
The cost of property for purposes of subsequent accounting for transfers from investment property to owner-occupied property is the carrying amount at the date of change of use. If the property occupied by the Group as an owner-occupied property becomes an investment property, the Group accounts for such property in accordance with the policy from the preceding paragraphs.
2.11 Financial Liabilities
Financial liabilities of the Group, which include Interest-bearing Loans and Borrowings, Trade and Other Payables (except tax-related liabilities, License fee payables, and Liability for unredeemed gaming points), Advances from Related Parties, Notes Payable, Derivative Liability and Other Non-current Liabilities, are recognized when the Group becomes a party to the contractual terms of the instrument. All interest-related charges incurred on a financial liability are recognized as expenses in profit or loss under the caption Finance Costs in the consolidated statement of comprehensive income.
Interest-bearing loans and borrowings and notes payable are raised for support of long-term funding of operations. They are recognized at proceeds received, net of direct issue costs. Finance charges, including direct issue costs, are charged to profit or loss on an accrual basis using the effective interest method and are added to the carrying amount of the instrument to the extent that these are not settled in the period in which they arise. Trade and other payables, advances from related parties and other non-current liabilities are recognized initially at their fair values and subsequently measured at amortized cost, using effective interest method for maturities beyond one year, less settlement payments.
Dividend distributions to stockholders are recognized as financial liabilities upon declaration by the Company’s BOD. Derivative liability represents the cumulative unfavorable changes in net fair value arising from the Group’s interest rate swap agreement.
Financial liabilities are classified at FVTPL if these result from trading activities or derivative transactions that are not accounted for as accounting hedges, or when the Group elects to designate a financial liability under this category. Included in this category is the Group’s Derivative Liability account in the consolidated statement of financial position (see Note 2.6). A substantial modification to the terms of a financial liability is accounted for as an extinguishment of the existing liability and the recognition of a new or modified liability at its fair value. A modification is considered substantial if the present value of the cash flows under the new terms, including net fees paid or received and discounted using the original effective interest rate, is different by at least 10% from the discounted present value of remaining cash flows of the original liability.
The fair value of the modified financial liability is determined based on its expected cash flows, discounted using the original effective interest rate. The difference between the carrying value of the original liability and fair value of the new liability is recognized as gain or loss on extinguishment of liability in profit or loss.

- 21 -
On the other hand, if the difference does not meet the 10% threshold, the original debt is not extinguished but merely modified. In such a case, the carrying amount is adjusted by the costs or fees paid or received in the restructuring.
Financial liabilities are classified as current liabilities if payment is due to be settled within one year or less after the end of the reporting period (or in the normal operating cycle of the business, if longer), or the Group does not have an unconditional right to defer settlement of the liability for at least twelve months after the reporting period. Otherwise, these are presented as non-current liabilities.
Financial liabilities are derecognized from the consolidated statement of financial position only when the obligations are extinguished either through discharge, cancellation or expiration. The difference between the carrying amount of the financial liability derecognized and the consideration paid or payable is recognized in profit or loss.
2.12 Offsetting of Financial Instruments
Financial assets and financial liabilities are offset and the resulting net amount, considered as a single financial asset or financial liability, is reported in the consolidated statement of financial position when there is a legally enforceable right to set-off the recognized amounts and there is an intention to settle on a net basis, or realize the asset and settle the liability simultaneously. The right of set-off must be available at the end of the reporting period, that is, it is not contingent on a future event. It must also be enforceable in the normal course of business, in the event of default, and in the event of insolvency or bankruptcy, and must be legally enforceable for both entity and all counterparties to the financial instruments. 2.13 Business Combination Business acquisitions are accounted for using the acquisition method of accounting. Goodwill represents the excess of the cost of an acquisition over the fair value of the Group’s share of the net identifiable assets of the acquired subsidiary at the date of acquisition. Subsequent to initial recognition, goodwill, if any, is measured at cost less any accumulated impairment losses. Goodwill is tested annually for impairment and carried at cost less accumulated impairment losses. Impairment losses on goodwill are not reversed (see Note 2.18). Negative goodwill, which is the excess of the Group’s interest in the net fair value of net identifiable assets acquired over acquisition cost, is charged directly to income. For the purpose of impairment testing, goodwill is allocated to cash-generating units or groups of cash-generating units that are expected to benefit from the business combination in which the goodwill arose. The cash-generating units or groups of cash-generating units are identified according to operating segment. Gains and losses on the disposal of an interest in a subsidiary include the carrying amount of goodwill relating to it. The cost of an acquisition is measured at the aggregate of the consideration transferred, measured at acquisition date fair value, and the amount of any non-controlling interests in the acquiree.
- 22 -
If the business combination is achieved in stages, the acquirer is required to remeasure its previously held equity interest in the acquiree at its acquisition-date fair value and recognize the resulting gain or loss, if any, in the profit or loss or other comprehensive income, as appropriate. Any contingent consideration to be transferred by the Group is recognized at fair value at the acquisition date. Subsequent changes to the fair value of the contingent consideration that is deemed to be an asset or liability is recognized in accordance with PAS 37, Provisions, Contingent Liabilities and Contingent Assets, either in profit or loss or as a change to other comprehensive income. Contingent consideration that is classified as equity is not remeasured, and its subsequent settlement is accounted for within equity. 2.14 Provisions and Contingencies
Provisions are recognized when present obligations will probably lead to an outflow of economic resources and they can be estimated reliably even if the timing or amount of the outflow may still be uncertain. A present obligation arises from the presence of a legal or constructive commitment that has resulted from past events.
Provisions are measured at the estimated expenditure required to settle the present obligation, based on the most reliable evidence available at the end of the reporting period, including the risks and uncertainties associated with the present obligation. Where there are a number of similar obligations, the likelihood that an outflow will be required in settlement is determined by considering the class of obligations as a whole. When time value of money is material, long-term provisions are discounted to their present values using a pretax rate that reflects market assessments and the risks specific to the obligation. The increase in the provision due to passage of time is recognized as interest expense. Provisions are reviewed at the end of each reporting period and adjusted to reflect the current best estimate. In those cases where the possible outflow of economic resource as a result of present obligations is considered improbable or remote, or the amount to be provided for cannot be measured reliably, no liability is recognized in the consolidated financial statements. Similarly, possible inflows of economic benefits to the Group that do not yet meet the recognition criteria of an asset are considered contingent assets; hence, are not recognized in the consolidated financial statements. On the other hand, any reimbursement that the Group can be virtually certain to collect from a third party with respect to the obligation is recognized as a separate asset not exceeding the amount of the related provision. Contingent asset is not recognized – but is only disclosed where an inflow of economic benefits is probable. The asset is only recognized when it is virtually certain that the inflow of economic benefits will arise to the Company.

- 23 -
2.15 Revenue and Expense Recognition
Revenue is recognized to the extent that the revenue can be reliably measured, it is probable that the economic benefits will flow to the Group, and the costs incurred or to be incurred can be measured reliably. In addition, the following specific recognition criteria must also be met before revenue is recognized:
(a) Gaming – Revenue is recognized from the net wins (losses) from gaming activities which represent the difference between coins and currencies deposited into the gaming machines and the payments to customers and, for other games, the difference between gaming wins and losses.
(b) Hotel, food, beverage and others – Revenues are recognized when services are rendered and upon delivery to and receipt of goods by the customer.
(c) Rentals – Revenue is recognized on a straight-line basis over the duration of the
lease term (see Note 2.16). For tax purposes, rental income is recognized based on the contractual terms of the lease.
(d) Rendering of services – Revenue is recognized when the performance of contractually
agreed tasks has been substantially rendered. Revenue from rendering of services include income from cinema and production shows, parking space, service commissions and others.
(e) Interest – Revenue is recognized as the interest accrues taking into account the
effective yield on the asset. Revenue is measured by reference to the fair value of consideration received or receivable by the Group for goods supplied and services provided, excluding any applicable value-added tax (VAT).
The Group provides a membership card for its patrons. Members earn points on gaming activity, and such points are redeemable for complimentary goods and services such as rooms, food, beverages and others. Members may also earn special coupons or awards as determined during marketing promotions. The Group records revenue for the original transaction and a provision (and a corresponding recognition of promotional allowances in profit or loss) for the value of the points earned by members by reference to the relative fair values of the complimentary goods or services. Costs and expenses are recognized in the consolidated statement of comprehensive income upon utilization of the service or at the date they are incurred. All finance costs are reported in profit or loss, on an accrual basis, except capitalized borrowing costs which are included as part of the cost of the related qualifying asset (see Note 2.21).

- 24 -
2.16 Leases
The Group accounts for its leases as follows:
(a) Group as Lessee
Leases which do not transfer to the Group substantially all the risks and benefits of ownership of the asset are classified as operating leases. Operating lease payments (net of any incentive received from the lessor) are recognized as expense in the consolidated statement of comprehensive income on a straight-line basis over the lease term. Associated costs, such as repairs and maintenance, and insurance, are expensed as incurred.
(b) Group as Lessor
Leases which do not transfer to the lessee substantially all the risks and benefits of ownership of the asset are classified as operating leases. Lease income from operating leases is recognized as income in the consolidated statement of comprehensive income on a straight-line basis over the lease term.
The Group determines whether an arrangement is, or contains, a lease based on the substance of the arrangement. It makes an assessment of whether the fulfillment of the arrangement is dependent on the use of a specific asset or assets and the arrangement conveys a right to use the asset. 2.17 Foreign Currency Transactions and Translation The accounting records of the Group are maintained in Philippine pesos. Foreign currency transactions during the year are translated into the functional currency at exchange rates which approximate those prevailing on transaction dates.
Foreign currency gains and losses resulting from the settlement of such transactions and from the translation at year-end exchange rates of monetary assets and liabilities denominated in foreign currencies are recognized in profit or loss. 2.18 Impairment of Non-financial Assets
The Group’s investments in associate and joint venture, advances for future investment, property and equipment, investment property, leasehold rights and other non-financial assets are subject to impairment testing whenever events or changes in circumstances indicate that their carrying amount may not be recoverable. For purposes of assessing impairment, assets are grouped at the lowest levels for which there are separately identifiable cash flows (cash-generating units). As a result, assets are tested for impairment either individually or at the cash-generating unit level.

- 25 -
Impairment loss is recognized in profit or loss for the amount by which the asset’s or cash-generating unit’s carrying amount exceeds its recoverable amounts which is the higher of its fair value less costs to sell and its value in use. In determining value in use, management estimates the expected future cash flows from each cash-generating unit and determines the suitable interest rate in order to calculate the present value of those cash flows. The data used for impairment testing procedures are directly linked to the Group’s latest approved budget, adjusted as necessary to exclude the effects of asset enhancements. Discount factors are determined individually for each cash-generating unit and reflect management’s assessment of respective risk profiles, such as market and asset-specific risk factors. All assets are subsequently reassessed for indications that an impairment loss previously recognized may no longer exist. An impairment loss is reversed if the asset’s cash generating unit’s recoverable amount exceeds its carrying amount.
2.19 Employee Benefits
(a) Retirement Benefit Obligation
A defined benefit plan is a post-employment plan that defines an amount of post-employment benefit that an employee will receive on retirement, usually dependent on one or more factors such as age, years of service and salary. The legal obligation for any benefits from this kind of post-employment plan remains with the Group, even if plan assets for funding the defined benefit plan have been acquired. Plan assets may include assets specifically designated to a long-term benefit fund, as well as qualifying insurance policies. The Group’s defined benefit post-employment plan covers all regular full-time employees. The pension plan is noncontributory and administered by a trustee. The liability recognized in the statement of financial position for a defined benefit plan is the present value of the defined benefit obligation less the fair value of plan assets at the end of the reporting period adjusted for the effect of the asset ceiling limit. The defined benefit obligation is calculated annually by independent actuaries using the projected unit credit method. The present value of the defined benefit obligation is determined by discounting the estimated future cash outflows for expected benefit payments using a discount rate derived from the interest rate of a zero coupon government bond as published by Philippine Dealing and Exchange Corporation, that is denominated in the currency in which the benefits will be paid and that has terms to maturity approximating to the terms of the related post-employment liability.
Remeasurement, comprising of actuarial gains and losses from experience adjustments and changes in actuarial assumptions and the return on plan assets (excluding amount included in net interest), are reflected immediately in the consolidated statement of financial position with a charge or credit recognized in other comprehensive income in the period which they arise. Net interest is calculated by applying the discount rate at the beginning of the period, taking account of any changes in the net defined benefit liability or asset during the period as a result of contributions and benefit payments. Net interest is included as part of Finance Costs or Finance Income account in the consolidated statement of comprehensive income.
Past service costs are recognized immediately in profit or loss in the period of a plan amendment and curtailment.

- 26 -
(b) Termination Benefits Termination benefits are payable when employment is terminated by the Group before the normal retirement date, or whenever an employee accepts voluntary redundancy in exchange for these benefits. The Group recognizes termination benefits at the earlier of when it can no longer withdraw the offer of such benefits and when it recognizes costs for a restructuring that is within the scope of PAS 37 and involves the payment of termination benefits. In the case of an offer made to encourage voluntary redundancy, the termination benefits are measured based on the number of employees expected to accept the offer. Benefits falling due more than 12 months after the reporting period are discounted to their present value.
(c) Bonus Plans
The Group recognizes a liability and an expense for bonuses, based on a formula that takes into consideration the profit attributable to the Group’s shareholders after certain adjustments. The Group recognizes a provision where it is contractually obliged to pay the benefits, or where there is a past practice that has created a constructive obligation.
(d) Compensated Absences and Other Employee Benefits
Compensated absences are recognized for the number of paid leave days (including holiday entitlement) remaining at the end of the reporting period. In addition, the Group recognizes a liability and an expense for other employee benefits based on a formula that takes into consideration the profit attributable to the Group’s employees after certain adjustments. The Group recognizes a provision where it is contractually obliged to pay the benefits, or where there is a past practice that has created a constructive obligation. These are included in Accrued employee benefits under Trade and Other Payables account in the consolidated statement of financial position at the undiscounted amount that the Group expects to pay as a result of the unused entitlement.
2.20 Share-based Employee Remuneration The Company has adopted an Employee Stock Option Plan (ESOP) that grants share options to eligible key executive officers. The services received in exchange for the grant, and the corresponding share options, are valued by reference to the fair value of the equity instruments granted at grant date. The fair value excludes the impact of non-market vesting conditions (for example, profitability and sales growth targets and performance conditions), if any. The share-based remuneration is recognized as an expense in profit or loss with a corresponding credit to retained earnings. The expense is recognized during the vesting period based on the available estimate of the number of share options expected to vest. The estimate is subsequently revised, if necessary, such that it equals the number of options that ultimately vest on vesting date. No subsequent adjustment is made to expense after vesting date, even if the share options are ultimately not exercised. Upon exercise of the share option, the proceeds received, net of any directly attributable transaction costs up to the nominal value of the shares issued are allocated to capital stock with any excess being recorded as additional paid-in capital (APIC).

- 27 -
The Company’s ESOP is exempt from the registration requirements of SEC’s Securities Regulation Code with respect to the issuance of the common shares, not to exceed 945,352,491 common shares, or 6% of the outstanding capital stock of the Company listed with the PSE, to eligible employees pursuant to the Company’s ESOP adopted by the Company’s shareholders and BOD effective June 13, 2014. The purpose of the ESOP is to (a) strengthen the alignment of interests between key employees and consultants of the Company and the Company’s shareholders through the ownership of the Company’s shares of common stock and thereby increase focus on the Company’s share value; (b) motivate, attract and retain the services of key employees and consultants of the Company, upon whose judgment, valuable work and special efforts, the day-to-day and long-term success and development of the business and the operations of the Company are largely dependent; and, (c) encourage long-term commitment of the key employees and consultants of the Company to contribute to the long-term financial success of the Company. The ESOP is being administered by the Remuneration and Compensation Committee of the BOD. As of December 31, 2017, the Company has not granted any option to its 115 eligible optionees.
2.21 Borrowing Costs Borrowing costs are recognized as expenses in the period in which they are incurred, except to the extent that they are capitalized. Borrowing costs that are attributable to the acquisition, construction or production of a qualifying asset (i.e., an asset that takes a substantial period of time to get ready for its intended use or sale) are capitalized as part of cost of such asset. The capitalization of borrowing costs commences when expenditures for the asset and borrowing costs are being incurred and activities that are necessary to prepare the asset for its intended use or sale are in progress. Capitalization ceases when substantially all such activities are complete. Investment income earned on the temporary investment of specific borrowings pending their expenditure on qualifying assets is deducted from the borrowing costs eligible for capitalization.
2.22 Income Taxes
The Company is subject to 25% and 15% license fees, inclusive of franchise tax and in lieu of all taxes, with reference to the income component of the gross gaming revenues, as provided under the Provisional License Agreement with PAGCOR [see Notes 21.2 and 24.4(e)].
For hotel operations, the Group is subject to the 5% gross income tax (GIT) on income solely derived from servicing foreign tourists (see Note 21.3).
For other sources of income, the Group is subject to the 30% Regular Corporate Income Tax (RCIT) rate. The related income tax expense presented in profit or loss in the consolidated statement of comprehensive income is determined using the liability method of deferred tax accounting described in the succeeding paragraphs.
- 28 -
Current tax assets or liabilities comprise those claims from, or obligations to, fiscal authorities relating to the current or prior reporting period, that are uncollected or unpaid at the end of the reporting period. They are calculated according to the tax rates and tax laws applicable to the fiscal periods to which they relate, based on the taxable profit for the year. All changes to current tax assets or liabilities are recognized as a component of tax expense in profit or loss. Deferred tax is accounted for, using the liability method on temporary differences at the end of the reporting period between the tax base of assets and liabilities and their carrying amounts for financial reporting purposes. Under the liability method, with certain exceptions, deferred tax liabilities are recognized for all taxable temporary differences and deferred tax assets are recognized for all deductible temporary differences and the carryforward of unused tax losses and unused tax credits to the extent that it is probable that taxable profit will be available against which the deferred income tax asset can be utilized. Unrecognized deferred tax assets are reassessed at the end of each reporting period and are recognized to the extent that it has become probable that future taxable profit will be available to allow such deferred tax assets to be recovered.
The carrying amount of deferred tax assets is reviewed at the end of each reporting period and reduced to the extent that it is probable that sufficient taxable profit will be available to allow all or part of the deferred tax asset to be utilized. Deferred tax assets and liabilities are measured at the tax rates that are expected to apply to the period when the asset is realized or the liability is settled, based on tax rates and tax laws that have been enacted or substantively enacted at end of the reporting period.
The measurement of deferred tax liabilities and assets reflects the tax consequences that would follow from the manner in which the Group expects, at the end of the reporting period, to recover or settle the carrying amount of its assets and liabilities.
Most changes in deferred tax assets or liabilities are recognized as a component of tax expense in profit or loss, except to the extent that it relates to items recognized in other comprehensive income or directly in equity. In this case, the tax is also recognized in other comprehensive income or directly in equity, respectively. Deferred tax assets and deferred tax liabilities are offset if the Group has a legally enforceable right to set-off current tax assets against current tax liabilities and the deferred taxes relate to the same entity and the same taxation authority.
2.23 Related Party Transactions and Relationships Related party transactions are transfers of resources, services or obligations between the Group and its related parties, regardless whether a price is charged.
Parties are considered to be related if one party has the ability to control the other party or exercise significant influence over the other party in making financial and operating decisions. These parties include: (a) individuals owning, directly or indirectly through one or more intermediaries, control or are controlled by, or under common control with the Group; (b) associates; (c) individuals owning, directly or indirectly, an interest in the voting power of the Group that gives them significant influence over the Group and close members of the family of any such individual; and, (d) the Group’s retirement plan (see Note 20.2).

- 29 -
In considering each possible related party relationship, attention is directed to the substance of the relationship and not merely on the legal form.
2.24 Equity Capital stock, which consists of common and preferred shares, represents the nominal value of shares that have been issued. APIC includes any premiums received on the issuance of shares of stock. Any transaction costs associated with the issuance of shares are deducted from APIC, net of any related income tax benefits.
Treasury shares are stated at the cost of reacquiring such shares and are deducted from equity until the shares are cancelled, reissued or disposed of. Revaluation reserves comprise accumulated unrealized gains and losses due to the revaluation of AFS financial assets and remeasurements of retirement benefit obligation.
Retained earnings include all current and prior period results of operations as reported in the profit or loss section of the consolidated statement of comprehensive income, reduced by the amounts of dividends declared. Non-controlling interests represent the portion of the net assets and profit or loss not attributable to the Parent Company’s shareholders which are presented separately in the Group’s consolidated statement of comprehensive income and within the equity in the Group’s consolidated statement of financial position and consolidated statement of changes in equity.
2.25 Earnings Per Share
Basic earnings per share (EPS) is determined by dividing the net profit for the period attributable to common shareholders by the weighted average number of common shares issued and outstanding during the period, after giving retroactive effect to any stock dividends declared and stock splits in the current period (see Notes 23.1 and 29). Diluted EPS is computed by adjusting the weighted average number of ordinary shares outstanding to assume conversion of potential dilutive shares.
2.26 Events After the End of the Reporting Period Any post-year-end event that provides additional information about the Group’s consolidated financial position at the end of the reporting period (adjusting event) is reflected in the consolidated financial statements. Post-year-end events that are not adjusting events, if any, are disclosed when material to the consolidated financial statements.

- 30 -
3. SIGNIFICANT ACCOUNTING JUDGMENTS AND ESTIMATES
The preparation of the Group’s consolidated financial statements in accordance with PFRS requires management to make judgments and estimates that affect the amounts reported in the consolidated financial statements and related notes. Judgments and estimates are continually evaluated and are based on historical experience and other factors, including expectations of future events that are believed to be reasonable under the circumstances. Actual results may ultimately differ from these estimates. 3.1 Critical Management Judgments in Applying Accounting Policies
In the process of applying the Group’s accounting policies, management has made the following judgments, apart from those involving estimation, which have the most significant effect on the amounts recognized in the consolidated financial statements:
(a) Impairment of AFS Financial Assets The determination when an investment is other-than-temporarily impaired requires significant judgment. In making this judgment, the Group evaluates, among other factors, the duration and extent to which the fair value of an investment is less than its cost, and the financial health of and near-term business outlook for the investee. Based on the recent evaluation of information and circumstances affecting the Group’s AFS financial assets, management concluded that the assets are not impaired in 2017, 2016 and 2015. However, future changes in those information and circumstances might significantly affect the carrying amount of the assets.
(b) Distinction Between Investment Properties and Owner-managed Properties
The Group determines whether a property qualifies as investment property. In making its judgment, the Group considers whether the property generates cash flows largely independent of the other assets held by an entity. Owner-managed properties generate cash flows that are attributable not only to the property but also to other assets used in the production or supply process.
Some properties comprise a portion that is held to earn rental or for capital appreciation and another portion that is held for administrative purposes. If these portions can be sold separately (or leased out separately under finance lease), the Group accounts for the portions separately. If the portions cannot be sold separately, the property is accounted for as investment property only if an insignificant portion is held for use for administrative purposes. Judgment is applied in determining whether ancillary services are so significant that a property does not qualify as investment property. The Group considers each property separately in making its judgment.
(c) Distinction Between Operating and Finance Leases
The Group has entered into various lease agreements. Critical judgment was exercised by management to distinguish each lease agreement as either an operating or finance lease by looking at the transfer or retention of significant risk and rewards of ownership of the properties covered by the agreements. Failure to make the right judgment will result in either overstatement or understatement of assets and liabilities. As of December 31, 2017 and 2016, management determined that its current lease agreements are operating leases.

- 31 -
(d) Recoverability of Insurance Claims
The Group recognized insurance recoveries in 2017 covering actual losses incurred for damaged capital assets, and other casualty losses arising from the arson and robbery incident in June 2017 (see Note 24.6). Critical judgment was exercised by management to evaluate the recoverability of said claims as highly probable and virtually certain. The Company has not yet accrued the whole amount of recoverable claims as of December 31, 2017 pending its finalization with the insurance company. The amount recognized as insurance claims receivable as of December 31, 2017 is presented as part of Trade and Other Receivables account in the 2017 consolidated statement of financial position (see Note 6).
(e) Recognition of Provisions and Contingencies
Judgment is exercised by management to distinguish between provisions and contingencies. Policies on recognition and disclosure of provisions of contingencies are discussed in Note 2.14 and relevant disclosures are presented in Note 24.
(f) Determination of Joint Control and Significant Influence
Judgment is exercised in determining whether the Group has joint control of an arrangement or significant influence over an entity. In assessing each interest over an entity, the Group considers voting rights, representation on the board of directors or equivalent governing body of the investee, participation in policy-making process and all other facts and circumstances, including terms of any contractual arrangement. The Group determined that it has significant influence in MBPHI; hence, the investee is treated as an associate (see Note 9). On the other hand, the Group determined that it has joint control and rights to net assets of FRTMI, which is a joint arrangement based on the structure, legal, form, terms and other facts and circumstances of the arrangement (see Note 9).
3.2 Key Sources of Estimation Uncertainty
The following are the Group’s key assumptions concerning the future, and other key sources of estimation uncertainty at the end of the reporting period, that have a significant risk of causing a material adjustment to the carrying amounts of assets and liabilities within the next reporting period:
(a) Determination of Net Realizable Values of Inventories
In determining the net realizable value of inventories, management takes into account the most reliable evidence available at the time the estimates are made. The Group’s inventories, which include perishable goods and operating supplies, are affected by certain factors which may cause inventory losses. Moreover, future realization of the carrying amounts of inventories is affected by price changes in different market segments of food and beverages and operating supplies. Both aspects are considered key sources of estimation uncertainty which may cause significant adjustments to the Group’s inventories within the next reporting period.
- 32 -
In 2017, 2016 and 2015, no inventory write-down was recognized by the Group as management believes that the carrying value of inventories does not exceed its net realizable value (see Note 7).
(b) Estimation of Useful Lives of Property and Equipment and Investment Property
The Group estimates the useful lives of property and equipment and investment property based on the period over which the assets are expected to be available for use. The estimated useful lives of property and equipment and investment property are reviewed periodically and are updated if expectations differ from previous estimates due to physical wear and tear, technical or commercial obsolescence and legal or other limits on the use of the assets.
The carrying amounts of property and equipment and investment property are presented in Notes 11 and 12, respectively. Actual results, however, may vary due to changes in estimates brought about by changes in factors mentioned above. There was no change in estimated useful lives of property and equipment and investment property in 2017 and 2016.
(c) Impairment of Trade and Other Receivables and Advances to Related Parties
Adequate amount of allowance is made for specific and groups of accounts, where objective evidence of impairment exists. The Group evaluates these accounts based on available facts and circumstances, including, but not limited to, the length of the Group’s relationship with the customers and other counterparties, their current credit status based on known market forces, average age of accounts, collection experience and historical loss experience. Based on management’s evaluation, there were no impairment losses necessary to be recognized on trade and other receivables and advances to related parties in 2017, 2016 and 2015 (see Notes 6 and 22.5).
(d) Fair Value Measurement of Derivative Financial Instruments
Management applies valuation techniques to determine the fair value of the derivative financial instruments where active market quotes are not available. The determination of the fair value of derivatives is dependent on the selection of certain assumptions used by third party experts in calculating such amounts. Those assumptions include, among others, expected movements in the index cumulative performance as defined in the swap agreement. Changes in assumptions could affect reported fair value of financial instruments. The Group uses judgment to select a variety of methods and make assumptions that are mainly based on market conditions existing at the end of each reporting period.
(e) Impairment of Non-Financial Assets
The Group’s policy on estimating the impairment of non-financial assets is discussed in Note 2.18. Though management believes that the assumptions used in the estimation of fair values reflected in the consolidated financial statements are appropriate and reasonable, significant changes in these assumptions may materially affect the assessment of recoverable values and any resulting impairment loss could have a material adverse effect on the results of operations.

- 33 -
There were no impairment losses recognized on the Group’s investments in associate and joint venture, advances for future investment, property and equipment, investment property, leasehold rights and other non-financial assets based on management’s evaluation in 2017, 2016 and 2015.
(f) Determination of Fair Value of Investment Property
Investment property is measured using the cost model. The fair value disclosed in Note 12 is determined by the Group based on the appraisal report prepared by independent appraisers using the relevant valuation methodology as discussed in Note 27.4.
For investment properties with appraisal conducted prior to the end of the current reporting period, management determines whether there are significant circumstances during the intervening period that may require adjustments or changes in the disclosure of fair value of those properties. A significant change in these elements may affect the prices and the value of the assets. As of December 31, 2017 and 2016, the Group determined that there were no significant circumstances that may affect the fair value determination of investment property.
(g) Valuation of Retirement Benefit Obligation
The determination of the Group’s obligation and cost of post-employment benefit is dependent on the selection of certain assumptions used by actuaries in calculating such amounts. Those assumptions include, among others, discount rate s and expected rate of salary increase. A significant change in any of these actuarial assumptions may generally affect the recognized expense and the carrying amount of the retirement benefit obligation in the next reporting period. In accordance with PFRS, actual results that differ from the assumptions are accumulated and amortized over future periods and therefore, generally affect the expense and the carrying amount of retirement benefit obligation in such future periods.
The amounts of retirement benefit obligation and expense and an analysis of the movements in the estimated present value of retirement benefit obligation are presented in Note 20.2.
(h) Determination of Realizable Amount of Deferred Tax Assets The Group reviews its deferred tax assets at the end of each reporting period and reduces the carrying amount to the extent that it is no longer probable that sufficient taxable profit will be available to allow all or part of the deferred tax asset to be utilized.
The carrying amount of net deferred tax assets and relevant disclosures as at December 31, 2017 and 2016 are presented in Note 21.1.

- 34 -
(i) Determination of Fair Value of Gaming Points and Estimation of Liability for Unredeemed Gaming Points
The Group provides gaming points to its patrons based on gaming activity. Gaming points are redeemable in a wide selection of redemption categories. The Group recognizes the fair values of gaming points, based on redemption terms, historical redemption pattern of patrons and fair value of promotional activities per source (i.e., hotel, food and beverage, and others). The Group reassesses the measurement basis used for calculating the fair value of gaming points on a regular basis. The carrying value of the gaming points accrued by the Group is presented as Liability for unredeemed gaming points under Trade and Other Payables account in the consolidated statements of financial position (see Note 15).
4. SEGMENT INFORMATION
4.1 Business Segments
The Group is organized into two major business segments – casino and non-casino segments. These components of the Group, engaged in business activities from which revenues and expenses, including revenues and expenses that relate to transactions with other component, are reviewed regularly by the ExeCom, acting as the chief operating decision-makers of the Group. The ExeCom makes decisions about resources to be allocated to each of the segments of the Group and assesses its performances, for which discrete financial information is made available to make the decisions. Presented below is the basis of the Group in reporting its primary segment information. (a) The Casino segment is engaged in casino operations. This segment includes the
operation of Resorts World Manila.
(b) The Non-casino segment includes the operations of various brands of hotels (Maxims, Marriott and Holiday Inn Express), leasing (Newport Entertainment Commercial Center and others), performing arts theater (Newport Performing Arts Theater), cinema (Newport Cinemas) and other activities which are peripheral to the casino operations.
The Group has not identified any segment based on geographical location (see Note 4.4).
4.2 Segment Assets and Liabilities
Segment assets are allocated based on their physical location and use or direct association with a specific segment. They include all operating assets used by a segment and consist principally of operating cash and cash equivalents, trade and other receivables, inventories, property and equipment and investment property. Segment liabilities include all operating liabilities and consist principally of trade and other payables, interest-bearing loans and borrowings, and notes payable. 4.3 Intersegment Transactions
Segment revenues, expenses and performance include sales and purchases between business segments. Transfer prices between operating segments are set on an arm’s length basis in a manner similar to transactions with third parties. Such transactions are eliminated in consolidation.
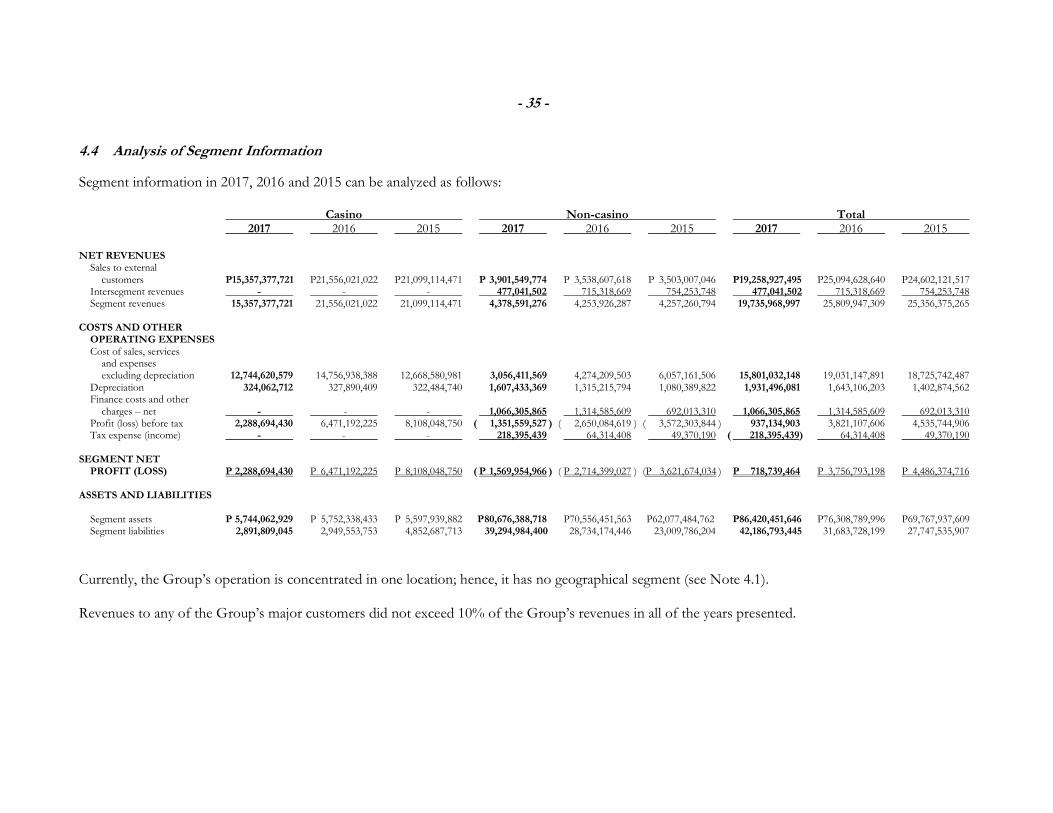
4.4 Analysis of Segment Information
Segment information in 2017, 2016 and 2015 can be analyzed as follows: Casino Non-casino Total 2017 2016 2015 2017 2016 2015 2017 2016 2015 NET REVENUES Sales to external customers P15,357,377,721 P21,556,021,022 P21,099,114,471 P 3,901,549,774 P 3,538,607,618 P 3,503,007,046 P19,258,927,495 P25,094,628,640 P24,602,121,517 Intersegment revenues - - - 477,041,502 715,318,669 754,253,748 477,041,502 715,318,669 754,253,748 Segment revenues 15,357,377,721 21,556,021,022 21,099,114,471 4,378,591,276 4,253,926,287 4,257,260,794 19,735,968,997 25,809,947,309 25,356,375,265 COSTS AND OTHER OPERATING EXPENSES Cost of sales, services and expenses excluding depreciation 12,744,620,579 14,756,938,388 12,668,580,981 3,056,411,569 4,274,209,503 6,057,161,506 15,801,032,148 19,031,147,891 18,725,742,487 Depreciation 324,062,712 327,890,409 322,484,740 1,607,433,369 1,315,215,794 1,080,389,822 1,931,496,081 1,643,106,203 1,402,874,562 Finance costs and other charges – net - - - 1,066,305,865 1,314,585,609 692,013,310 1,066,305,865 1,314,585,609 692,013,310 Profit (loss) before tax 2,288,694,430 6,471,192,225 8,108,048,750 ( 1,351,559,527 ) ( 2,650,084,619 ) ( 3,572,303,844 ) 937,134,903 3,821,107,606 4,535,744,906 Tax expense (income) - - - 218,395,439 64,314,408 49,370,190 ( 218,395,439) 64,314,408 49,370,190 SEGMENT NET PROFIT (LOSS) P 2,288,694,430 P 6,471,192,225 P 8,108,048,750 ( P 1,569,954,966 ) ( P 2,714,399,027 ) (P 3,621,674,034 ) P 718,739,464 P 3,756,793,198 P 4,486,374,716
ASSETS AND LIABILITIES Segment assets P 5,744,062,929 P 5,752,338,433 P 5,597,939,882 P 80,676,388,718 P70,556,451,563 P62,077,484,762 P86,420,451,646 P76,308,789,996 P69,767,937,609 Segment liabilities 2,891,809,045 2,949,553,753 4,852,687,713 39,294,984,400 28,734,174,446 23,009,786,204 42,186,793,445 31,683,728,199 27,747,535,907
Currently, the Group’s operation is concentrated in one location; hence, it has no geographical segment (see Note 4.1). Revenues to any of the Group’s major customers did not exceed 10% of the Group’s revenues in all of the years presented.
- 35 -

4.5 Reconciliations
Presented below is a reconciliation of the Group’s segment information to the key financial information presented in its consolidated financial statements.
2017 2016 2015
Net revenues
Total segment revenues P 19,735,968,997 P 25,809,947,309 P 25,356,375,265
Elimination of intersegment
revenues ( 477,041,502) ( 715,318,669) ( 754,253,748)
Revenues as reported
in consolidated profit or loss P 19,258,927,495 P 25,094,628,640 P 24,602,121,517
Net profit or loss
Segment net profit P 718,739,464 P 3,756,793,198 P 4,486,374,716
Elimination of intersegment
transactions ( 477,041,502) ( 358,266,584) ( 468,765,984 )
Net profit as reported
in consolidated profit or loss P 241,697,962 P 3,398,526,614 P 4,017,608,732
Assets
Segment assets P 86,420,451,646 P 76,308,789,996 P 69,767,937,609
Total assets reported in the
consolidated statements
of financial position P 86,420,451,646 P 76,308,789,996 P 69,767,937,609
Liabilities
Segment liabilities P 42,186,793,445 P 31,683,728,199 P 27,747,535,907
Total liabilities reported in the
consolidated statements
of financial position P 42,186,793,445 P 31,683,728,199 P 27,747,535,907
5. CASH AND CASH EQUIVALENTS Cash and cash equivalents include the following components as at December 31:
Note 2017 2016
Cash on hand and in banks P 7,495,313,292 P 10,140,595,287 Short-term placements 24.4(c) 3,057,860,384 3,109,613,654
P 10,553,173,676 P 13,250,208,941
Cash in banks generally earn interest based on daily bank deposit rates.
Short-term placements are made for varying periods ranging from 30 to 90 days in 2017 and 2016, and earn effective interests ranging from 1.5% to 2.8% per annum in 2017, 1.3% to 2.3% per annum in 2016 and 1.3% to 2.5% per annum in 2015.
- 36 -

- 37 -
The balance of Cash and Cash Equivalents does not include Investments in time deposits, which are shown under Prepayments and Other Current Assets account in the consolidated statements of financial position. The time deposits amounting to P117.1 million and P115.7 million as at December 31, 2017 and 2016, respectively, have a term of 360 days (see Note 8). Interest income from Cash and Cash Equivalents and Investments in time deposits for the years ended December 31, 2017, 2016 and 2015 is presented under Finance Income account in the consolidated statements of comprehensive income (see Note 19).
6. TRADE AND OTHER RECEIVABLES
This account is composed of the following:
Notes 2017 2016
Trade receivables 22.2, 22.7 P 637,211,603 P 529,867,058 Advances to suppliers 5,155,798,803 3,347,247,054 Claims receivables 24.6 762,551,480 - Interest receivables 5,578,188 4,030,045 Others 22.4 195,556,320 114,421,605 P 6,756,696,394 P 3,995,565,762
Trade receivables are usually due within 30 days and do not bear any interest. All trade receivables are subject to credit risk exposure.
Advances to suppliers which pertain to mobilization funds provided to the Group’s suppliers for use primarily in the construction of the Group’s buildings and building improvements and are reduced proportionately upon receipt of progress billings from the said suppliers. Claims receivables pertain to expected minimum insurance and recoveries from losses arising from property damages and other casualty losses [see Notes 3.1(d) and 24.6]. All of the Group’s trade and other receivables have been reviewed for indications of impairment. Based on this review, all receivables were found to be collectible.
7. INVENTORIES Inventories as at the end of 2017 and 2016 are stated at cost. The details of inventories are shown below.
2017 2016
Operating supplies P 115,505,037 P 164,478,078 Food and beverage 9,897,717 8,065,916 Others 1,019,966 1,748,746
P 126,422,720 P 174,292,740
Inventories include membership program items representing supplies and other inventory items of the Group’s loyalty and membership program.

- 38 -
8. PREPAYMENTS AND OTHER CURRENT ASSETS The composition of this account is shown below.
Note 2017 2016
Input VAT P1,266,757,435 P 809,479,888 Prepayments 362,338,688 211,662,713 Investments in time deposits 5 117,126,031 115,737,185 Others 4,810,635 10,077,627
P1,751,032,789 P1,146,957,413
Prepayments include prepaid taxes, insurance and rentals, which are expected to be realized in the next reporting period. Investments in time deposits are placed for a period of 360 days and earn effective interest of 1.5% in 2017, 1.4% in 2016, and 1.3% in 2015 (see Note 19).
9. INVESTMENTS IN AN ASSOCIATE AND A JOINT VENTURE, AND NON-CONTROLLING INTERESTS
(a) Investments in an Associate and a Joint Venture The movements in the carrying value of Investments in Associate and Joint Venture account as of December 31, which is accounted for under the equity method in the consolidated financial statements of the Group, are shown below.
2017 2016 Balance at beginning of year P 1,472,826,151 P 1,415,228,090 Additional investment to associate during the year 150,000,000 - Share in net profit of associate and joint venture 40,089,829 57,598,061 Balance at end of year P 1,662,915,980 P 1,472,826,151
The financial information of MBPHI, which is considered a significant associate, is shown below.
2017 2016
Assets P 8,805,515,157 P 7,122,239,847 Liabilities 5,422,275,828 4,119,645,785 Equity 3,383,239,329 3,002,594,064
In 2015, the Group entered into a joint venture agreement with VLI to form FRTMI, a joint venture and newly incorporated entity in the same year. The investment made by the Group amounting to P10.0 million is accounted for under the equity method. FRTMI started commercial operations in June 2016. FRTMI’s existing assets and equity significantly represent capital infusion from the joint venturers.
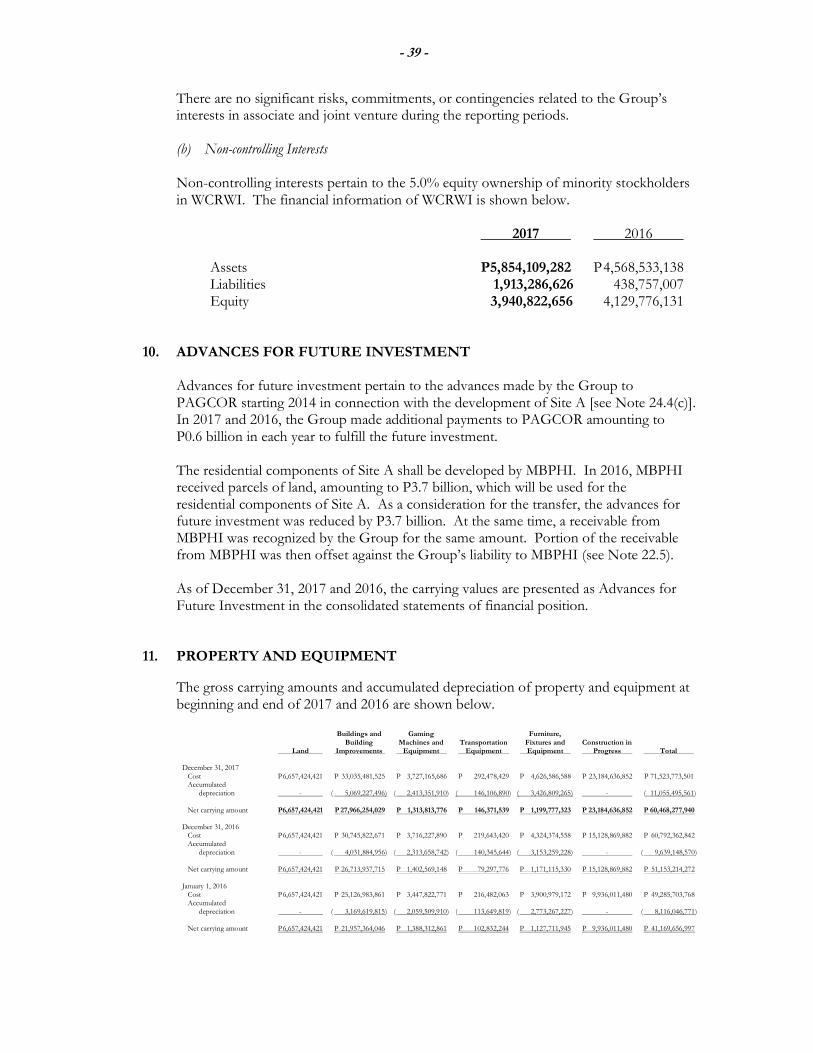
- 39 -
There are no significant risks, commitments, or contingencies related to the Group’s interests in associate and joint venture during the reporting periods.
(b) Non-controlling Interests Non-controlling interests pertain to the 5.0% equity ownership of minority stockholders in WCRWI. The financial information of WCRWI is shown below.
2017 2016
Assets P5,854,109,282 P 4,568,533,138 Liabilities 1,913,286,626 438,757,007 Equity 3,940,822,656 4,129,776,131 10. ADVANCES FOR FUTURE INVESTMENT
Advances for future investment pertain to the advances made by the Group to PAGCOR starting 2014 in connection with the development of Site A [see Note 24.4(c)]. In 2017 and 2016, the Group made additional payments to PAGCOR amounting to P0.6 billion in each year to fulfill the future investment. The residential components of Site A shall be developed by MBPHI. In 2016, MBPHI received parcels of land, amounting to P3.7 billion, which will be used for the residential components of Site A. As a consideration for the transfer, the advances for future investment was reduced by P3.7 billion. At the same time, a receivable from MBPHI was recognized by the Group for the same amount. Portion of the receivable from MBPHI was then offset against the Group’s liability to MBPHI (see Note 22.5). As of December 31, 2017 and 2016, the carrying values are presented as Advances for Future Investment in the consolidated statements of financial position.
11. PROPERTY AND EQUIPMENT
The gross carrying amounts and accumulated depreciation of property and equipment at beginning and end of 2017 and 2016 are shown below.
Buildings and Gaming Furniture, Building Machines and Transportation Fixtures and Construction in Land Improvements Equipment Equipment Equipment Progress Total December 31, 2017 Cost P 6,657,424,421 P 33,035,481,525 P 3,727,165,686 P 292,478,429 P 4,626,586,588 P 23,184,636,852 P 71,523,773,501 Accumulated depreciation - ( 5,069,227,496) ( 2,413,351,910) ( 146,106,890) ( 3,426,809,265) - ( 11,055,495,561)
Net carrying amount P6,657,424,421 P 27,966,254,029 P 1,313,813,776 P 146,371,539 P 1,199,777,323 P 23,184,636,852 P 60,468,277,940 December 31, 2016 Cost P 6,657,424,421 P 30,745,822,671 P 3,716,227,890 P 219,643,420 P 4,324,374,558 P 15,128,869,882 P 60,792,362,842 Accumulated depreciation - ( 4,031,884,956) ( 2,313,658,742) ( 140,345,644) ( 3,153,259,228) - ( 9,639,148,570)
Net carrying amount P 6,657,424,421 P 26,713,937,715 P 1,402,569,148 P 79,297,776 P 1,171,115,330 P 15,128,869,882 P 51,153,214,272 January 1, 2016 Cost P 6,657,424,421 P 25,126,983,861 P 3,447,822,771 P 216,482,063 P 3,900,979,172 P 9,936,011,480 P 49,285,703,768 Accumulated depreciation - ( 3,169,619,815) ( 2,059,509,910) ( 113,649,819) ( 2,773,267,227) - ( 8,116,046,771) Net carrying amount P 6,657,424,421 P 21,957,364,046 P 1,388,312,861 P 102,832,244 P 1,127,711,945 P 9,936,011,480 P 41,169,656,997

- 40 -
A reconciliation of the carrying amounts at the beginning and end of 2017 and 2016 of property and equipment is shown below.
Buildings and Gaming Furniture, Building Machines and Transportation Fixtures and Construction in Land Improvements Equipment Equipment Equipment Progress Total Balance at January 1, 2017,
net of accumulated depreciation P 6,657,424,421 P 26,713,937,715 P 1,402,569,148 P 79,297,776 P 1,171,115,330 P 15,128,869,882 P 51,153,214,272 Additions - 1,583,841,225 482,150,031 91,924,285 451,270,904 9,230,405,406 11,839,591,851 Reclassifications - 1,174,638,436 - - - ( 1,174,638,436) - Disposals - - ( 2,225,475) - ( 497,810) - ( 2,723,285 ) Write-off of damaged assets - ( 377,467,784) ( 260,327,124) - ( 14,809,416) - ( 652,604,324 ) Depreciation charges for the year - ( 1,128,695,563) ( 308,352,804) ( 24,850,522) ( 407,301,685) - ( 1,869,200,574 ) Balance at December 31, 2017, net of accumulated depreciation P6,657,424,421 P 27,966,254,029 P 1,313,813,776 P 146,371,539 P 1,199,777,323 P 23,184,636,852 P 60,468,277,940 Balance at January 1, 2016,
net of accumulated depreciation P 6,657,424,421 P 21,957,364,046 P 1,388,312,861 P 102,832,244 P 1,127,711,945 P 9,936,011,480 P 41,169,656,997 Additions - 2,615,799,473 326,500,843 3,161,357 445,893,511 8,196,380,623 11,587,735,807 Reclassifications - 3,003,522,221 - - - ( 3,003,522,221) - Disposals - ( 3,061) ( 9,909,562) - ( 13,905,213) - ( 23,817,836 ) Depreciation charges for the year - ( 862,744,964) ( 302,334,994) ( 26,695,825) ( 388,584,913) - ( 1,580,360,696 ) Balance at December 31, 2016, net of accumulated depreciation P 6,657,424,421 P 26,713,937,715 P 1,402,569,148 P 79,297,776 P 1,171,115,330 P 15,128,869,882 P 51,153,214,272
Construction in progress pertains to the accumulated costs incurred on the casino and hotel sites being constructed as part of the Group’s investment commitments in accordance with its Provisional License Agreement with PAGCOR [see Note 24.4(c)]. In 2017, the construction of RunWay Manila, a pedestrian link bridge that connects Ninoy Aquino International Airport Terminal (NAIA) 3 and Newport City, was completed (see Note 24.6). In 2016, the construction of MWW, which is a 10-storey annex to the existing Marriott Hotel with additional 228 rooms, was completed (see Note 1). Accordingly, the respective accumulated costs incurred for these facilities were reclassified from Construction in progress to Buildings and building improvements in 2017 and 2016. Total property and equipment includes capitalized borrowing costs amounting to P1,132.1 million in 2017 and P705.6 million in 2016 representing the actual borrowing costs, net of related investment income, incurred on specific and general borrowings obtained to fund the construction project (see Notes 14 and 16). The capitalization rate used was based on effective interest rates of applicable specific and general borrowings ranging from 3.8% to 7.4% and 4.1% to 7.4% in 2017 and 2016, respectively.
The Group sold certain property and equipment to third parties for a total consideration of P6.9 million, P20.9 million and 29.7 million in 2017, 2016, and 2015, respectively. The related gain on sale in 2017 amounting to P4.2 million and loss on sale in 2016 amounting to P2.9 million is presented under Other Operating Income – net in the consolidated statements of comprehensive income, while no gain or loss was recognized for the sale in 2015 (see Note 18). There was no outstanding receivable related to these transactions as of December 31, 2017 and 2016. In 2017, the Group wrote-off certain property and equipment with carrying value of P652.6 million. This is presented as part of Losses from casualty, net of insurance claims under Other Income (Charges) account in the 2017 consolidated statement of comprehensive income (see Note 24.6).
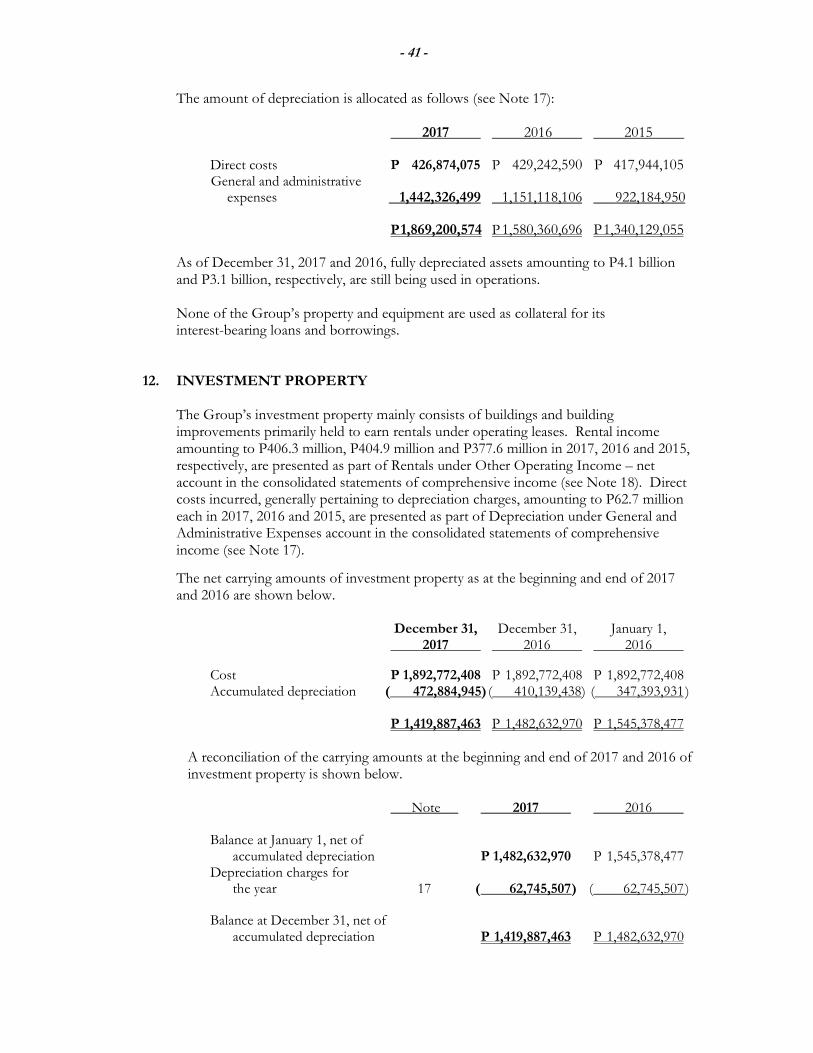
- 41 -
The amount of depreciation is allocated as follows (see Note 17):
2017 2016 2015
Direct costs P 426,874,075 P 429,242,590 P 417,944,105 General and administrative
expenses 1,442,326,499 1,151,118,106 922,184,950 P 1,869,200,574 P 1,580,360,696 P 1,340,129,055
As of December 31, 2017 and 2016, fully depreciated assets amounting to P4.1 billion and P3.1 billion, respectively, are still being used in operations. None of the Group’s property and equipment are used as collateral for its interest-bearing loans and borrowings.
12. INVESTMENT PROPERTY The Group’s investment property mainly consists of buildings and building improvements primarily held to earn rentals under operating leases. Rental income amounting to P406.3 million, P404.9 million and P377.6 million in 2017, 2016 and 2015, respectively, are presented as part of Rentals under Other Operating Income – net account in the consolidated statements of comprehensive income (see Note 18). Direct costs incurred, generally pertaining to depreciation charges, amounting to P62.7 million each in 2017, 2016 and 2015, are presented as part of Depreciation under General and Administrative Expenses account in the consolidated statements of comprehensive income (see Note 17).
The net carrying amounts of investment property as at the beginning and end of 2017 and 2016 are shown below.
December 31, December 31, January 1, 2017 2016 2016
Cost P 1,892,772,408 P 1,892,772,408 P 1,892,772,408 Accumulated depreciation ( 472,884,945) ( 410,139,438) ( 347,393,931 ) P 1,419,887,463 P 1,482,632,970 P 1,545,378,477
A reconciliation of the carrying amounts at the beginning and end of 2017 and 2016 of investment property is shown below.
Note 2017 2016 Balance at January 1, net of accumulated depreciation P 1,482,632,970 P 1,545,378,477 Depreciation charges for the year 17 ( 62,745,507 ) ( 62,745,507 )
Balance at December 31, net of accumulated depreciation P 1,419,887,463 P 1,482,632,970

- 42 -
In the latest appraisal report, the Company’s investment property, which is part of the Newport City Project (Site B), has an aggregate fair market value of P16.1 billion. Fair value is determined using the income capitalization approach, which uses a financial modeling technique based on explicit assumptions regarding the prospective cash flows from the properties. Under this method, an appropriate discount rate is applied to establish an indication of the present value of the income stream associated with the properties.
Other information about the fair value measurement and disclosures related to the investment property are presented in Note 27.4.
13. OTHER NON-CURRENT ASSETS
The composition of this account is shown below. Notes 2017 2016
Leasehold rights – net 24.2 P 833,333,333 P 883,333,333 Accumulated jackpot seed money 25.2 169,300,000 170,676,888 Refundable deposits 122,489,847 87,359,262 Miscellaneous 22.4 461,879,723 480,652,889
P1,587,002,903 P1,622,022,372
In 2014, the Group entered into a lease agreement with NPF covering certain parcels of land located at the Manila Bay Reclamation Area in Parañaque City for a period of 25 years, renewable for another 25 years under the terms mutually acceptable to the parties (see Note 2.8). Upon effectivity of the lease agreement, the Group has paid NPF P1.0 billion (presented as Leasehold rights) covering the first 20 years of the lease (see Note 24.2). The amount of amortization charges amounted to P50.0 million both in 2017 and 2016, and P66.7 million in 2015, which is presented as part of Rentals under General and Administrative Expenses account in the consolidated statements of comprehensive income (see Note 17). No impairment loss was recognized in 2017 and 2016 as the carrying amount of the leasehold rights approximates its fair value.
Accumulated jackpot seed money and refundable deposits are perpetual in nature. Hence, the carrying amounts of these financial assets are reasonable estimation of their respective fair values.

- 43 -
Miscellaneous non-current assets includes original advance payment made by the Group to a related party under common ownership for the purchase of certain condominium units and parking lots to be used by in-house entertainers and for employee housing program. In 2017 and 2016, certain employees availed of the condominium units. As of December 31, 2017 and 2016, the cost of the remaining units amounted to P365.6 million and P405.7 million, respectively. No transfer of title has been made yet as of said date (see Note 22.4). The remainder of miscellaneous non-current assets pertains to certain non-financial deposits or advances to suppliers which will be realized beyond 12 months from the end of the reporting periods.
14. INTEREST-BEARING LOANS AND BORROWINGS
The short-term and long-term interest-bearing loans and borrowings pertain to bank loans from domestic banks. The composition of the Group’s outstanding bank loans as of December 31, 2017 and 2016 is shown below.
Principal Interest Rate Nature Term
2017:
P13.0 billion Fixed at 4.0% Unsecured 60 days P 2.0 billion Fixed at 3.8% Unsecured 180 days P 1.5 billion Fixed at 4.0% Unsecured 90 days P 1.0 billion Fixed at 4.0% Unsecured 180 days P 1.0 billion Fixed at 4.0% Unsecured 90 days P 1.0 billion Fixed at 3.9% Unsecured 360 days
P7.0 billion Floating rate subject to repricing Unsecured 7 years P5.0 billion Floating rate subject to repricing plus a spread of 1.15% Unsecured 7 years
2016:
P3.5 billion Fixed at 3.6% Unsecured 180 days P2.0 billion Fixed at 4.0% Unsecured 360 days P1.5 billion Fixed at 3.7% Unsecured 180 days
In 2016, a local bank approved a credit line which grants the Group to borrow up to P10.0 billion. As of December 31, 2016, the Group has drawn P2.0 billion from this facility. Further, the Group also obtained two additional short-term loans from another local bank with a total principal amounting to P5.0 billion in 2016. These loans were settled in 2017. In 2017, the P10.0 billion credit line was increased to P21.0 billion. As of December 31, 2017, the outstanding drawdowns from this credit line amounted to P13.0 billion. Also in 2016, the Group entered into another credit line agreement with a maximum loanable amount of P7.0 billion from another local bank. There were no drawdowns made in 2016. The Group fully utilized the said credit line in 2017 and is outstanding as of December 31, 2017.

- 44 -
In 2017, the Group entered into various additional credit line agreements with a total maximum loanable amount of P11.5 billion from other local banks. As of December 31, 2017, drawdowns totaling to P8.0 billion were made related to these facilities. Further, the Group also obtained short-term loans from local banks with total principal amounting to P3.5 billion. The outstanding loans as of December 31, 2017 and 2016 are presented as Interest-bearing Loans and Borrowings in the consolidated statements of financial position.
There are no assets used and/or required as collaterals as of December 31, 2017 and 2016 for the Group’s interest-bearing loans and borrowings.
As of December 31, 2017, certain long-term loans require the Group to maintain certain financial ratios such as debt service coverage, debt-to-equity and current ratio. The Group has complied with the loan covenants as of December 31, 2017 and 2016. Certain portion of finance costs attributable to these loans amounting to P153.8 million and P130.8 million in 2017 and 2016, respectively, are presented as part of Interest expense under the Finance Costs account in the statements of comprehensive income (see Note 19). All finance costs incurred in 2015 attributable to loans were capitalized. The portion of finance costs for both 2017 and 2016 that were capitalized is included as part of additions to Construction in progress under Property and Equipment account in the statements of financial position (see Note 11). Unpaid interests as at December 31, 2017 and 2016 are presented as part of Accrued expenses under the Trade and Other Payables account in the consolidated statements of financial position (see Note 15).
The changes in the Interest-bearing Loans and Borrowings account in 2017 are shown below.
Balance at beginning of year P 7,000,000,000 Cash flows from financing activities: Additional borrowing 33,947,500,000 Repayment of borrowings ( 9,500,000,000 ) Non-cash financing activities – Amortization of debt issuance costs ( 4,352,668 ) Balance at end of year P 31,443,147,332
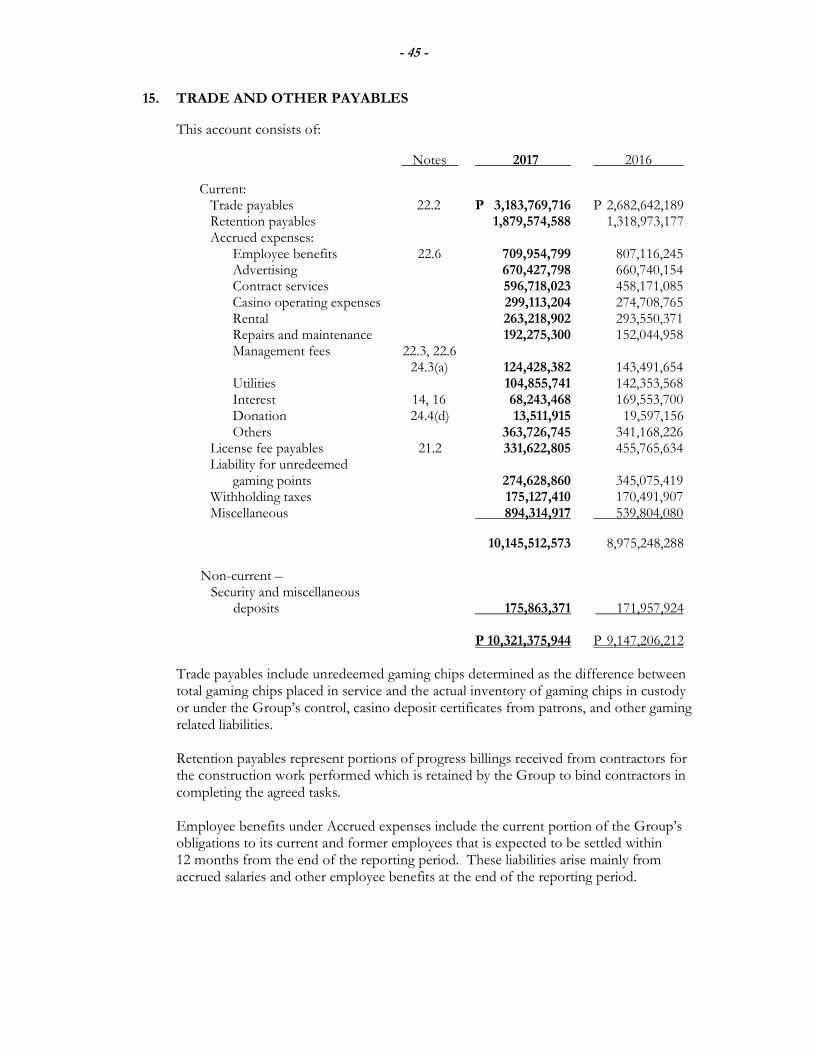
- 45 -
15. TRADE AND OTHER PAYABLES
This account consists of:
Notes 2017 2016
Current: Trade payables 22.2 P 3,183,769,716 P 2,682,642,189 Retention payables 1,879,574,588 1,318,973,177 Accrued expenses: Employee benefits 22.6 709,954,799 807,116,245 Advertising 670,427,798 660,740,154 Contract services 596,718,023 458,171,085 Casino operating expenses 299,113,204 274,708,765 Rental 263,218,902 293,550,371 Repairs and maintenance 192,275,300 152,044,958 Management fees 22.3, 22.6 24.3(a) 124,428,382 143,491,654 Utilities 104,855,741 142,353,568 Interest 14, 16 68,243,468 169,553,700 Donation 24.4(d) 13,511,915 19,597,156 Others 363,726,745 341,168,226 License fee payables 21.2 331,622,805 455,765,634 Liability for unredeemed gaming points 274,628,860 345,075,419 Withholding taxes 175,127,410 170,491,907 Miscellaneous 894,314,917 539,804,080
10,145,512,573 8,975,248,288 Non-current – Security and miscellaneous deposits 175,863,371 171,957,924 P 10,321,375,944 P 9,147,206,212
Trade payables include unredeemed gaming chips determined as the difference between total gaming chips placed in service and the actual inventory of gaming chips in custody or under the Group’s control, casino deposit certificates from patrons, and other gaming related liabilities.
Retention payables represent portions of progress billings received from contractors for the construction work performed which is retained by the Group to bind contractors in completing the agreed tasks. Employee benefits under Accrued expenses include the current portion of the Group’s obligations to its current and former employees that is expected to be settled within 12 months from the end of the reporting period. These liabilities arise mainly from accrued salaries and other employee benefits at the end of the reporting period.

- 46 -
Other accrued expenses include accruals for local and overseas travel, training and recruitment, dues and subscription, flight operations and other incidental casino and hotel operating expenses. The liability for unredeemed gaming points represents the estimated costs of unredeemed casino gaming points issued, which are redeemable for complimentary goods or services of the Group. Security and miscellaneous deposits are perpetual in nature. Hence, the carrying amounts of these financial liabilities are reasonable estimation of their respective fair values. Miscellaneous payables include a certain sum of money held-in-trust by the Group in favor of the insurance company which will eventually form part of the total recoveries once the claim process is finalized (see Note 24.6). The remainder of the account includes other non-trade obligations under the ordinary course of business, and government-related liabilities.
16. NOTES PAYABLE On November 3, 2010, the Group issued U.S. $300.0 million notes (equivalent to P14.9 billion as at December 31, 2016), with nominal interest of 6.9% per annum, payable semi-annually in arrears on May 3 and November 3 of each year commencing on May 3, 2011. The notes bear an annual effective interest rate of 7.2%. The note issuance was approved by the Company’s BOD on August 29, 2010. The notes matured in 2017. Subject to certain exceptions, the Group had an option to redeem the notes as follows:
(a) in full at a price of 100.0% of the principal if certain changes in laws, treaties, regulations or rulings affecting taxes would require the Group to pay certain additional amount; or,
(b) at any time prior to November 3, 2014, up to 35.0% of the principal amount at a price of 106.9% of the principal amount with the net cash proceeds of an equity offering.
Also, the Group was required to make an offer to purchase the notes at a price of 101.0% of the principal amount following a change in control, an example of which is the sale or other disposition of all or substantially all of the properties or assets of the Group to any person or entity.

- 47 -
The notes, among other things, restricted the Group’s ability to:
(a) incur or guarantee additional indebtedness; (b) create or incur certain liens; (c) make certain payments, including dividends or other distributions, with respect
to the shares of the Group or its subsidiaries; (d) prepay or redeem subordinated debt or equity; (e) make certain investments and capital expenditures; (f) create encumbrances or restrictions on the payment of dividends or other
distributions, loans or advances to and on the transfer of assets to the Company or its subsidiaries;
(g) sell, lease or transfer certain assets, including shares of stock of subsidiaries; (h) engage in certain transactions with affiliates; (i) enter into unrelated businesses or engage in prohibited activities; or, (j) consolidate or merge with other entities.
All of these limitations were subject to significant exceptions and qualifications as defined in the terms and conditions of the notes, which were listed on the Singapore Exchange Securities Trading Limited. There were no violations of these limitations until the notes were settled on November 3, 2017, as the transactions during the intervening periods were under the ordinary course of business.
The net proceeds amounting to U.S. $292.3 million (P14.6 billion) from the issuance of the notes, after deducting direct issue costs, such as underwriting fees and commissions, documentary stamp tax and other expenses associated with the issue of the notes, were used to finance capital and project expenditures, to refinance certain existing indebtedness, and for general corporate purposes. Interest expense on the notes payable, including amortization of capitalized transaction costs, amounted to P497.7 million, P603.0 million, and P189.0 million in 2017, 2016 and 2015, respectively, and are presented as part of Interest expense under Finance Costs account in the consolidated statements of comprehensive income (see Note 19). Outstanding interest payables on the notes payable as at December 31, 2016 is presented as part of Accrued interest under Trade and Other Payables account in the 2016 consolidated statement of financial position (see Note 15). The portion of finance costs that was capitalized is included as part of additions to Construction in progress under Property and Equipment account in the consolidated statements of financial position (see Note 11). On January 18, 2011, the Company’s BOD authorized the Company to enter into a liability swap agreement involving floating-rate coupons with a certain bank at a notional amount of U.S. $250.0 million of the notes. In accordance with the interest rate swap agreement, the Company receives a certain amount of fixed semi-annual interest and the bank receives floating semi-annual interest based on an index cumulative performance specifically defined by the bank.

- 48 -
Based on mark-to-market valuation report, the Group recognized the losses on change in value of the related derivative financial liability amounting to P27.2 million, P31.8 million, and P30.2 million in 2017, 2016 and 2015, respectively, and presented as Loss on interest rate swap under Finance Costs account in the consolidated statements of comprehensive income (see Note 19). Total payments amounted to P360.5 million in 2017 and P339.5 million in 2016. The related liability is presented as Derivative Liability in the 2016 consolidated statement of financial position. The liability was settled on November 3, 2017, simultaneous to the settlement of the related notes payable. Presented below is the reconciliation of liabilities arising from the notes payable and derivative liability in 2017, which includes both cash and non-cash changes.
Derivative
Notes Payable Liability Total
Balance at beginning of year P 14,879,062,940 P 327,939,175 P15,207,002,115
Cash flows from financing activities –
Repayment of borrowings ( 15,539,700,000 ) ( 360,478,688 ) ( 15,900,178,688 )
Non-cash financing activities:
Foreign exchange difference 595,063,462 5,303,876 600,367,338
Amortization of discount 65,573,598 - 65,573,598
Loss on interest rate swap - 27,235,637 27,235,637
Balance at end of year P - P - P -

- 49 -
17. OPERATING EXPENSES BY NATURE The details of operating expenses by nature in 2017 are shown below.
General and
Administrative
Notes Direct Costs Expenses Total
Salaries, wages and
employee benefits 20.1, 22.6 P 2,987,984,678 P 1,180,381,422 P 4,168,366,100
Gaming license fees 21.2 3,862,964,722 - 3,862,964,722
General marketing - 2,548,493,226 2,548,493,226
Depreciation 11, 12 426,874,075 1,505,072,006 1,931,946,081
Food and beverage 800,158,477 - 800,158,477
Utilities and communication - 616,458,863 616,458,863
Casino operating expenses 603,009,206 - 603,009,206
Repairs and maintenance - 404,662,508 404,662,508
Management fees 22.3, 22.6
24.3(a) - 341,473,873 341,473,873
Donations and contributions 24.4(d) - 314,495,230 314,495,230
Rentals 13 50,029,535 231,523,324 281,552,859
Taxes and licenses - 249,534,326 249,534,326
Supplies 174,216,819 73,086,334 247,303,153
Transportation and travel - 217,842,143 217,842,143
Security - 141,368,909 141,368,909
Commission - 110,141,066 110,141,066
Flight operations 108,444,291 - 108,444,291
Professional services - 103,791,883 103,791,883
Dues and subscriptions - 62,067,073 62,067,073
Entertainment, amusement
and recreation 36,206,352 57,111 36,263,463
Miscellaneous 43,323,748 538,867,029 582,190,777
P 9,093,211,903 P 8,639,316,326 P 17,732,528,229
Miscellaneous under General and Administrative Expenses account in 2017, 2016 and 2015 include, among others, penalties, freight and handling charges, representation, insurance, credit and collection charges, and other incidental administrative expenses.

- 50 -
The details of operating expenses by nature in 2016 are shown below. General and
Administrative
Notes Direct Costs Expenses Total
Gaming license fees 21.2 P 5,212,622,104 P - P 5,212,622,104
General marketing - 4,152,920,994 4,152,920,994
Salaries, wages and
employee benefits 20.1, 22.6 2,961,431,971 1,121,737,146 4,083,169,117
Depreciation 11, 12 429,242,590 1,213,863,613 1,643,106,203
Food and beverage 788,222,734 - 788,222,734
Utilities and communication - 653,088,623 653,088,623
Casino operating expenses 573,649,310 - 573,649,310
Management fees 22.3, 22.6
24.3(a) - 476,543,912 476,543,912
Repairs and maintenance - 369,696,208 369,696,208
Flight operations 338,691,065 - 338,691,065
Rentals 13 58,488,243 233,078,962 291,567,205
Supplies 190,503,464 65,929,072 256,432,536
Donations and contributions 24.4(d) - 211,545,884 211,545,884
Transportation and travel - 175,701,236 175,701,236
Commission - 136,077,495 136,077,495
Security - 112,763,735 112,763,735
Professional services - 95,817,514 95,817,514
Taxes and licenses - 76,830,026 76,830,026
Dues and subscriptions - 67,591,966 67,591,966
Entertainment, amusement
and recreation 30,287,816 - 30,287,816
Miscellaneous 32,991,326 537,885,000 570,876,326
P 10,616,130,623 P 9,701,071,386 P 20,317,202,009

- 51 -
The details of operating expenses by nature in 2015 are shown below. General and
Administrative
Notes Direct Costs Expenses Total
Gaming license fees 21.2 P 5,308,814,127 P - P 5,308,814,127
General marketing 22.2 - 4,174,663,437 4,174,663,437
Salaries, wages and
employee benefits 20.1, 22.6 2,955,466,422 1,102,370,151 4,057,836,573
Depreciation 11, 12 417,944,105 984,930,457 1,402,874,562
Food and beverage 831,307,367 - 831,307,367
Utilities and communication - 642,356,485 642,356,485
Management fees 22.3, 22.6
24.3(a) - 471,697,945 471,697,945
Flight operations 373,707,628 - 373,707,628
Rentals 13 62,343,642 296,743,825 359,087,467
Repairs and maintenance - 296,391,600 296,391,600
Supplies 178,174,498 96,531,493 274,705,991
Casino operating expenses 268,339,360 - 268,339,360
Donations and contributions 24.4(d) - 238,348,783 238,348,783
Transportation and travel - 170,483,530 170,483,530
Security - 118,697,890 118,697,890
Commission - 104,416,662 104,416,662
Professional services - 80,552,527 80,552,527
Dues and subscriptions - 68,609,299 68,609,299
Entertainment, amusement
and recreation 63,601,073 - 63,601,073
Taxes and licenses - 58,239,836 58,239,836
Miscellaneous 30,967,823 447,429,320 478,397,143
P 10,490,666,045 P 9,352,463,240 P 19,843,129,285

- 52 -
18. OTHER OPERATING INCOME – Net
The breakdown of this account is as follows:
Notes 2017 2016 2015
Rentals 12, 22.7,
24.1 P 618,557,064 P 483,047,348 P 434,931,645
Bingo 92,852,496 86,101,547 76,341,634
Cinema 84,406,794 112,427,978 124,802,628
Productions shows 74,112,437 221,916,652 119,263,281
Parking 63,229,616 175,109,219 172,693,645
Service fees 56,178,929 20,697,500 -
Tournament income 42,195,381 - -
Commissions 31,343,957 37,907,672 32,214,291
Laundry 7,731,433 9,086,252 11,367,825
Gain (loss) on sale of property
and equipment –net 11 4,179,829 ( 2,933,560 ) -
Miscellaneous 92,210,575 72,195,233 62,781,175
P 1,166,998,511 P 1,215,555,841 P 1,034,396,124
Income from tournament refers to ticket sales from a derby event hosted by the Group in 2017. Miscellaneous income includes revenues from limousine, dormitory, spa, and other service charges.
19. OTHER INCOME (CHARGES) The details of this account are as follows:
Notes 2017 2016 2015
Finance costs:
Interest expense 14, 16, 20.2 P 659,083,204 P 740,067,690 P 194,532,794
Foreign currency losses – net 154,088,185 683,503,084 545,757,993
Loss on interest rate swap 16, 25.1(c) 27,235,637 31,769,386 30,186,511
Bank charges 4,050,513 3,278,078 4,894,266
P 844,457,539 P 1,458,618,238 P 775,371,564
Finance income –
Interest income 5, 8 P 168,416,307 P 86,434,568 P 116,287,960

- 53 -
20. EMPLOYEE BENEFITS
20.1 Salaries and Employee Benefits Expense
Details of salaries and employee benefits are presented below (see Notes 17 and 22.6).
Note 2017 2016 2015
Short-term employee benefits P 3,974,125,956 P 4,058,648,993 P 4,031,288,809
Post-employment defined
benefits 20.2 194,240,144 24,520,124 26,547,764
P 4,168,366,100 P 4,083,169,117 P 4,057,836,573
20.2 Post-employment Defined Benefit
(a) Characteristics of the Defined Benefit Plan
In 2017, the Group established a partially-funded, non-contributory multi-employer post-employment benefit plan which is being administered by a trustee bank that is legally separated from the Group. The trustee bank manages the fund in coordination with the Group’s Remuneration and Compensation Committee, who acts in the best interest of the plan assets and is responsible for setting the investment policies. The post-employment plan covers all regular full-time employees.
The normal retirement age is 60 with a minimum of 5 years of credited service. The plan also provides for an early retirement at age 50 with a minimum of 10 years credited service subject to the approval of the Company’s Retirement Committee. The post-employment benefit plan provides benefits ranging from 85% to 200% of the plan salary for every year of credited service.
(b) Explanation of Amounts Presented in the Financial Statements
Actuarial valuations are made periodically to update the retirement benefit costs. All amounts presented below and in the succeeding page are based on the actuarial valuation reports obtained from an independent actuary in 2017, 2016 and 2015. The amounts of retirement benefit obligation recognized in the consolidated statements of financial position are determined as follows:
2017 2016
Present value of the obligation P 370,312,589 P 162,480,247 Fair value of plan assets ( 42,247,362) -
P 328,065,227 P 162,480,247

- 54 -
The movements in the present value of the post-employment defined benefit obligation recognized in the books are as follows:
2017 2016 Balance at beginning of year P 162,480,247 P 128,463,198 Past service cost 141,787,489 - Current service cost 52,452,655 24,520,124 Interest expense 8,762,357 6,281,850 Benefits paid ( 1,496,761 ) ( 3,651,360 ) Remeasurements – Actuarial losses (gains) arising from: Changes in financial assumptions ( 13,650,840) ( 9,502,191 ) Changes in demographic assumptions 12,763,199 ( 9,580,070 ) Experience adjustments 7,214,243 25,948,696 Balance at end of year P 370,312,589 P 162,480,247
The movements in the fair value of plan assets in 2017 are presented below. Contributions to the plan P 42,160,554 Interest income 1,134,119
Return on plan assets (excluding amounts included in net interest) ( 1,047,311 )
Balance at end of year P 42,247,362
The composition of the fair value of plan assets at the end of 2017 by category and risk characteristics is shown below.
Cash P 21,890 Treasury bills 37,882,316
Unit investment trust fund (UITF) 4,343,156 P 42,247,362
The fair values of the above instruments are determined based on quoted market prices in active markets (classified as Level 1 of the fair value hierarchy). The plan assets earned a return of P1.1 million in 2017. Plan assets do not comprise any of the Group’s own financial instruments or any of its assets occupied and/or used in its operations.

- 55 -
The components of amounts recognized in profit or loss and other comprehensive income in respect of the retirement benefit obligation are as follows:
Notes 2017 2016 2015
Reported in profit and loss:
Past service cost 20.1 P 141,787,489 P - P -
Current service cost 20.1 52,452,655 24,520,124 26,547,764
Net interest expense 19 7,628,238 6,281,850 5,535,172
P 201,868,382 P 30,801,974 P 32,082,936
Reported in other comprehensive loss (income) –
Actuarial losses (gains) arising from:
Changes in financial assumptions (P 13,650,840) (P 9,502,191 ) ( P 5,370,054)
Changes in demographic
assumptions 12,763,199 ( 9,580,070 ) ( 21,156,890)
Experience adjustments 7,214,243 25,948,696 4,580,618
Return on plan assets (excluding
amounts included in net interest
expense) 1,047,311 - -
P 7,373,913 P 6,866,435 ( P 21,946,326 )
In 2017, the Group incurred past service cost amounting to P141.8 million. This was a result of the establishment of the Group’s formal retirement plan, which grants higher post-employment benefits ranging from 85% to 200% of plan salary to qualified employees for every year of credited services [see Note 20.2(a)]. In previous years, the Group only accrues for retirement benefit obligation equivalent to the minimum requirements of Republic Act 7641, The Retirement Pay Law. The amounts of retirement benefit expense recognized in profit or loss are presented as part of Salaries, wages and employee benefits under the General and Administrative Expenses (for current and past service cost) and the Finance Costs (for interest expense) accounts in the consolidated statements of comprehensive income (see Notes 17 and 19).
The amounts recognized in other comprehensive income were included within item that will not be reclassified subsequently to profit or loss. In determining the amounts of the retirement benefit obligation, the following actuarial assumptions were used:
2017 2016 2015
Discount rate 5.70% 5.38% 4.89% Salary growth rate 4.00% 4.00% 4.00%

- 56 -
Assumptions regarding future mortality are based on published statistics and mortality tables. The average remaining working life of an individual retiring at the age of 60 is 25-31 years for males and 25-30 years for females. These assumptions were developed by management with the assistance of an independent actuary. Discount factors are determined close to the end of each reporting period by reference to the interest rates of zero coupon government bonds with terms to maturity approximating to the terms of the retirement benefit obligation. Other assumptions are based on current actuarial benchmarks and management’s historical experience.
(c) Risks Associated with the Retirement Benefit Obligation
The Company is exposed to actuarial risks such as investment risk, interest rate risk, longevity risk, salary risk and inflation risk.
(i) Investment and Interest Rate Risks
The present value of the defined benefit obligation is calculated using a discount rate determined by reference to market yields of government bonds. Generally, a decrease in the interest rate of a reference government bonds will increase the retirement benefit obligation. Currently, the plan has relatively balanced investments in cash, treasury bills, and UITF. Due to the long-term nature of the plan obligation, a level of continuing investments is an appropriate element of the Company’s long-term strategy to manage the plan efficiently.
(ii) Longevity and Salary Risks
The present value of the defined benefit obligation is calculated by reference to the best estimate of the mortality of the participants during their employment, and to their future salaries. Consequently, increases in the life expectancy and salary of the participants will result in an increase in the retirement benefit obligation.
(iii) Inflation Risk
A significant portion of the defined benefit obligation is linked to inflation. The increase in inflation will increase the Group’s liability.

- 57 -
(d) Other Information
The information on the sensitivity analysis for certain significant actuarial assumptions and the timing and uncertainty of future cash flows related to the retirement benefit obligation are described below and in the succeeding page.
(i) Sensitivity Analysis
The following table summarizes the effects of changes in the significant actuarial assumptions used in the determination of the retirement benefit obligation as of December 31, 2017 and 2016:
Impact on Retirement Benefit Obligation Change in Increase in Decrease in
Assumption Assumption Assumption December 31, 2017
Discount rate +/- 100 basis points (P 44,921,755) P 39,625,169 Salary growth rate +/- 100 basis points 41,307,055 ( 36,499,201 )
December 31, 2016
Discount rate +/- 100 basis points (P 19,310,257 ) P 16,791,021 Salary growth rate +/- 100 basis points 17,663,552 ( 15,749,689)
The sensitivity analysis is based on a change in an assumption while holding all other assumptions constant. This analysis may not be representative of the actual change in the retirement benefit obligation as it is unlikely that the change in assumptions would occur in isolation of one another as some of the assumptions may be correlated. Furthermore, in presenting the sensitivity analysis, the present value of the retirement benefit obligation has been calculated using the projected unit credit method at the end of the reporting period, which is the same as that applied in calculating the retirement benefit obligation recognized in the consolidated statements of financial position. The methods and types of assumptions used in preparing the sensitivity analysis did not change compared to the previous years. (ii) Asset-liability Matching Strategies
The Group has no specific matching strategy between the plan assets and the plan obligation.
(iii) Funding Arrangements and Expected Contributions The plan is currently underfunded by P328.1 million based on the latest actuarial valuation. While there is no minimum funding requirement in the country, the size of the underfunding pay pose a cash flow risk in about five to ten years’ time when the current fair value of plan assets is not enough to cover the expected retirement benefit payments.
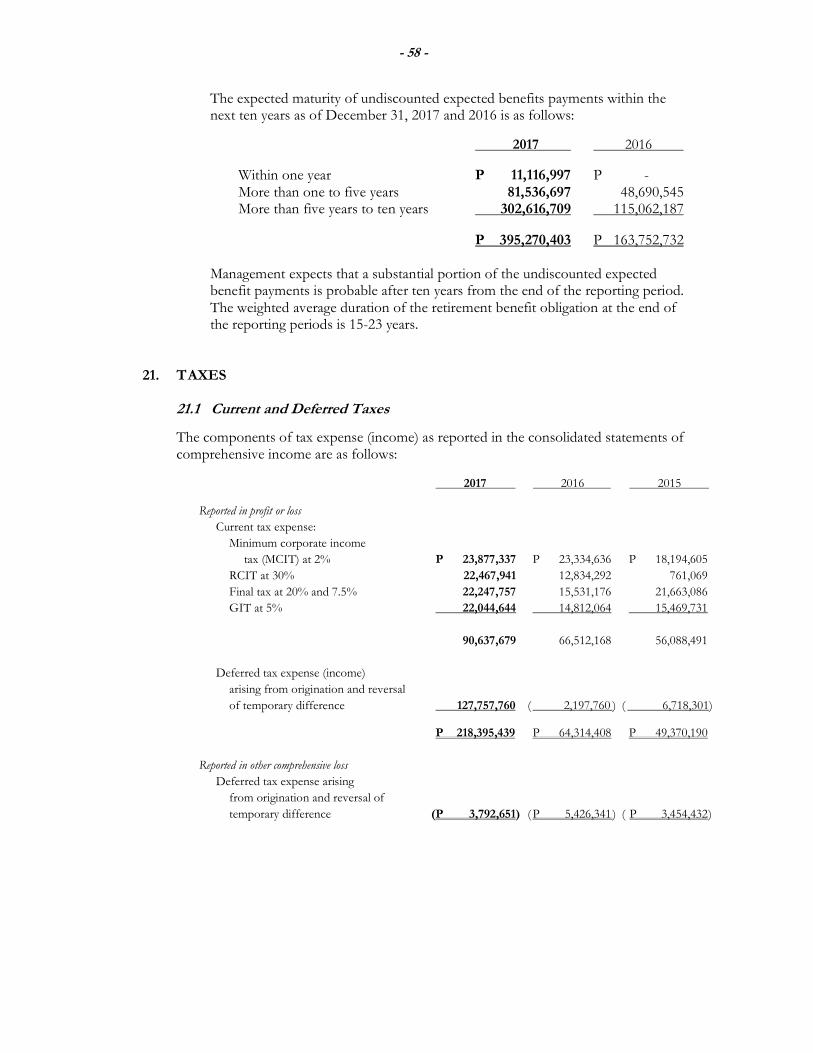
- 58 -
The expected maturity of undiscounted expected benefits payments within the next ten years as of December 31, 2017 and 2016 is as follows:
2017 2016
Within one year P 11,116,997 P - More than one to five years 81,536,697 48,690,545 More than five years to ten years 302,616,709 115,062,187
P 395,270,403 P 163,752,732
Management expects that a substantial portion of the undiscounted expected benefit payments is probable after ten years from the end of the reporting period. The weighted average duration of the retirement benefit obligation at the end of the reporting periods is 15-23 years.
21. T AXES 21.1 Current and Deferred Taxes
The components of tax expense (income) as reported in the consolidated statements of comprehensive income are as follows:
2017 2016 2015
Reported in profit or loss
Current tax expense:
Minimum corporate income
tax (MCIT) at 2% P 23,877,337 P 23,334,636 P 18,194,605
RCIT at 30% 22,467,941 12,834,292 761,069
Final tax at 20% and 7.5% 22,247,757 15,531,176 21,663,086
GIT at 5% 22,044,644 14,812,064 15,469,731
90,637,679 66,512,168 56,088,491
Deferred tax expense (income)
arising from origination and reversal
of temporary difference 127,757,760 ( 2,197,760 ) ( 6,718,301)
P 218,395,439 P 64,314,408 P 49,370,190
Reported in other comprehensive loss
Deferred tax expense arising
from origination and reversal of
temporary difference (P 3,792,651) ( P 5,426,341 ) ( P 3,454,432 )

- 59 -
A reconciliation of tax on pretax profit computed at the applicable statutory rates to tax expense reported in the profit or loss section of the consolidated statements of comprehensive income is as follows:
2017 2016 2015
Tax on pretax profit at 30% P 138,028,020 P 1,038,852,307 P 1,220,093,677
Adjustment for income subjected to
lower tax rates ( 137,447,743 ) ( 83,306,461) ( 90,571,356 )
Tax effects of:
Non-taxable income ( 4,977,213,540 ) ( 6,401,569,989 ) ( 6,357,058,860 )
Non-deductible expenses 4,654,738,430 5,154,531,695 4,977,074,706
Unrecognized deferred tax asset (DTA)
on net operating loss carryover
(NOLCO) 349,039,084 215,421,583 223,497,463
Reversal of previously recognized DTA 145,859,575 - -
Change in unrecognized net DTA on
other temporary differences 25,937,594 116,872,111 58,139,955
Unrecognized DTA on MCIT 23,839,139 23,808,653 18,194,605
Utilization of NOLCO ( 3,844,398 ) ( 295,491 ) -
Application of MCIT ( 540,722 ) - -
P 218,395,439 P 64,314,408 P 49,370,190
In 2017, the Group derecognized the DTA amounting to P145.9 million, which pertains to MCIT paid in 2014, after the lapse of the three-year validity period. Total recognized DTA of the Group amounting to P32.4 million and P164.5 million as of December 31, 2017 and 2016, respectively, is presented as Deferred Tax Assets account in the consolidated statements of financial position.
The Group did not recognize certain DTA on other deductible temporary difference as management has assessed that it may not be able to realize their related tax benefits. As of the end of the reporting periods, the total unrecognized net deferred tax assets relate to the items presented below. 2017 2016 Amount Tax Effect Amount Tax Effect NOLCO P 2,579,127,663 P 773,738,299 P 2,836,228,971 P 850,868,691 Unrealized foreign currency losses (gains) - net ( 18,684,899 ) ( 5,605,470 ) 1,214,517,713 364,355,314 Retirement benefit obligation 200,373,259 60,111,978 - - Contribution to retirement plan 30,848,310 9,254,493 99,684,981 29,905,494 MCIT 62,584,830 62,584,830 53,879,564 53,879,564 Loss in interest rate swap - - 254,275,071 76,282,521 P 2,854,249,163 P 900,084,130 P 4,458,586,300 P1,375,291,584
The details of the Group’s NOLCO are as follows:
Year Expired Remaining Valid Incurred Amount Applied Amount Amount Balance Until 2017 P 1,163,463,615 P - P - P 1,163,463,615 2020 2016 722,033,521 - - 722,033,521 2019 2015 695,611,875 ( 1,981,348) - 693,630,527 2018 2014 1,495,756,691 ( 10,833,310) ( 1,484,923,381) - P 4,076,865,702 (P 12,814,658) (P1,484,923,381) P 2,579,127,663

- 60 -
The Group is subject to MCIT which is computed at 2% of gross income, as defined under the tax regulations or RCIT, whichever is higher. The details of the Group’s MCIT, portion of which has been recognized as deferred tax asset, are as follows:
Year Expired Remaining Valid Incurred Amount Applied Amount Amount Balance Until 2017 P 23,877,337 P - P - P 23,877,337 2020 2016 23,324,558 ( 540,722) - 22,783,836 2019 2015 15,923,657 - - 15,923,657 2018 2014 160,964,941 - ( 160,964,941) - P 224,090,493 (P 540,722) (P 160,964,941) P 62,584,830 The Group opted to claim itemized deductions in computing for its income tax due for the reporting periods.
21.2 Taxation of Casino Operations
Under the Provisional License Agreement with PAGCOR, the Company is subject to 25% and 15% license fees, inclusive of franchise tax and in lieu of all taxes, with reference to the income component of the gross gaming revenues (see Note 2.22). The license fees are directly remitted by the Group to PAGCOR as required under the Provisional License Agreement. In April 2013, the Bureau of Internal Revenue (BIR) issued Revenue Memorandum Circular (RMC) 33-2013 declaring that PAGCOR and its contractees and its licensees are no longer exempt from corporate income tax under the National Internal Revenue Code of 1997, as amended [see Note 24.4(e)]. In August 2016, the Philippine Supreme Court (SC), in Bloomberry Resorts and Hotels, Inc. vs. BIR, (the SC Decision) confirmed that “all contractees and licensees of PAGCOR, upon payment of the 5% franchise tax, shall be exempted from all other taxes, including income tax realized from the operation of casinos.” The SC Decision has been affirmed with finality by SC in a resolution dated November 28, 2016, when it denied the Motion for Reconsideration filed by the BIR. Total license fees recognized amounted to P3.9 billion, P5.2 billion and P5.3 billion in 2017, 2016 and 2015, respectively, and are presented as Gaming license fees as part of Direct Costs account in the consolidated statements of comprehensive income (see Note 17). The outstanding liabilities are presented as License fee payables under the Trade and Other Payables account in the consolidated statements of financial position (see Note 15).
Prior to the SC Decision in 2016, PAGCOR issued Guidelines for a 10% Income Tax Allocation (ITA) measure whereby, effective April 1, 2014, the 25% and 15% license fees were effectively reduced to 15% and 5%, respectively, inasmuch as 10% of the license fees was allocated for income tax on gaming, subject to quarterly and annual true-up mechanisms obliging the licensees to remit to PAGCOR any savings from the excess ITA over the actual tax paid on the gaming revenues. In 2016, the ITA ceased to be effective as a result of the SC Decision.

- 61 -
21.3 Registration with the Philippine Economic Zone Authority (PEZA)
The Company was registered with the PEZA on December 16, 2008 as a Tourism Economic Zone Enterprise as owner of 172 rooms in Maxims and 342 rooms in Marriott in the Newport City Cybertourism Zone. In 2012, Remington Hotel and the Newport Entertainment and Commercial Centre were also registered with the PEZA. As a PEZA-registered enterprise, the Group is entitled to certain tax incentives which include: (a) ITH for four years on income solely derived from servicing foreign tourists. Upon
expiry of the ITH period, the Group shall pay the 5% GIT, in lieu of all national and local taxes, provided that the Group shall have the option to forego the ITH incentive entitlement and immediately avail of the 5% GIT incentive upon the start of commercial operations subject to the Group’s submission to PEZA of its Board Resolution on said waiver of the ITH incentive; and,
(b) Tax and duty-free importation of capital requirement for use in the technical viability and operation of the registered activity of the Group.
The Group has completed the construction of MWW which added 228 rooms to the existing hotel operations in 2016, and MGB, a 4,000-seater convention center in 2015 (see Note 11). In 2016, the Group has obtained the supplemental PEZA accreditation covering these additional facilities.
ITH for all hotels have expired (see Note 2.22). Accordingly, the Group paid the GIT on income from servicing foreign tourists, which is presented as part of current tax expense under Tax Expense account in the consolidated statements of comprehensive income (see Note 21.1). In addition, DHRI and LSHRI were also registered with PEZA in 2014 and 2013, respectively, as Tourism Economic Zone Enterprise at Newport City, Cybertourism Zone. As PEZA-registered entities, DHRI and LSHRI are qualified enterprises for certain incentives of benefits granted by the PEZA Board in accordance with the regulations of the BIR. As at December 31, 2017, both DHRI and LSHRI are still in the process of construction and development of its facilities for future hotel operations.

- 62 -
22. RELATED PARTY TRANSACTIONS
The Group’s related parties with transactions and balances include its stockholder, companies under common ownership, management or control, associate, the Group’s key management personnel and others as described below and in the succeeding pages.
22.1 Summary of Related Party Transactions
The summary of the Group’s transactions and outstanding balances with its related parties is as follows:
Related Party Amount of Transaction Outstanding Balance Category Notes 2017 2016 2015 2017 2016 Related Parties Under
Common Ownership: Repayment (obtaining) of cash advances, net 22.5 (P 72,834,683 ) P 171,429,188 (P 99,203,333 ) (P 94,204,942) (P 167,039,625) Management fees 22.3 107,224,572 95,278,644 31,996,732 ( 104,067,682) ( 72,246,185) Granting of cash advances, net of collections 22.5 ( 596,552 ) 434,202 13,246,557 51,020,291 51,616,843 Prepayment of condominium units 22.4 - - - 365,602,375 405,690,370 Lease of office spaces 22.7 4,299,171 3,601,341 15,910,671 729,122 365,665 Associate –
Granting (obtaining) of cash advances, net 22.5 ( 380,453,359 ) 3,327,822,492 ( 970,156,448 ) 303,217,246 683,670,605
Stockholder: Casino transactions 22.6 278,977,739 343,690,659 2,878,377,127 6,441,882 ( 16,989,712 ) Management fees 22.6 201,402,916 379,568,801 376,529,493 ( 12,806,175) ( 65,125,989 ) Incidental charges 22.6 - - 155,568,762 - -
Officers and Employees: Key management compensation 22.6 187,721,574 196,075,073 196,043,825 ( 16,054,612) ( 5,441,281 ) Granting (collection) of cash advances, net 22.5 ( 4,348,328 ) ( 36,144,018) 8,708,020 69,692,372 70,058,193
Other Related Parties Under Common Management or Control : Granting of cash advances 22.5 1,012,763 ( 18,942,953) ( 293,128) 4,050,682 3,079,519 Donations 24.4(d) 133,250,752 208,587,823 232,932,530 ( 13,511,915) ( 19,597,156 )
No impairment loss is recognized for the reporting periods on the outstanding balances
from related parties in relation to these transactions.
22.2 Joint Co-operation Agreement with GHL
In 2014, the Group and GHL executed a joint co-operation agreement for certain services of GHL to the Group whereby the consideration is a certain percentage of net turnover from casino operations. In 2015, the Group and GHL discontinued the joint co-operation agreement. Incidental charges arising from this transaction are presented as part of General marketing under the General and Administrative Expenses account in the 2015 consolidated statement of comprehensive income (see Note 17). There are no outstanding balances arising from this agreement as of December 31, 2017 and 2016.

- 63 -
The Company also recognized outstanding payables (receivables) to (from) GHL representing show money received by the Company (GHL) from foreign patrons which the counterparty will later remit to the other. The outstanding balances, which are unsecured, noninterest-bearing and payable in cash upon demand, are presented as part of Trade receivables under Trade and Other Receivables account in the 2017 consolidated statement of financial position (see Note 6) and Trade payables under Trade and Other Payables account in the 2016 consolidated statement of financial position (see Note 15).
22.3 Management Fees to Related Parties
On July 19, 2010, the Group entered into a management agreement with a related party under common ownership, whereby the latter shall provide management services to the Group, such as the handling of billings to and collections from tenants, and overall administration of the Group’s leasing operations. As a consideration for such services, the Group shall pay the related party based on certain rates of collection, plus commission. The consideration for the services rendered by the related party is presented as part of Management fees under General and Administrative Expenses account in the consolidated statements of comprehensive income (see Note 17). In 2017 and 2016, the Group obtained certain management services from another related party under common ownership for the Group’s ongoing construction and development activities. The consideration for the services rendered by the related party is capitalized as part of Construction in progress under Property and Equipment – net account in the consolidated statements of financial position (see Note 11). The outstanding balances, which are unsecured, noninterest-bearing and payable in cash upon demand, of management fees are presented as part of Accrued expenses under Trade and Other Payables account in the consolidated statements of financial position (see Note 15).
22.4 Advance Payment to a Related Party
The Group entered into a contract to buy and sell with a related party under common ownership, whereby the Group shall purchase condominium units and parking lots from the latter to be used by in-house entertainers and for employee housing program. Total consideration that was originally paid by the Group in prior years amounted to P437.9 million, which is presented as part of Miscellaneous under Other Non-Current Assets account in the consolidated statements of financial position (see Note 13). In 2017 and 2016, certain employees availed of the condominium units. As of December 31, 2017 and 2016, the cost of the remaining units amounted to P365.6 million and P405.7 million, respectively. No transfer of title has been made yet as of said date. The outstanding receivables, which are secured to the extent of the related condominium units, noninterest-bearing and payable in cash, arising from the availment of certain employees amounting to P83.9 million and P38.6 million as of December 31, 2017 and 2016, respectively, are presented as part of Others under Trade and Other Receivables account in the consolidated statements of financial position (see Note 6). Management assessed that the current and non-current classification of the outstanding receivables and the related impact of discounting is not significant to the Group’s consolidated financial statements.

- 64 -
22.5 Advances to and from Related Parties
In the normal course of business, the Group obtains from and grants cash advances to its related parties, including those under common ownership, and officers and employees which are subject for liquidation or salary deduction, for working capital requirements and other purposes. The details of Advances to Related Parties account as at December 31 are shown below.
Note 2017 2016
Associate 10 P 303,217,246 P 683,670,605 Officers and employees 69,692,372 70,058,193 Related parties under common ownership of stockholders 51,020,291 51,616,843 Other related parties under common ownership, management or control 4,050,682 3,079,519 P 427,980,591 P 808,425,160
The changes in Advances to Related Parties account are shown below.
Note 2017 2016
Balance at beginning of year P 808,425,160 P 188,573,879 Offsetting 10 ( 380,453,359 ) ( 3,024,605,395) Additions 10 2,615,300 3,710,305,258 Repayments ( 2,606,510) ( 65,852,182)
Balance at end of year P 427,980,591 P 808,425,160
The Advances from Related Parties amounted to P94.2 million and P167.0 million as of December 31, 2017 and 2016, respectively. This account represents advances from related parties under common ownership. The changes in Advances from Related Parties account are shown below.
Note 2017 2016 Balance at beginning of year P 167,039,625 P 2,982,620,700 Repayments ( 76,855,620 ) ( 258,336,385 ) Additions 4,020,937 467,360,705 Offsetting 10 - ( 3,024,605,395 ) Balance at end of year P 94,204,942 P 167,039,625
In 2016, the Group recognized a receivable from MBPHI amounting to P3.7 billion for the transferred parcels of land which will be used for the residential components of Site A (see Note 10). Consequently, the outstanding advances from MBPHI, before the transfer, amounting to P3.0 billion were fully settled through offsetting arrangements with MBPHI. As of December 31, 2017 and 2016, the remaining balance of receivable from MBPHI amounting to P0.3 billion and P0.7 billion, respectively, is presented as part of Advances to Related Parties account in the consolidated statements of financial position.

- 65 -
The advances to and from related parties have no fixed repayment terms and are unsecured, noninterest-bearing and generally payable in cash upon demand, or through offsetting arrangements with the related parties (see Note 26.2). Parties agreed that costs, if any, arising from those transactions shall be shouldered by the Group.
22.6 Operations and Management Agreement with GHL/Key Management
Personnel Compensation
Some of the Group’s administrative functions are being handled by certain key officers and employees under the management of GHL as agreed by both parties under the Operations and Management Agreement. These transactions are presented as part of Management fees under General and Administrative Expenses account in the consolidated statements of comprehensive income (see Note 17). The outstanding liability, which is unsecured, noninterest-bearing and payable in cash upon demand, arising from this transaction is presented as part of Accrued expenses under Trade and Other Payables account in the consolidated statements of financial position (see Note 15). The compensation of other key management personnel which is presented as part of Salaries, wages and employee benefits under the General and Administrative Expenses account in the consolidated statements of comprehensive income is shown below (see Note 20.1).
2017 2016 2015
Short-term benefits P 186,841,455 P 196,234,392 P 195,124,688
Post-employment defined benefits 880,119 740,681 919,137
P 187,721,574 P 196,975,073 P 196,043,825
The outstanding liability arising from this transaction is presented as part of Accrued expenses under Trade and Other Payables account in the consolidated statements of financial position (see Note 15).
22.7 Operating Lease Agreements The Company leases office spaces to certain related parties under common control and ownership with terms ranging from six to seven years, subject to renewal options. Total income recognized from these transactions are presented as part of Rentals under Other Operating Income – net account in the consolidated statements of comprehensive income (see Note 18). The outstanding receivables, which are unsecured, noninterest-bearing and payable in cash upon demand, arising from these transactions are presented as part of Trade receivables under Trade and Other Receivables account in the consolidated statements of financial position (see Note 6). 22.8 Retirement Plan The Group’s retirement fund is a multi-employer retirement plan, which is administered by a trustee bank. The retirement fund includes investments in cash, treasury bills and UITF with a total fair value of P42.2 million as of December 31, 2017. The details of the contributions of the Group and the fair value of the plan assets are presented in Note 20.2(b).

- 66 -
23. EQUITY
23.1 Capital Stock
As of December 31, 2017 and 2016, details of capital stock, net of portion in treasury, is as follows:
Number of Shares Amount Preferred A – P0.10 par value Authorized 73,000,000,000 P 7,300,000,000 Issued 73,000,000,000 7,300,000,000 Treasury shares – at cost ( 73,000,000,000) ( 7,300,000,000) Total outstanding - - Preferred B –P0.01 par value Authorized 20,000,000,000 200,000,000 Issued 20,000,000,000 200,000,000 Treasury shares – at cost ( 10,000,000,000) ( 100,000,000) Total outstanding 10,000,000,000 100,000,000 Common – P0.10 par value Authorized 25,000,000,000 2,500,000,000 Issued 25,000,000,000 2,500,000,000 Treasury shares – at cost ( 9,244,125,150) ( 924,412,515) Total outstanding 15,755,874,850 1,575,587,485
P 1,675,587,485
On June 8, 2013, the Parent Company approved the reclassification of its authorized capital from P10.0 billion divided into 9.9 billion voting, participating and reissuable preferred shares, redeemable at the option of the Parent Company, and 100.0 million common shares, both with a par value of P1.0 per share, into P10.0 billion divided into 25.0 billion common shares with par value of P0.10 per share, 73.0 billion redeemable, non-voting, non-participating and reissuable preferred A shares with par value of P0.10 per share; and, 20.0 billion redeemable, voting, participating and reissuable preferred B shares with par value of P0.01 per share. All the preferred shares are convertible into common shares and redeemable at the option of the Parent Company under such terms and conditions as may be determined by the Parent Company. The reclassification was subsequently approved by the SEC on June 26, 2013. On March 12, 2014, the SEC approved another amendment to the Group’s articles of incorporation to remove the convertibility feature of its preferred A and preferred B shares.
Also, on June 8, 2013, the Parent Company’s BOD approved the reissuance of 10.0 billion preferred B shares previously held under treasury at par value or P100.0 million. The preferred B shares are entitled to receive dividends at a rate, price, amount of participation, and other terms and conditions to be fixed by the Group prior to the dividend issue date. On November 5, 2013 and December 6, 2013, the Parent Company issued through Initial Public Offering (IPO) 1,573,222,300 common shares and exercised its over-allotment option of 23,645,550 common shares, respectively, at an issue price of P11.28 per common share. Such issuances resulted in an increase in APIC of P16.6 billion, which is net of IPO-related expenses of P1.3 billion.

- 67 -
As of December 31, 2017, there are 58 holders of the listed common shares owning at least one board lot of 100 shares. All shares of common stock of the Group are listed on the PSE. Such listed shares closed at P3.98 per share as of December 29, 2017 (the last trading day in 2017). 23.2 Retained Earnings The information of approved cash dividends, which did not violate any of the Group’s covenants related to its borrowings, are summarized below.
Date of Date of Date of Declaration Record Payment Amount
May 26, 2017 May 31, 2017 June 9, 2017 P 630,234,994 May 16, 2016 May 31, 2016 June 10, 2016 P 787,793,743 May 27, 2015 June 11, 2015 June 18, 2015 P 1,119,001,025
Cash dividends declared in 2017, 2016 and 2015 were fully paid in the same year. The Parent Company’s retained earnings are restricted to the extent of the cost of the treasury shares as of the end of the reporting periods.
23.3 Revaluation Reserves The components and reconciliation of items of other comprehensive income (loss) presented in the consolidated statements of changes in equity at their aggregate amount under Revaluation Reserves account, are shown below.
AFS Retirement
Financial Benefit
Assets Obligation
(see Note 27.2) (see Note 20.2) Total
Balance as of January 1, 2017 P 21,151,080 P 32,491,231 P 53,642,311
Remeasurements of retirement benefit
obligation - ( 7,373,913 ) ( 7,373,913 )
Fair value gains on AFS financial assets 8,300,000 - 8,300,000
Tax effect - ( 3,792,651 ) ( 3,792,651 )
Other comprehensive income (loss) 8,300,000 ( 11,166,564 ) ( 2,866,564 )
Balance as of December 31, 2017 P 29,451,080 P 21,324,667 P 50,775,747
Balance as of January 1, 2016 P 14,931,080 P 44,784,007 P 59,715,087
Remeasurements of retirement benefit
obligation - ( 6,866,435 ) ( 6,866,435 )
Fair value gains on AFS financial assets 6,220,000 - 6,220,000
Tax effect - ( 5,426,341 ) ( 5,426,341 )
Other comprehensive income (loss) 6,220,000 ( 12,292,776 ) ( 6,072,776 )
Balance as of December 31, 2016 P 21,151,080 P 32,491,231 P 53,642,311

- 68 -
24. COMMITMENTS AND CONTINGENCIES
24.1 Operating Lease Commitment – Group as Lessor The Group is a lessor under non-cancellable operating lease agreements covering certain office, commercial and other spaces. The leases have terms ranging from three to seven years, with renewal options, and include annual escalation rate of 3% to 10%. The future minimum lease receivables, wherein significant renewals were entered into by the parties in 2017 and 2016, under these non-cancellable operating leases as at December 31 are as follows:
2017 2016 Within one year P 255,793,264 P 335,299,249 After one year but not more than five years 115,021,141 246,616,273 More than five years 430,850,250 502,921,277
P 801,664,655 P 1,084,836,799
Total rentals from these operating leases in 2017, 2016 and 2015 amounted to P406.3 million, P404.9 million, and P377.6 million, respectively, and presented as part of Rentals under the Other Operating Income – net account in the consolidated statements of comprehensive income (see Note 18). 24.2 Operating Lease Commitment – Group as Lessee The Group is a lessee under a non-cancellable operating lease agreement covering certain parcels of land. The lease has a term of 25 years, renewable for another 25 years, and includes escalation rate of 5% every five years. The Group made advance rentals in 2014 amounting to P1.0 billion covering the first 20 years of the lease (see Note 13). The future minimum lease payments under this non-cancellable operating lease for the remaining five years of the lease term amounted to P151.4 million as of December 31, 2017 and 2016.
24.3 Various Hotel Agreements
(a) Marriott Group
The Group has various service, license and royalty agreements with Marriott International B.V., Marriott International Design and Construction Services Inc., and International Hotel Licensing Company S.A.R.L., and Marriott International Licensing Company B.V. (collectively hereafter referred to as Marriott Group) for the license, supervision, direction, control and management of operations of the Group’s Marriott, including the monitoring of its compliance with Marriott Group’s standards. The service agreements also include certain services in support of Marriott outside the Philippines. Such services are generally made available to hotels in the Marriott System and shall include the international advertising, promotion and sales programs, core training programs and other training programs for the benefit of the Marriott employees, special services and programs for the benefit of the Marriott System, and the reservations system, property management system and other systems.
- 69 -
Further, the license and royalty agreement with Marriott Group grants the Group a nonexclusive and nontransferable right and license within Metro Manila to use the Marriott Trademarks for hotel services and other related goods and services offered only in connection with the Group’s Marriott. Payments to be made by the Group shall be computed based on the provisions of the above agreements. Total amounts recognized from these transactions in 2017, 2016 and 2015 totaled P81.4 million, P62.8 million and P63.2 million, respectively, and are presented as part of Management fees under the General and Administrative Expenses account in the consolidated statements of comprehensive income (see Note 17). The outstanding liabilities, which are unsecured, noninterest-bearing and payable in cash upon demand, as at December 31, 2017 and 2016 amounted to P7.5 million and P7.2 million, respectively, and are presented as part of Accrued expenses under Trade and Other Payables account in the consolidated statements of financial position (see Note 15).
(b) Holiday Inn
In 2017, the Group also entered into a Hotel Management Agreement (HMA) with Holiday Inns (Philippines), Inc. for the license, supervision, direction, control and management of operations of Holiday Inn Express (formerly Remington Hotel), including the monitoring of its compliance with the hotel group standards.
The HMA includes security arrangements, refurbishment of the existing structure, rebranding, advertising, promotion and sales programs, core training programs and other training programs for the benefit of the employees, special services, the reservations system, property management system and other systems.
The parties also entered into a Franchise Agreement for the non-exclusive use and non-transferable license to use the brand marks for the hotel services and other related goods offered in connection with the Group’s Holiday Inn Express, which started operating in January 2018.
As of December 31, 2017, there were no payments yet for the agreements with Holiday Inn.
(c) Okura
Also in 2017, the Company and Hotel Okura Co., Ltd (Okura) signed another HMA for the license, supervision, direction, control and management of operations of the Hotel Okura Manila, which includes advertising, promotion and sales programs, core training programs and other training programs for the benefit of the employees, special services, the reservations system, property management system and other systems.
The HMA with Okura grants the Group a nonexclusive and nontransferable right to use the Okura trademarks for hotel services and other related goods and services offered only in connection with the Hotel Okura Manila, which is expected to open in 2018.
As of December 31, 2017, there were no payments yet for the agreement with Okura.

- 70 -
(d) Sheraton Manila Hotel
In 2017, an Operating Services Agreement (OSA) was executed between LSHRI and Starwood Asia Pacific Hotels & Recreation PTE. LTD (Starwood), a fully-owned company of Marriott Group, for the license, supervision, direction, control and management of operations of the Sheraton Manila Hotel, including the monitoring of its compliance with Marriott Group’s standards.
The OSA also includes certain services similar to those covered by the existing agreement with the Marriott Group. Likewise, the license and royalty agreement with Starwood grants LSHRI similar rights provided by Marriott Group to the Parent Company. Sheraton Manila Hotel is expected to start its operations in 2018.
As of December 31, 2017, there were no payments yet for the agreement with Starwood.
(e) Hilton Manila Hotel
Also in 2017, a Management Agreement (MA) was executed between DHRI and Hilton International Manage LLC (Hilton) for the license, supervision, direction, control and management of operations of Hilton Manila Hotel, including the monitoring of its compliance with Hilton’s standards.
The MA includes design and decoration of the Hilton Manila Hotel, advertising, promotion and sales programs, core training programs and other training programs for the benefit of the Hilton employees, special services and programs, and the reservations system, property management system and other systems.
The MA grants DHRI a nonexclusive and nontransferable right to use the Hilton Trademarks for hotel services and other related goods and services offered only in connection with the Hilton Manila Hotel. The Hilton Manila Hotel is expected to start its operations in 2018. As of December 31, 2017, there were no payments yet for the agreement with Hilton.
24.4 Provisional License Agreement with PAGCOR
On June 2, 2008, PAGCOR issued a Provisional License authorizing the Group to participate in the development of a portion of certain entertainment sites (Site A and Site B), which is part of a larger scale integrated tourism project envisioned by the PAGCOR, and to establish and operate casinos, and engage in gambling activities in Sites A and B (collectively referred to as the Project). The term of the Group’s License shall be co-terminus with PAGCOR’s franchise which will expire on July 11, 2033 and shall be renewed subject to the terms of the PAGCOR Charter.
(a) Debt–Equity Ratio Requirement
The Provisional License Agreement provides, among others, that the Group’s License may be revoked or suspended upon failure of the Group to comply with the 70% Debt – 30% Equity ratio requirement of PAGCOR (see Note 28). As at December 31, 2017 and 2016, the Group is in compliance with this provision.

- 71 -
(b) Accession of WCRWI to the Provisional License
On March 18, 2013, the Company and WCRWI entered into a deed of accession (the Deed of Accession), which was accepted, agreed and consented to by PAGCOR. Pursuant to the Deed of Accession, WCRWI acceded to the rights, title, interests and obligations of the Group under the Provisional License and other relevant agreements with PAGCOR. Accordingly, PAGCOR recognized and included WCRWI as a co-licensee and co-holder of the Provisional License and other relevant agreements with PAGCOR. Further, on June 10, 2013, the Company and WCRWI entered into a cooperation agreement (the Cooperation Agreement) which designates the parties’ respective rights, interests and obligations under the Provisional License and other relevant agreements with PAGCOR. Specifically, the parties agreed that WCRWI would have all the rights and obligations under the Provisional License with respect to Site A and that the Company would have all the rights and obligations with respect to Site B. Accordingly, on June 28, 2013, PAGCOR issued an Amended Certificate of Affiliation and Provisional License certifying the Company and WCRWI as co-licensees and co-holders of the Provisional License and other relevant agreements with PAGCOR. As co-licensees and co-holders, the Company and WCRWI are bound by certain investment commitments [see Note 24.4(c)].
(c) Investment Commitments
As required by the Provisional License Agreement, the Company and WCRWI are required to complete its U.S. $1.3 billion (about P64.8 billion) investment commitment in phases, wherein the amount is divided into Site A and Site B with the minimum investment of U.S. $1.1 billion (about P54.8 billion) and U.S. $216.0 million (about P10.8 billion), respectively [see Note 24.4(b)]. The cost of the Project includes land acquisition costs, costs related to securing development rights, construction, equipment, development costs, financing costs and all other expenses directly related to the completion of the Project (see Notes 10 and 11).
Since PAGCOR was only able to turnover and/or deliver possession of Site A property to the Group in 2014, PAGCOR approved a revised project implementation plan for the Westside City Resorts World Project. WCRWI held the groundbreaking rites at Site A on October 1, 2014.
As a requirement in developing the aforementioned Project, the Group transferred U.S. $100.0 million (about P5.0 billion) to an escrow account with a universal bank mutually agreed by PAGCOR and the Group. At any given time, the escrow account shall have a maintaining balance of not lower than U.S. $50.0 million (about P2.5 billion) (see Note 5). If the funds fall below the maintaining balance at any given time, the Group is allowed a 15-day grace period to achieve the maintaining balance, failure in which will cause the Group to be charged by PAGCOR an amount equal to P2.5 million for every 15 calendar day period, or a fraction thereof, until the balance is maintained. All funds for the development of the Project shall pass through the escrow deposit and all drawdowns of funds therefrom must be applied to the Project.

- 72 -
As at December 31, 2017, the Group has spent P74.2 billion for its casino projects pursuant to its investment commitments under the Provisional License Agreement.
The Group has short-term placements amounting to U.S. $62.1 million (about P3.1 billion) and U.S. $62.4 million (about P3.1 billion) as at December 31, 2017 and 2016, respectively, to meet its requirements with PAGCOR in relation to the Group’s investment commitments (see Note 5).
(d) Requirement to Establish a Foundation
The Group, with the approval of PAGCOR, is required to incorporate and register a foundation for the restoration of cultural heritage not later than 60 days from the signing of the Provisional License Agreement. In compliance with the said requirement, Resorts World Philippines Cultural Heritage Foundation Inc. (or the Foundation), formerly Manila Bayshore Heritage Foundation, Inc., was incorporated in the Philippines on September 7, 2011 primarily to engage in various activities for charitable, educational, cultural and artistic purposes, and to promote, perpetuate, preserve and encourage Filipino culture.
The Foundation shall be funded by the Group by setting aside funds on a monthly basis. The funds set aside shall be remitted to the Foundation on or before the 10th day of the succeeding month. The Group recognized accrual based on 2% of total gross gaming revenues from non-junket tables. PAGCOR sets the guidelines for the utilization of funds as it approves, monitors the implementation, and conducts a post-audit of the projects the Foundation undertakes. Pursuant to PAGCOR’s guidelines, the Foundation is tasked to undertake projects in line with the following disciplines: (i) restoration of cultural heritage; (ii) education infrastructure; and, (iii) environment and health. As of December 31, 2017, the following are the completed and on-going projects of the Foundation:
• Construction of school buildings in partnership with the Philippine Department of Education (DepEd) whereby five school buildings in various public schools in Metro Manila and Luzon were completed and turned over to DepEd and the collegiate universities, while one more school building is currently being constructed;
• Computerization project with DepEd through providing a computer laboratory to various public schools in various parts of the country whereby all phases of the said project covering 27 schools have been completed;
• Funding of the construction of a cadet barracks at the Philippine Military Academy (PMA) in Baguio City in a joint effort with another PAGCOR licensee’s foundation, which was completed and turned over to PMA;
• Agreements with various universities to provide scholarship opportunities to poor but deserving students enrolled in the field of performing arts whereby the related funds have been granted for the scholars in each school;
• Construction of treatment and rehabilitation centers in coordination with the Department of Health in Davao City and Taguig City; and,

- 73 -
• Donation of funds for medicines, medical supplies and equipment for Philippine National Police Camp Crame General Hospital and Paranaque City.
Donations made to the Foundation are recorded as part of Donations and contributions under General and Administrative Expenses account in the consolidated statements of comprehensive income (see Note 17). The outstanding liability, representing donations due for the last month of each year, and which is unsecured, noninterest-bearing and payable in cash upon demand, as at December 31, 2017 and 2016 is presented as part of Accrued expenses under Trade and Other Payables account in the consolidated statements of financial position (see Note 15).
(e) Tax Contingencies of Casino Operations
The Company is subject to 25% and 15% license fees, inclusive of franchise tax and in lieu of all taxes, with reference to the income component of the gross gaming revenues, as provided under the Provisional License Agreement with PAGCOR (see Notes 2.22 and 21.2). In April 2013, however, the BIR issued RMC 33-2013 declaring that PAGCOR, its contractees and its licensees are no longer exempt from corporate income tax under the National Internal Revenue Code of 1997, as amended (see Note 21.2).
In August 2016, the SC confirmed that “all contractees and licensees of PAGCOR, upon payment of the 5% franchise tax, shall be exempted from all other taxes, including income tax realized from the operation of casinos.” The SC Decision has been affirmed with finality in the SC Resolution dated November 28, 2016, when it denied the Motion for Reconsideration filed by the BIR.
24.5 Participation in the Incorporation of Entertainment City Estate
Management, Inc. (ECEMI) As a PAGCOR licensee, the Group committed itself to take part in the incorporation of ECEMI in 2012, a non-stock, non-profit entity that shall be responsible for the general welfare, property, services and reputation of the Bagong Nayong Pilipino Entertainment City Manila. As at December 31, 2017 and 2016, contributions made to ECEMI amounted to P1.3 million and is presented as part of Advances to Related Parties account in the consolidated statements of financial position (see Note 22.5).
24.6 Others The Group has unutilized credit lines amounting to P3.5 billion and P15.0 billion as of December 31, 2017 and 2016, respectively (see Note 14). In 2016, the Group was granted a right by the Philippine Government to construct RunWay Manila, a pedestrian link bridge that connects NAIA 3 and Newport City, and which is accessible to the public, free of charge (see Note 11). RunWay Manila was fully financed by the Group and was completed in April 2017.

- 74 -
On June 2, 2017, a certain individual entered the Company’s premises, fired his assault rifle, and set ablaze gaming furniture and equipment in the casino which resulted to physical damages on a portion of the Company’s properties [see Notes 3.1(d) and 11]. The individual forcibly entered the casino area with a clear motive to rob and he started fires as a diversionary tactic. The smoke from the fires caused the death of several employees and guests, as well as physical injuries to a number of people.
As opined by the Parent Company’s external counsel, based on the reports from the insurer’s adjusters, and taking into consideration the reports of the pertinent government agencies, there is strong legal ground to believe that the insurance claims related to the June 2 incident will not be disallowed. Consequently, the Company recognized and presented property damages and losses, and other losses as Losses from Casualty, Net of Insurance Claims, in the 2017 consolidated statement of comprehensive income. The related receivable representing the reimbursement from expected minimum insurance claims and recoveries from the third party insurance company is presented as Claims receivable under Trade and Other Receivables account in the 2017 consolidated statement of financial position (see Note 6).
Also, the Group in the normal course of its business makes other various construction and other commitments, and incurs certain contingent liabilities which are not reflected as at the end of the reporting periods in the financial statements. Management believes that losses, if any, that may arise from these commitments and contingencies will not have any material effects on the consolidated financial statements.
25. RISK MANAGEMENT OBJECTIVES AND POLICIES
The Group is exposed to a variety of financial risks in relation to financial instruments. The Group’s financial assets and financial liabilities by category are summarized in Note 26. The main types of risks are market risk (foreign currency, interest rate risk and other price risk), credit risk and liquidity risk. The Group’s risk management is coordinated with its BOD and focuses on actively securing the Group’s short to medium-term cash flows by minimizing the exposure to financial markets. Long-term financial investments are managed to generate lasting returns. The Group does not actively engage in the trading of financial assets for speculative purposes. The relevant financial risks to which the Group is exposed to are described in the succeeding pages.

- 75 -
25.1 Market Risk
The Group is exposed to market risk through its use of financial instruments and specifically to foreign currency risk, interest rate risk and certain other price risk which result from both its operating, investing and financing activities.
(a) Foreign Currency Risk
Most of the Group’s transactions are carried out in Philippine pesos, its functional currency. Exposures to currency exchange rates arise from the Group’s foreign currency-denominated Cash and Cash Equivalents, Trade and Other Receivables, Trade and Other Payables, Notes Payable and Derivative Liability, which are primarily denominated in U.S. dollar (USD) and Hong Kong dollar (HKD).
To mitigate the Group’s exposure to foreign currency risk, non-Philippine peso cash flows are monitored.
Foreign currency denominated financial assets and financial liabilities, translated into Philippine pesos at the closing rate, are as follows:
2017 USD PHP Equivalent HKD PHP Equivalent
Financial assets $ 21,959,664 P 1,096,292,290 $ 259,023,740 P 1,654,695,454 Financial liabilities ( 326,966 ) ( 16,323,127 ) ( 79,590,215) ( 508,438,210 ) $ 21,632,698 P 1,079,969,163 $ 179,433,525 P 1,146,257,244
2016 USD PHP Equivalent HKD PHP Equivalent
Financial assets $ 25,101,839 P 1,250,397,924 $ 292,011,805 P 1,875,066,204 Financial liabilities ( 305,058,189 ) ( 15,195,863,559 ) ( 66,645,886 ) ( 427,946,562 ) ( $ 279,956,350 ) ( P 13,945,465,635 ) $ 225,365,919 P 1,447,119,642
The sensitivity of the income before tax for the period with regard to the Group’s financial assets and the USD – Philippine peso exchange rate assumes +/- 13.0% and +/- 12.9% changes in exchange rate for the years ended December 31, 2017 and 2016, respectively. The HKD – Philippine peso exchange rate assumes +/- 13.5% and +/- 12.7% changes for 2017 and 2016, respectively. These percentages have been determined based on the average market volatility in exchange rates in the previous year and 12 months, respectively, estimated at 99% level of confidence. The sensitivity analysis is based on the Group’s foreign currency financial instruments held at each reporting periods. If the Philippine peso had strengthened against the USD, with all other variables held constant, consolidated profit before tax would have decreased by P0.1 billion in 2017 and increased by P1.8 billion in 2016. If in 2017 and 2016, the Philippine peso had strengthened against the HKD, with all other variables held constant, consolidated profit before tax would have decreased by P154.7 million and P183.8 million, respectively. However, if the Philippine peso had weakened against the USD and the HKD by the same percentages, consolidated profit before tax would have changed at the opposite direction by the same amounts.

- 76 -
Exposures to foreign exchange rates vary during the year depending on the volume of foreign currency denominated transactions. Nonetheless, the analysis above is considered to be representative of the Group’s currency risk.
(b) Interest Rate Risk
The Group’s policy is to minimize interest rate cash flow risk exposures on long-term financing. Majority of long-term borrowings are therefore usually at fixed rates. At December 31, 2017 and 2016, the Group is exposed to changes in market interest rates through Cash and Cash Equivalents and certain Interest-bearing Loans and Borrowings which are subject to variable interest rates (see Notes 5 and 14). All other interest-bearing financial assets and liabilities have fixed rates.
The following illustrates the sensitivity of the Group’s profit before tax to a reasonably possible change in interest rates of +/- 0.16% and +/- 0.25% for Philippine pesos in 2017 and 2016, respectively. These percentage changes in rates have been determined based on the average market volatility in interest rates, using standard deviation, in the previous 12 months, estimated at 99% level of confidence. The sensitivity analysis is based on the Group’s consolidated financial instruments held at the end of each reporting periods, with effect estimated from the beginning of the year. All other variables are held constant, if interest rate increased by 0.16% in 2017 and 0.25% in 2016, consolidated profit before tax in 2017 and 2016 would have increased by P62.5 million and P23.1 million, respectively. Conversely, if the interest rate decreased by the same percentages, consolidated profit before tax would have been lower by the same amounts in 2017 and 2016.
(c) Other Price Risk
The Group was exposed to other price risk in respect of its liability swap agreement involving floating rate coupons since the Group’s payments were based on cumulative performance of an index specifically agreed with the bank (see Note 16). The Group’s sensitivity to other price risk in regards to the said liability swap agreement cannot be reliably determined due to numerous uncertainties regarding the future cumulative performance of the index against the backdrop of current issues in the global economy. On November 3, 2017, the Group settled the derivative liability. The Group has recognized unrealized loss on this derivative transaction amounting to U.S.$0.5 million (P27.2 million), U.S.$0.6 million (P31.8 million) and U.S. $0.6 million (P30.2 million) in 2017, 2016 and 2015, respectively (see Note 19).
25.2 Credit Risk
Credit risk is the risk that a counterparty may fail to discharge an obligation to the Group. The Group is exposed to this risk for various financial instruments, which include granting loans and receivables to customers and other counterparties, and placing deposits. The Group continuously monitors defaults of customers and other counterparties, identified either individually or by group, and incorporate this information into its credit risk controls. The Group’s policy is to deal only with creditworthy counterparties.

- 77 -
Generally, the maximum credit risk exposure of financial assets is the carrying amount of the financial assets as shown on the face of the consolidated statements of financial position (or in the detailed analysis provided in the notes to the consolidated financial statements) as summarized below.
Notes 2017 2016 Cash and cash equivalents 5 P 10,553,173,676 P 13,250,208,941 Trade and other receivables (except Advances to suppliers) 6 1,600,897,591 648,318,708 Advances to related parties 22.5 427,980,591 808,425,160 Refundable deposits 13 122,489,847 87,359,262 Investments in time deposits 8 117,126,031 115,737,185 Accumulated jackpot seed money 13 169,300,000 170,676,888
P 12,990,967,736 P 15,080,726,144
None of the Group’s financial assets are secured by collateral or other credit enhancements, except for cash and cash equivalents as described below.
(a) Cash and Cash Equivalents and Investments in Time Deposits
The credit risk for cash and cash equivalents and investments in time deposits is considered negligible, since the counterparties are reputable banks with high quality external credit ratings.
Cash in banks are insured by the Philippine Deposit Insurance Corporation up to a maximum coverage of P0.5 million per depositor per banking institution.
(b) Trade and Other Receivables
In respect of trade and other receivables, the Group has significant outstanding receivables from related parties and from a third party insurance company representing the reimbursement from expected minimum insurance claims and recoveries. Based on historical information about default rates and financial condition of the related parties and other counterparties, management considers the credit quality of these receivables to be good. Further, the management considers the recovery of the insurance claims as highly probable and virtually certain from the third party insurance company (see Note 24.6).
(c) Advances to Related Parties and Refundable Deposits
The Group is not exposed to any significant credit risk on its advances to and refundable deposits from related parties with good credit standing. Accordingly, management considers the credit quality of advances to and refundable deposits from related parties to be good.
(d) Accumulated Jackpot Seed Money
In respect of accumulated jackpot seed money, credit risk is considered negligible as the asset is being managed along with the Group’s cash and cash equivalents and investments in time deposits [see Note 25.2(a)].

- 78 -
The Group’s management considers that all the above financial assets that are not impaired or past due at the end of each reporting periods are of good credit quality. There are no significant financial assets which are past due but not impaired as at the end of the reporting periods. 25.3 Liquidity Risk The Group manages its liquidity needs by carefully monitoring scheduled debt servicing payments for long-term financial liabilities as well as cash outflows due in a day-to-day business. Liquidity needs are monitored in various time bands, on a day-to-day and week-to-week basis, as well as on the basis of a rolling 30-day projection. Long-term liquidity needs for a 6-month and one-year periods are identified monthly.
The Group maintains cash to meet its liquidity requirements for up to 60-day periods. Excess cash is invested in time deposits or short-term marketable securities. Funding for long-term liquidity needs is additionally secured by an adequate amount of committed credit facilities and the ability to sell long-term financial assets.
As at December 31, 2017, the Group’s financial liabilities have contractual maturities which are presented below.
Current Non-current Within 6 to 12 1 to 5 6 Months Months Years
Interest-bearing loans and borrowings P 19,675,000,000 P - P14,404,047,500 Trade and other payables (except tax-related liabilities, license fees payable and liability for unredeemed gaming points) 9,364,133,498 - - Advances from related parties 94,204,942 - - Other non-current liabilities - - 175,863,371
P 29,133,338,440 P - P14,579,910,871
This compares to the contractual maturities of the Group’s financial liabilities as of December 31, 2016 as follows:
Current Non-current Within 6 to 12 1 to 5 6 Months Months Years
Interest-bearing loans and borrowings P 5,105,125,000 P 2,020,000,000 P - Trade and other payables (except tax-related liabilities, license fee payables and liability for unredeemed gaming points) 8,003,915,328 - - Advances from related parties 167,039,625 - - Notes payable 515,564,550 15,287,609,700 - Derivative liability - 327,939,175 - Other non-current liabilities - - 171,957,924
P13,791,644,503 P17,635,548,875 P 171,957,924
The contractual maturities reflect the gross cash flows which may differ from the carrying values of the financial liabilities at the end of the reporting periods.

- 79 -
26. CATEGORIES, FAIR VALUES AND OFFSETTING OF FINANCIAL ASSETS AND FINANCIAL LIABILITIES 26.1 Carrying Amounts and Fair Values by Category
The carrying amounts and fair values of the categories of financial assets and financial liabilities presented in the consolidated statements of financial position are shown below.
2017 2016 Notes Carrying Values Fair Values Carrying Values Fair Values
Financial assets Loans and receivables: Cash and cash equivalents 5 P 10,553,173,676 P 10,553,173,676 P 13,250,208,941 P 13,250,208,941 Trade and other receivables 6 1,600,897,591 1,600,897,591 648,318,708 648,318,708 Advances to related parties 22.5 427,980,591 427,980,591 808,425,160 808,425,160 Refundable deposits 13 122,489,847 122,489,847 87,359,262 87,359,262 Investments in time deposits 8 117,126,031 117,126,031 115,737,185 115,737,185 Accumulated jackpot seed money 13 169,300,000 169,300,000 170,676,888 170,676,888 P 12,990,967,736 P 12,990,967,736 P 15,080,726,144 P 15,080,726,144
AFS financial assets P 78,200,000 P 78,200,000 P 69,900,000 P 69,900,000
Financial liabilities At amortized cost: Interest-bearing loans and borrowings 14 P 31,443,147,332 P 31,443,147,332 P 7,000,000,000 P 7,000,000,000 Trade and other payables 15 9,364,133,498 9,364,133,498 8,003,915,328 8,003,915,328 Advances from related parties 22.5 94,204,942 94,204,942 167,039,625 167,039,625 Notes payable 16 - - 14,879,062,940 14,879,062,940 Other non-current liabilities 15 175,863,371 175,863,371 171,957,924 171,957,924 P 41,077,349,143 P 41,077,349,143 P30,221,975,817 P 30,221,975,817 At FVTPL – Derivative liability 16 P - P - P 327,939,175 P 327,939,175
See Notes 2.5, 2.6 and 2.11 for the description of the accounting policies for each category of financial instruments including the determination of fair values. A description of the Group’s risk management objectives and policies for financial instruments is provided in Note 25.
26.2 Offsetting of Financial Assets and Financial Liabilities The Group has not set-off financial instruments in 2017 and 2016 and does not have relevant offsetting arrangements, except as disclosed in Note 22.5. Currently, all other financial assets and financial liabilities are settled on a gross basis; however, each party to the financial instrument (particularly related parties) will have the option to settle all such amounts on a net basis in the event of default of the other party through approval by both parties’ BOD and stockholders. As such, the Group’s outstanding receivables from and payables to the same related parties as presented in Note 22 can be potentially offset to the extent of their corresponding outstanding balances.

- 80 -
27. FAIR VALUE MEASUREMENT AND DISCLOSURE 27.1 Fair Value Hierarchy
In accordance with PFRS 13, the fair value of financial assets and financial liabilities and non-financial assets which are measured at fair value on a recurring or non-recurring basis and those financial assets and financial liabilities not measured at fair value but for which fair value is disclosed in accordance with other relevant PFRS, are categorized into three levels based on the significance of inputs used to measure the fair value. The fair value hierarchy has the following levels: (a) Level 1: quoted prices (unadjusted) in active markets for identical assets or
liabilities;
(b) Level 2: inputs other than quoted prices included within Level 1 that are observable for the asset or liability, either directly (i.e., as prices) or indirectly (i.e., derived from prices); and,
(c) Level 3: inputs for the asset or liability that are not based on observable market data (unobservable inputs).
The level within which the asset or liability is classified is determined based on the lowest level of significant input to the fair value measurement. For purposes of determining the market value at Level 1, a market is regarded as active if quoted prices are readily and regularly available from an exchange, dealer, broker, industry group, pricing service, or regulatory agency, and those prices represent actual and regularly occurring market transactions on an arm’s length basis. 27.2 Financial Instruments Measured at Fair Value Golf club and other club shares classified as AFS financial assets are included in Level 2 as their prices are not derived from market and not considered as active due to lack of trading activities among market participants at the end or close to the end of the reporting period. The fair value of these shares increased by P8.3 million, P6.2 million, and P2.0 million in 2017, 2016 and 2015, respectively. These are presented as Net Unrealized Fair Value Gains on Available-for-sale Financial Assets in Other Comprehensive Income (Loss) section of the consolidated statements of comprehensive income. Amounts recognized in other comprehensive income were included within item that will be reclassified subsequently to profit or loss. Accumulated fair value gains on AFS financial assets is presented as part of Revaluation Reserves account in the consolidated statements of financial position (see Note 23.3).
The fair value of derivative liability is measured at inputs other than quoted prices that are indirectly observable for the liability and is categorized within Level 2. These fair values are derived from prices set in the derivative contract.
There were no transfers across the levels of the fair value hierarchy in both years.
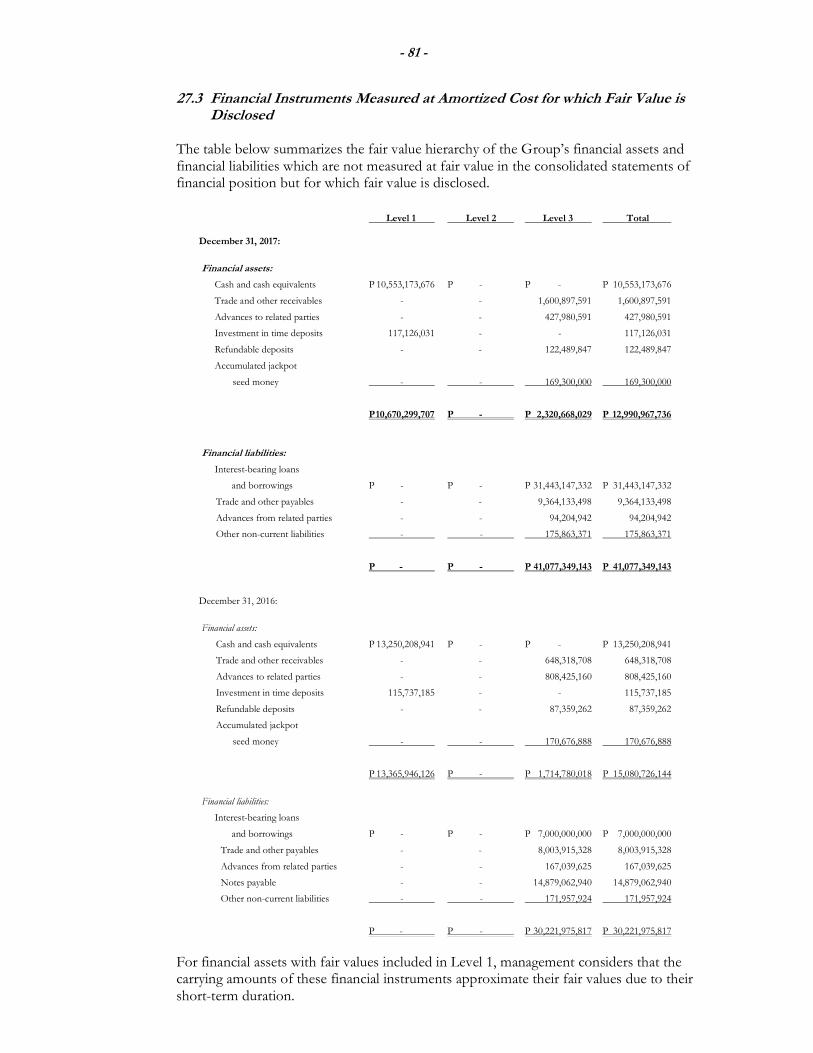
- 81 -
27.3 Financial Instruments Measured at Amortized Cost for which Fair Value is Disclosed
The table below summarizes the fair value hierarchy of the Group’s financial assets and financial liabilities which are not measured at fair value in the consolidated statements of financial position but for which fair value is disclosed.
Level 1 Level 2 Level 3 Total December 31, 2017:
Financial assets:
Cash and cash equivalents P 10,553,173,676 P - P - P 10,553,173,676
Trade and other receivables - - 1,600,897,591 1,600,897,591
Advances to related parties - - 427,980,591 427,980,591
Investment in time deposits 117,126,031 - - 117,126,031
Refundable deposits - - 122,489,847 122,489,847
Accumulated jackpot
seed money - - 169,300,000 169,300,000
P 10,670,299,707 P - P 2,320,668,029 P 12,990,967,736
Financial liabilities:
Interest-bearing loans
and borrowings P - P - P 31,443,147,332 P 31,443,147,332
Trade and other payables - - 9,364,133,498 9,364,133,498
Advances from related parties - - 94,204,942 94,204,942
Other non-current liabilities - - 175,863,371 175,863,371
P - P - P 41,077,349,143 P 41,077,349,143
December 31, 2016:
Financial assets:
Cash and cash equivalents P 13,250,208,941 P - P - P 13,250,208,941
Trade and other receivables - - 648,318,708 648,318,708
Advances to related parties - - 808,425,160 808,425,160
Investment in time deposits 115,737,185 - - 115,737,185
Refundable deposits - - 87,359,262 87,359,262
Accumulated jackpot
seed money - - 170,676,888 170,676,888
P 13,365,946,126 P - P 1,714,780,018 P 15,080,726,144
Financial liabilities:
Interest-bearing loans
and borrowings P - P - P 7,000,000,000 P 7,000,000,000
Trade and other payables - - 8,003,915,328 8,003,915,328
Advances from related parties - - 167,039,625 167,039,625
Notes payable - - 14,879,062,940 14,879,062,940
Other non-current liabilities - - 171,957,924 171,957,924
P - P - P 30,221,975,817 P 30,221,975,817
For financial assets with fair values included in Level 1, management considers that the carrying amounts of these financial instruments approximate their fair values due to their short-term duration.

- 82 -
The fair values of the financial assets and financial liabilities included in Level 3, which are not traded in an active market, are determined based on the expected cash flows of the underlying net asset or liability base of the instrument where the significant inputs required to determine the fair value of such instruments are not based on observable market data.
27.4 Fair Value for Investment Property Measured at Cost for which Fair Value
is Disclosed The fair value of the Group’s investment property (see Note 12) was determined by an independent appraiser with appropriate qualifications and recent experience in the valuation of similar properties in the relevant locations. To some extent, the valuation process was conducted by the appraiser in discussion with the Group’s management with respect to the determination of the inputs such as location and neighborhood, access and transportation, infrastructure, land particulars, shape and topography, zoning and planning, environmental and other relevant considerations. In estimating the fair value of these properties, management takes into account the market participant’s ability to generate economic benefits by using the assets in their highest and best use. Based on management assessment, the best use of the Group’s investment property is their current use.
As of December 31, 2017 and 2016, the fair value of the Group’s investment property is classified in Level 3 of the fair value hierarchy. The Level 3 fair value of the investment property was determined using the income approach which is performed with values derived using a 15-year discounted cash flow model with 16th year reversion value. The income approach uses future free cash flow projections and discounts them to arrive at a present value. The discount rate is based on the level of risk of the business opportunity and costs of capital. For the investment property, the approach involves the projection of the discounting revenues, outgoing expenses over the future 15 years with reference to the anticipated revenues. The reversion value at the 16th year is capitalized at an appropriate capitalization rate to determine the terminal value of the asset. The adopted capitalization for the asset may reflect the quality and market position of the asset at the end of the cash flow. The most significant inputs into this valuation approach are the estimated annual cash inflow and outgoing expenses, anticipated increase in market rental, discount rate and terminal capitalization rate.
28. CAPITAL MANAGEMENT OBJECTIVES, POLICIES AND PROCEDURES
The Group’s capital management objectives are to ensure the Group’s ability to continue as a going concern entity and to provide an adequate return to stockholders by pricing services commensurate with the level of risk.
The Group monitors capital on the basis of the carrying amount of equity as presented on the face of the Parent Company’s statements of financial position. The Group’s goal in capital management is for the Group to maintain a debt – equity structure of not higher than 70% debt – 30% equity ratio [see Note 24.4(a)]. Capital of the Parent Company for the reporting periods and the computation of debt – equity structure as at December 31, 2017, 2016 and 2015 are in the succeeding page.

- 83 -
2017 2016 2015 Total debt from financing: Interest-bearing loans and borrowings P31,443,147,332 P 7,000,000,000 P 221,808,235 Advances from related parties 94,204,942 167,039,625 338,468,813 Notes payable - 14,879,062,940 14,021,596,999 31,537,352,274 22,046,102,565 14,581,874,047 Total equity 44,490,657,826 45,063,065,681 42,611,682,525 Debt-equity ratio 41% – 59% 33% – 67% 25% – 75%
All ratios as at December 31, 2017, 2016 and 2015 are in line with the Group’s Provisional License Agreement with PAGCOR [see Note 24.4(a)]. The Group sets the amount of capital in proportion to its overall financing structure, i.e., total equity and total debt from financing. The Group manages the capital structure and makes adjustments to it in the light of changes in economic conditions and the risk characteristics of the underlying assets. In order to maintain or adjust the capital structure, the Group may adjust the amount of dividends paid to stockholders, issue new shares or sell assets to reduce debt.
29. EARNINGS PER SHARE
Earnings per share is computed as follows:
2017 2016 2015
Basic and diluted:
Net profit attributable to
Parent Company’s shareholders P 251,150,857 P 3,402,125,080 P 4,021,379,516
Divided by weighted average number
of outstanding common shares 15,755,874,850 15,755,874,850 15,755,874,850
P 0.02 P 0.22 P 0.26
In relation to the approved ESOP for key executive officers, there are no potentially dilutive shares since the Group has not granted any share options to its eligible optionees. There were no other potentially dilutive shares as at December 31, 2017, 2016 and 2015. Accordingly, the basic and diluted earnings per share are the same for all periods presented.

A. Statement of Management’s Responsibility for the Consolidated Financial Statements
B. Independent Auditors’ Report on the SEC Supplementary SchedulesFiled Separately from the Basic Consolidated Financial Statements
C. Schedule of Financial Indicators for December 31, 2017 and 2016
D. List of Supplementary Information
Supplementary Schedules to Consolidated Financial Statements (Form 17-A, Item 7)
Schedule Page
A Financial Assets 1Financial Assets at Fair Value Through Profit or LossHeld-to-maturity InvestmentsAvailable-for-sale Financial Assets
B Amounts Receivable from Directors, Officers, Employees, Related Partiesand Principal Stockholders (Other than Affiliates) 2
C Amounts Receivable from Related Parties which are Eliminated during the Consolidation of Financial Statements 3
D Intangible/ Other Assets 4
E Long-term Debt 5
F Indebtedness to Related Parties 6
G Guarantees of Securities of Other Issuers 7
H Capital Stock 8
Schedule of Philippine Financial Reporting Standards and InterpretationsAdopted by the Securities and Exchange Commission and the Financial Reporting Standards Council as of December 31, 2017 9 - 12
Reconciliation of Retained Earnings Available for Dividend Declaration 13
Map Showing the Relationship Between and Among the Company and its Related Entities 14 - 15
TRAVELLERS INTERNATIONAL HOTEL GROUP, INC. AND SUBSIDIARIESLIST OF SUPPLEMENTARY INFORMATION
DECEMBER 31, 2017
Content


December 31, 2017 December 31, 2016 December 31, 2017 December 31, 2016
I. Current/liquidity ratios
a. Current RatioTotal Current Assets 19,615,306,170 P 19,375,450,016 P 0.66 0.62
Total Current Liabilities 29,739,717,515 31,349,290,028
b. Quick Ratio[Cash and Cash Equivalents +
Investment in Time Deposits (presentedunder Prepayments and Other Current Assets) +
Trade and Other Receivables] 17,426,996,101 17,361,511,888 0.59 0.55Total Current Liabilities 29,739,717,515 31,349,290,028
II. Solvency ratios
a. Solvency RatioEarnings Before Interest and Taxes 1,119,176,605 4,202,908,712 0.03 0.13
Total Liabilities 42,186,793,445 31,683,728,199
b. Debt RatioTotal Liabilities 42,186,793,445 31,683,728,199 0.49 0.42
Total Assets 86,420,451,646 76,308,789,996
c. Debt-to-Equity RatioTotal Liabilities 42,186,793,445 31,683,728,199 0.96 0.71
Total Equity Attributable to Shareholders 44,014,527,918 44,396,478,619 of the Parent Company
III. Asset-to-equity ratio
Total Assets 86,420,451,646 76,308,789,996 1.96 1.72Total Equity Attributable to Shareholders 44,014,527,918 44,396,478,619
of the Parent Company
IV. Interest Coverage RatioEarnings Before Interest and Taxes 1,119,176,605 4,202,908,712 0.62 2.91
Interest Expense 1,791,204,651 1,445,648,433
V. Profitability Ratios
a. Net Profit MarginNet Profit 241,697,962 3,398,526,614 0.01 0.14
Net Revenues* 19,258,927,495 25,094,628,640
b. Gross Profit MarginGross Profit 10,165,715,592 14,478,498,017 0.53 0.58
Net Revenues* 19,258,927,495 25,094,628,640
c. Return on EquityNet profit 241,697,962 3,398,526,614 0.01 0.08
Average Equity Attributable to Shareholders 44,205,503,269 43,092,349,340 of the Parent Company
d. Return on AssetsNet Profit 241,697,962 3,398,526,614 0.003 0.05
Average Total Assets 81,364,620,821 73,038,363,803
e. Price/Earnings RatioPrice per Share 3.98 3.29 255.59 12.65
Earnings per Share 0.02 0.26
VI. Debt Service Coverage Ratio
a. Debt Service Coverage RatioEarnings Before Interest, Taxes, Depreciation
and Allowances 3,458,345,347 6,420,532,834 0.21 3.84Total Debt Service** 16,735,841,189 1,670,648,433
* Revenues after deducting promotional allowance.** Sum of Principal repayments and Interest expense during the year
TRAVELLERS INTERNATIONAL HOTEL GROUP, INC. AND SUBSIDIARIESSchedule of Financial Indicators for December 31, 2016 and 2015
As required under SRC Rule 68, as amendedFor the Years Ended December 31, 2017 and 2016
(Amounts in Philippine Pesos)
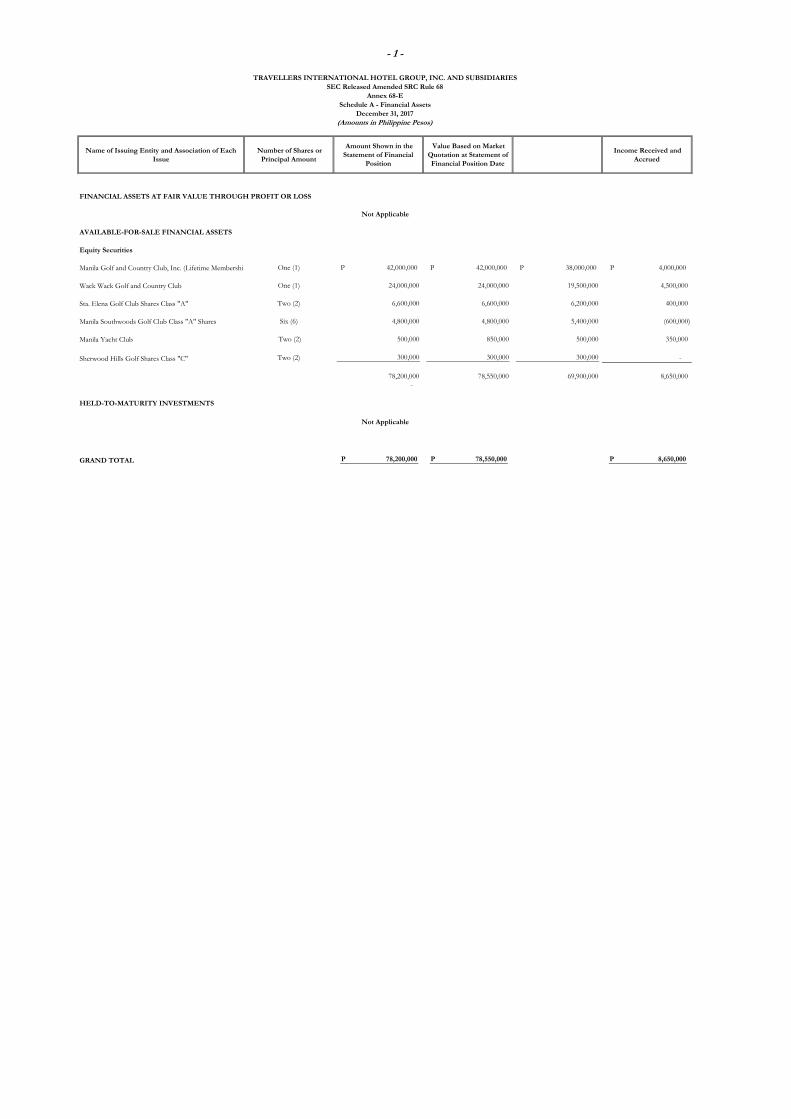
- 1 -
Name of Issuing Entity and Association of Each Issue
Number of Shares or Principal Amount
Amount Shown in the Statement of Financial
Position
Value Based on Market Quotation at Statement of Financial Position Date
Income Received and Accrued
FINANCIAL ASSETS AT FAIR VALUE THROUGH PROFIT OR LOSS
AVAILABLE-FOR-SALE FINANCIAL ASSETS
Equity Securities
Manila Golf and Country Club, Inc. (Lifetime Membership One (1) 42,000,000 P 42,000,000 P 38,000,000 P 4,000,000 P
Wack Wack Golf and Country Club One (1) 24,000,000 24,000,000 19,500,000 4,500,000
Sta. Elena Golf Club Shares Class "A" Two (2) 6,600,000 6,600,000 6,200,000 400,000
Manila Southwoods Golf Club Class "A" Shares Six (6) 4,800,000 4,800,000 5,400,000 (600,000)
Manila Yacht Club Two (2) 500,000 850,000 500,000 350,000
Sherwood Hills Golf Shares Class "C" Two (2) 300,000 300,000 300,000 -
78,200,000 78,550,000 69,900,000 8,650,000 -
HELD-TO-MATURITY INVESTMENTS
GRAND TOTAL 78,200,000 P 78,550,000 P 8,650,000 P
Not Applicable
Not Applicable
(Amounts in Philippine Pesos)
TRAVELLERS INTERNATIONAL HOTEL GROUP, INC. AND SUBSIDIARIESSEC Released Amended SRC Rule 68
Annex 68-ESchedule A - Financial Assets
December 31, 2017

- 2 -
Amounts Collected
Amounts Written-off
Current Not Current
Amounts Receivable from Related Parties OFFICERS AND EMPLOYEES 70,058,195 P 365,823 P - 69,692,372 P - 69,692,372 P ANDERSONS GLOBAL INC. 31,904,832 - - 31,904,832 - 31,904,832 GENTING HONG KONG LIMITED 19,712,011 638,224 - 19,073,787 - 19,073,787 MEGAWORLD CORPORATION - 41,672 - - 41,672 - 41,672 MANILA BAYSHORE PROPERTY HOLDINGS INC. 683,670,604 380,453,358 - 303,217,246 - 303,217,246 FRONT ROW THEATRE MANAGEMENT INC. 1,561,364 1,560,864 - 500 - 500 ENTERTAINMENT CITY ESTATE MGT. INC. 1,250,000 - - 1,250,000 - 1,250,000 Resorts World Philippines Cultural Heritage
Foundation Inc., formerly Manila Bayshore Heritage Foundation Inc. 230,861 136,104 - - 366,965 - 366,965
Children of Resorts World Foundation, Inc. 1,420,582 - - 1,420,582 - 1,378,982
Original Pilipino Performing Arts Foundation Inc. 37,293 1,016,941 - - 1,054,234 - 1,054,234
TOTAL 808,425,160 P 2,615,300 P 383,018,269 P - 428,022,191 P - 427,980,591 P
Balance at End of Year
Name and Designation of Debtor Balance at
Beginning of Year Additions
Deductions Ending Balance
(Amounts in Philippine Pesos)
TRAVELLERS INTERNATIONAL HOTEL GROUP, INC. AND SUBSIDIARIESSEC Released Amended SRC Rule 68
Annex 68-ESchedule B - Amounts Receivable from Directors, Officers, Employees, Related Parties and Principal Stockholders (Other than Affliates)
December 31, 2017
P P
PPP

- 3 -
Amounts CollectedAmounts Written-
offCurrent Not Current
Amounts Receivable from Related Parties Eliminated During Consolidation:
Brightleisure Management Inc. 15,729,476 P 250,369,265 P 195,002,239 P - 71,096,503 P - 71,096,503 P Grandventure Management Services Inc. 11,973,657 776,873,304 656,322,165 - 132,524,796 - 132,524,796 Grand Services Inc. 68,083,237 39,351,142 22,584,660 - 84,849,718 - 84,849,718 Apec Assets Limited 877,370,709 12,029,610 208,877 - 889,191,442 - 889,191,442 Grand Integrated Hotels And Recreation Inc 31,416,486 33,724,433 31,658,012 - 33,482,907 - 33,482,907 Netdeals, Inc 8,899,412 2,001,530 - 6,897,882 - 6,897,882 Lucky Star Hotels And Recreation Inc 2,445,950,669 1,438,667,404 1,968,560 - 3,882,649,513 - 3,882,649,513 Deluxe Hotels And Recreation Inc 2,480,390,398 1,831,228,064 51,755,092 - 4,259,863,370 - 4,259,863,370 Newport Star Lifestyle, Inc 668,921 668,869 - 52 - 52 Royal Bayshore Hotels And Amusement Inc 18,385,070 25,658,582 33,138,632 - 10,905,020 - 10,905,020 Entertainment City Integrated Resorts And Leisure Inc 403,215 - 403,215 403,215 Majestic Sunrise Leisure And Recreation Inc 26,954,261 - - 26,954,261 - 26,954,261 FHTC Entertainment & Production Inc. 111,682,567 192,835,973 124,885,856 - 179,632,684 - 179,632,684 Golden Peak Leisure And Recreation 31,958,024 3,346,905 1,401,207 - 33,903,722 - 33,903,722 Bright Pelican Leisure & 206,650 500 - - 207,150 - 207,150 Westside City Resorts World Inc. 322,089,765 1,282,958,210 - - 1,605,047,975 - 1,605,047,975
Formerly Resorts World Bayshore City Inc.Lucky Panther Amusement And Leisure Corporation 1,002,450 500 - - 1,002,950 - 1,002,950 Valiant Leopard Amusement And Leisure Corporation 1,002,465 500 - - 1,002,965 - 1,002,965 Agile Fox Amusement And Leisure Corporation 1,002,600 270,865,902 - - 271,868,502 - 271,868,502 Coral Primrose Leisure And Leisure Corporation 1,002,450 500 - - 1,002,950 - 1,002,950 Sapphire Carnation Leisure And Recreation Corporation 1,002,465 500 - - 1,002,965 - 1,002,965 Aquamarine Delphinium Leisure And Recreation Corporation 1,002,450 500 - - 1,002,950 - 1,002,950 Westside Theater Inc. 550,446 500 - - 550,946 - 550,946 Red Falcon Amusement And Leisure Corporation 145,236 500 - - 145,736 - 145,736 Purple Flamingos Amusement And Leisure Corporation 145,236 500 - - 145,736 - 145,736 Scarlet Milky Way Amusement And Leisure Corporation 1,002,600 500 - - 1,003,100 - 1,003,100 Vermillion Triangulum Amusement And Leisure Corporation 1,002,450 500 - - 1,002,950 - 1,002,950 Magenta Centaurus Amusement And Leisure Corporation. 1,002,565 500 - - 1,003,065 - 1,003,065 Sparkling Summit Hotels And Leisure Corporation 1,003,450 500 - 1,003,950 1,003,950 Luminescent Vertex Hotels And Leisure Corporation 1,002,450 500 - - 1,002,950 - 1,002,950 Brilliant Apex Hotels And Leisure Corporation 1,002,600 500 - - 1,003,100 - 1,003,100
6,465,034,433 P 6,157,916,292 P 1,121,595,699 P - 11,501,355,026 P - 11,501,355,026 P
Balance at End of Year
TRAVELLERS INTERNATIONAL HOTEL GROUP, INC. AND SUBSIDIARIESSEC Released Amended SRC Rule 68
Annex 68-ESchedule C - Amounts Receivable from or Payable to Related Parties which are Eliminated during the Consolidation of Financial Statements
December 31, 2017(Amounts in Philippine Pesos)
Name and Designation of DebtorBalance at
Beginning of YearAdditions
Deductions Ending Balance
P P
P P

- 4 -
Beginning Balance Additions at CostCharged to Cost and
ExpensesCharged to Other
Accounts
Other Changes Additions
(Deductions) Ending Balance
Leasehold Right 883,333,333 P - 50,000,000 )( P - - 833,333,333 P
Description
TRAVELLERS INTERNATIONAL HOTEL GROUP, INC. AND SUBSIDIARIESSEC Released Amended SRC Rule 68
Annex 68-ESchedule D - Intangible/Other Assets
December 31, 2017(Amounts in Philippine Pesos)
PP P

- 5 -
Title of Issue and Type of ObligationAmount Authorized by
Indenture
Amount Shown Under Caption "Current Portion of Long-term Debt" in Related
Statement of Financial Position
Amount Shown Under Caption"Long-term Debt" in related Statement of Financial
Position
Long Term-Loans (7 Years) - China Bank 3,500,000,000 P - 3,483,862,354 P Long Term-Loans (7 Years) - China Bank 3,500,000,000.00 - 3,483,200,993 Long Term-Loans (7 Years) - Union Bank 3,500,000,000.00 - 3,483,583,985 Long Term-Loans (7 Years) - Union Bank 1,500,000,000.00 - 1,492,500,000
Total 12,000,000,000 P - 11,943,147,332 P
(Amounts in Philipine Pesos)
TRAVELLERS INTERNATIONAL HOTEL GROUP, INC. AND SUBSIDIARIESSEC Released Amended SRC Rule 68
Annex 68-ESchedule E - Long-term Debt
December 31, 2017

- 6 -
Name of Related Party Balance at
Beginning of Year Balance at End of Year
Purpose
Star Cruises Limited 66,019,602 P 53,570,068 P Purchase of servicesFamous City Holdings Inc. 63,657,863 10,649,867 Advances or purchases of servicesStar Cruises Management Limited 12,307,341 13,724,112 Purchase of servicesMegaworld Corporation 11,164,224 - Purchase of servicesKeen Classic Limited 4,786,805 4,800,845 Advances or purchases of servicesStar Cruises Administrative Services 2,932,806 3,052,254 Purchase of servicesStar Cruises Bvi Limited 2,957,711 2,966,386 Advances or purchases of servicesStar Cruise Hong Kong Management Limited - 2,462,004 Purchase of servicesResorts World Sentosa 1,537,192 1,537,192 Purchase of servicesMacau Crocksfords 1,442,214 1,442,214 Purchase of servicesStar Cruises Hong Kong Limited Services 233,867 - Purchase of services
TOTAL 167,039,625 P 94,204,942 P
(Amounts in Philippine Pesos)
TRAVELLERS INTERNATIONAL HOTEL GROUP, INC. AND SUBSIDIARIESSEC Released Amended SRC Rule 68
Annex 68-ESchedule F - Indebtedness to Related Parties (Current Liabilities)
December 31, 2017
P

- 7 -
Name of Issuing Entity of Securities Guaranteed by the Company for which This Statement is Filed
Title of Issue of Each Class of Securities Guaranteed
Total Amount Guaranteed and Outstanding
Amount Owned by Person for which This Statement
is FiledNature of Guarantee
TRAVELLERS INTERNATIONAL HOTEL GROUP, INC. AND SUBSIDIARIESSEC Released Amended SRC Rule 68
Annex 68-ESchedule G - Guarantees of Securities of Other Issuers
December 31, 2017(Amounts in Philipine Pesos)
Not Applicable
The Group does not have any guarantee as at December 31, 2017.

- 8 -
Related Parties Directors, Officers
and Employees Others
Common shares 25,000,000,000 15,755,874,850 - 14,174,909,950 79,100 1,580,885,800
Preferred shares (A) 73,000,000,000 - - - - -
Preferred shares (B) 20,000,000,000 10,000,000,000 - 10,000,000,000 - -
Title of Issue Number of Shares
Authorized
Number of Shares Issued and Outstanding as
Shown Under the Related Statement of Condition
Caption
Number of Shares Reserved for Options, Warrants, Conversion
and Other Rights
Number of Shares Held by
(Amounts in Philippine Pesos)
TRAVELLERS INTERNATIONAL HOTEL GROUP, INC. AND SUBSIDIARIESSEC Released Amended SRC Rule 68
Annex 68-ESchedule H - Capital Stock
December 31, 2017
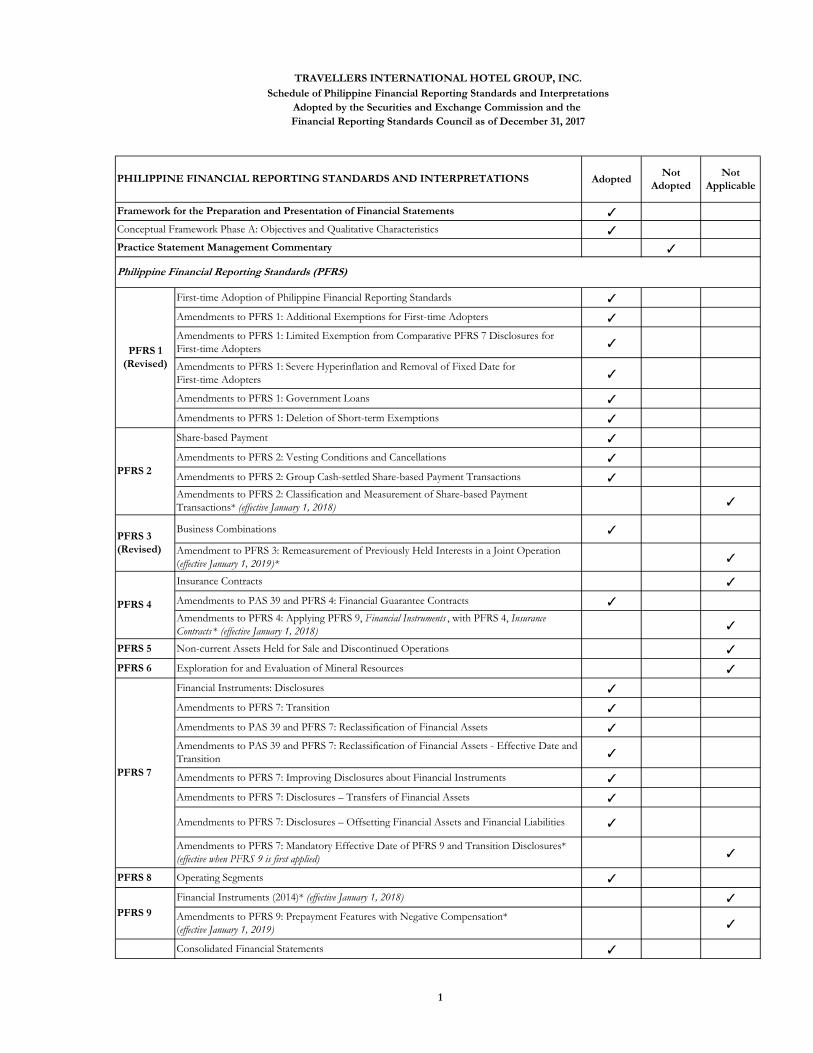
AdoptedNot
Adopted
Not
Applicable
a
a
a
First-time Adoption of Philippine Financial Reporting Standards a
a
Amendments to PFRS 1: Limited Exemption from Comparative PFRS 7 Disclosures for
First-time Adopters a
Amendments to PFRS 1: Severe Hyperinflation and Removal of Fixed Date for
First-time Adopters a
Amendments to PFRS 1: Government Loans a
Amendments to PFRS 1: Deletion of Short-term Exemptions a
Share-based Payment a
Amendments to PFRS 2: Vesting Conditions and Cancellations a
Amendments to PFRS 2: Group Cash-settled Share-based Payment Transactions a
Amendments to PFRS 2: Classification and Measurement of Share-based Payment
Transactions* (effective January 1, 2018) a
Business Combinations a
Amendment to PFRS 3: Remeasurement of Previously Held Interests in a Joint Operation
(effective January 1, 2019)* a
Insurance Contracts a
Amendments to PAS 39 and PFRS 4: Financial Guarantee Contracts a
Amendments to PFRS 4: Applying PFRS 9, Financial Instruments , with PFRS 4, Insurance
Contracts * (effective January 1, 2018) a
PFRS 5 Non-current Assets Held for Sale and Discontinued Operations a
PFRS 6 Exploration for and Evaluation of Mineral Resources a
Financial Instruments: Disclosures a
Amendments to PFRS 7: Transition a
Amendments to PAS 39 and PFRS 7: Reclassification of Financial Assets a
Amendments to PAS 39 and PFRS 7: Reclassification of Financial Assets - Effective Date and
Transition a
Amendments to PFRS 7: Improving Disclosures about Financial Instruments a
Amendments to PFRS 7: Disclosures – Transfers of Financial Assets a
Amendments to PFRS 7: Disclosures – Offsetting Financial Assets and Financial Liabilities a
Amendments to PFRS 7: Mandatory Effective Date of PFRS 9 and Transition Disclosures*
(effective when PFRS 9 is first applied) a
PFRS 8 Operating Segments a
Financial Instruments (2014)* (effective January 1, 2018) a
Amendments to PFRS 9: Prepayment Features with Negative Compensation*
(effective January 1, 2019) a
Consolidated Financial Statements a
Conceptual Framework Phase A: Objectives and Qualitative Characteristics
Practice Statement Management Commentary
Philippine Financial Reporting Standards (PFRS)
PFRS 1
(Revised)
Amendments to PFRS 1: Additional Exemptions for First-time Adopters
PFRS 2
PFRS 3
(Revised)
PFRS 4
PFRS 7
PFRS 9
Framework for the Preparation and Presentation of Financial Statements
TRAVELLERS INTERNATIONAL HOTEL GROUP, INC.
Schedule of Philippine Financial Reporting Standards and Interpretations
Adopted by the Securities and Exchange Commission and the
Financial Reporting Standards Council as of December 31, 2017
PHILIPPINE FINANCIAL REPORTING STANDARDS AND INTERPRETATIONS
1
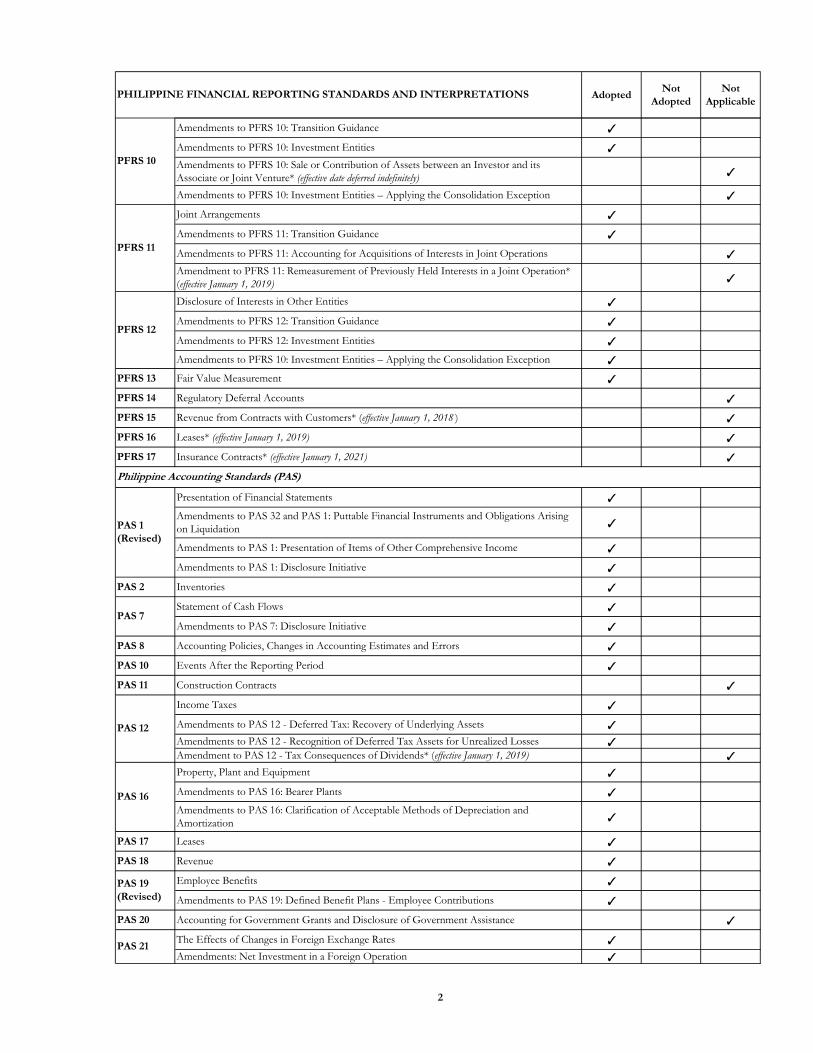
AdoptedNot
Adopted
Not
ApplicablePHILIPPINE FINANCIAL REPORTING STANDARDS AND INTERPRETATIONS
Amendments to PFRS 10: Transition Guidance a
Amendments to PFRS 10: Investment Entities a
Amendments to PFRS 10: Sale or Contribution of Assets between an Investor and its
Associate or Joint Venture* (effective date deferred indefinitely) a
Amendments to PFRS 10: Investment Entities – Applying the Consolidation Exception a
Joint Arrangements a
Amendments to PFRS 11: Transition Guidance a
Amendments to PFRS 11: Accounting for Acquisitions of Interests in Joint Operations a
Amendment to PFRS 11: Remeasurement of Previously Held Interests in a Joint Operation*
(effective January 1, 2019) a
Disclosure of Interests in Other Entities a
Amendments to PFRS 12: Transition Guidance a
Amendments to PFRS 12: Investment Entities a
Amendments to PFRS 10: Investment Entities – Applying the Consolidation Exception a
PFRS 13 Fair Value Measurement a
PFRS 14 Regulatory Deferral Accounts a
PFRS 15 Revenue from Contracts with Customers* (effective January 1, 2018 ) a
PFRS 16 Leases* (effective January 1, 2019) a
PFRS 17 Insurance Contracts* (effective January 1, 2021) a
Presentation of Financial Statements a
Amendments to PAS 32 and PAS 1: Puttable Financial Instruments and Obligations Arising
on Liquidation a
Amendments to PAS 1: Presentation of Items of Other Comprehensive Income a
Amendments to PAS 1: Disclosure Initiative a
PAS 2 Inventories a
Statement of Cash Flows a
Amendments to PAS 7: Disclosure Initiative a
PAS 8 Accounting Policies, Changes in Accounting Estimates and Errors a
PAS 10 Events After the Reporting Period a
PAS 11 Construction Contracts a
Income Taxes a
Amendments to PAS 12 - Deferred Tax: Recovery of Underlying Assets a
Amendments to PAS 12 - Recognition of Deferred Tax Assets for Unrealized Losses a
Amendment to PAS 12 - Tax Consequences of Dividends* (effective January 1, 2019) a
Property, Plant and Equipment a
Amendments to PAS 16: Bearer Plants a
Amendments to PAS 16: Clarification of Acceptable Methods of Depreciation and
Amortization a
PAS 17 Leases a
PAS 18 Revenue a
Employee Benefits a
Amendments to PAS 19: Defined Benefit Plans - Employee Contributions a
PAS 20 Accounting for Government Grants and Disclosure of Government Assistance a
The Effects of Changes in Foreign Exchange Rates a
Amendments: Net Investment in a Foreign Operation a
PFRS 12
Philippine Accounting Standards (PAS)
PAS 1
(Revised)
PAS 7
PAS 12
PAS 16
PAS 19
(Revised)
PAS 21
PFRS 11
PFRS 10
2

AdoptedNot
Adopted
Not
ApplicablePHILIPPINE FINANCIAL REPORTING STANDARDS AND INTERPRETATIONS
Borrowing Costs a
Amendment to PAS 23: Eligibility for Capitalization a
PAS 24
(Revised) Related Party Disclosures a
PAS 26 Accounting and Reporting by Retirement Benefit Plans a
Separate Financial Statements a
Amendments to PAS 27: Investment Entities a
Amendments to PAS 27: Equity Method in Separate Financial Statements a
Investments in Associates and Joint Ventures a
Amendments to PFRS 10: Sale or Contribution of Assets between an Investor and its
Associate or Joint Venture* (effective date deferred indefinitely) a
Amendments to PAS 28: Investment Entities - Applying the Consolidation Exception a
Amendment to PAS 28: Measurement of Investment in Associates at Fair Value through
Profit or Loss* (effective January 1, 2018) a
Amendment to PAS 28: Long-term Interest in Associates and Joint Venture*
(effective January 1, 2019 ) a
PAS 29 Financial Reporting in Hyperinflationary Economies a
Financial Instruments: Presentation a
Amendments to PAS 32 and PAS 1: Puttable Financial Instruments and Obligations Arising
on Liquidation a
Amendments to PAS 32: Classification of Rights Issues a
Amendments to PAS 32: Offsetting Financial Assets and Financial Liabilities a
PAS 33 Earnings Per Share a
PAS 34 Interim Financial Reporting a
Impairment of Assets a
Amendment to PAS 36: Recoverable Amount Disclosures for Non-financial Assets a
PAS 37 Provisions, Contingent Liabilities and Contingent Assets a
Intangible Assets a
Amendments to PAS 38: Clarification of Acceptable Methods of Depreciation and
Amortization a
Financial Instruments: Recognition and Measurement a
Amendments to PAS 39: Transition and Initial Recognition of Financial Assets and Financial
Liabilities a
Amendments to PAS 39: Cash Flow Hedge Accounting of Forecast Intragroup Transactions a
Amendments to PAS 39: The Fair Value Option a
Amendments to PAS 39 and PFRS 4: Financial Guarantee Contracts a
Amendments to PAS 39 and PFRS 7: Reclassification of Financial Assets a
Amendments to PAS 39 and PFRS 7: Reclassification of Financial Assets – Effective Date and
Transition a
Amendments to Philippine Interpretation IFRIC 9 and PAS 39: Embedded Derivatives a
Amendments to PAS 39: Eligible Hedged Items a
Amendments to PAS 39: Novation of Derivatives and Continuation of Hedge Accounting a
Investment Property a
Amendment to PAS 40: Reclassification to and from Investment Property*
(effective January 1, 2018 ) a
Agriculture a
Amendments to PAS 41: Bearer Plants a
PAS 36
PAS 38
PAS 39
PAS 40
PAS 41
PAS 32
PAS 23
(Revised)
PAS 27
(Revised)
PAS 28
(Revised)
3

AdoptedNot
Adopted
Not
ApplicablePHILIPPINE FINANCIAL REPORTING STANDARDS AND INTERPRETATIONS
IFRIC 1 Changes in Existing Decommissioning, Restoration and Similar Liabilities a
IFRIC 2 Members' Share in Co-operative Entities and Similar Instruments a
IFRIC 4 Determining Whether an Arrangement Contains a Lease a
IFRIC 5 Rights to Interests Arising from Decommissioning, Restoration and Environmental
Rehabilitation Funds a
IFRIC 6 Liabilities Arising from Participating in a Specific Market - Waste Electrical and Electronic
Equipment a
IFRIC 7 Applying the Restatement Approach under PAS 29, Financial Reporting in Hyperinflationary
Economies a
Reassessment of Embedded Derivatives** a
Amendments to Philippine Interpretation IFRIC–9 and PAS 39: Embedded Derivatives** a
IFRIC 10 Interim Financial Reporting and Impairment a
IFRIC 12 Service Concession Arrangements a
IFRIC 13 Customer Loyalty Programmes a
PAS 19 - The Limit on a Defined Benefit Asset, Minimum Funding Requirements and their
Interaction a
Amendments to Philippine Interpretations IFRIC - 14, Prepayments of a Minimum Funding
Requirement and their Interaction** a
IFRIC 16 Hedges of a Net Investment in a Foreign Operation a
IFRIC 17 Distributions of Non-cash Assets to Owners** a
IFRIC 18 Transfers of Assets from Customers** a
IFRIC 19 Extinguishing Financial Liabilities with Equity Instruments** a
IFRIC 20 Stripping Costs in the Production Phase of a Surface Mine a
IFRIC 21 Levies a
IFRIC 22 Foreign Currency Transactions and Advance Consideration (effective January 1, 2018 )* a
IFRIC 23 Uncertainty Over Income Tax Treatments (effective January 1, 2019 )* a
SIC-7 Introduction of the Euro a
SIC-10 Government Assistance - No Specific Relation to Operating Activities a
SIC-13 Jointly Controlled Entities - Non-Monetary Contributions by Venturers a
SIC-15 Operating Leases - Incentives a
SIC-25 Income Taxes - Changes in the Tax Status of an Entity or its Shareholders** a
SIC-27 Evaluating the Substance of Transactions Involving the Legal Form of a Lease a
SIC-29 Service Concession Arrangements: Disclosures a
SIC-31 Revenue - Barter Transactions Involving Advertising Services** a
SIC-32 Intangible Assets - Web Site Costs** a
* These standards will be effective for periods subsequent to 2017 and are not early adopted by the Company.
** These standards have been adopted in the preparation of financial statements but the Company has no significant transactions covered
in both years presented.
IFRIC 9
IFRIC 14
Philippine Interpretations - Standing Interpretations Committee (SIC)
Philippine Interpretations - International Financial Reporting Interpretations Committee (IFRIC)
4

- 13 -
Unappropriated Retained Earnings Available for Dividend Declaration, beginning 20,962,080,587 P
Prior Year Reconciling Item/Adjustment –Deferred tax income from minimum corporate income tax
paid on gaming operations reversed during the year 145,859,575 )(
Unappropriated Retained Earnings Available for Dividend Declaration, as adjusted, beginning 20,816,221,012
Net income actually earned/realized during the year 215,121,787
Other transactions during the year:
Treasury shares, at cost 8,324,412,515 )(
Dividends declaration during the year 630,234,994 )( 8,954,647,509 )(
TOTAL RETAINED EARNINGS AVAILABLE FOR
DIVIDEND DECLARATION, END 12,076,695,290 P
Newport Cybertourism Economic Zone, Pasay City
TRAVELLERS INTERNATIONAL HOTEL GROUP, INC.RECONCILIATION OF RETAINED EARNINGS AVAILABLE FOR
DIVIDEND DECLARATIONAs of December 31, 2017
10/F Newport Entertainment & Commercial Centre, Newport Boulevard,
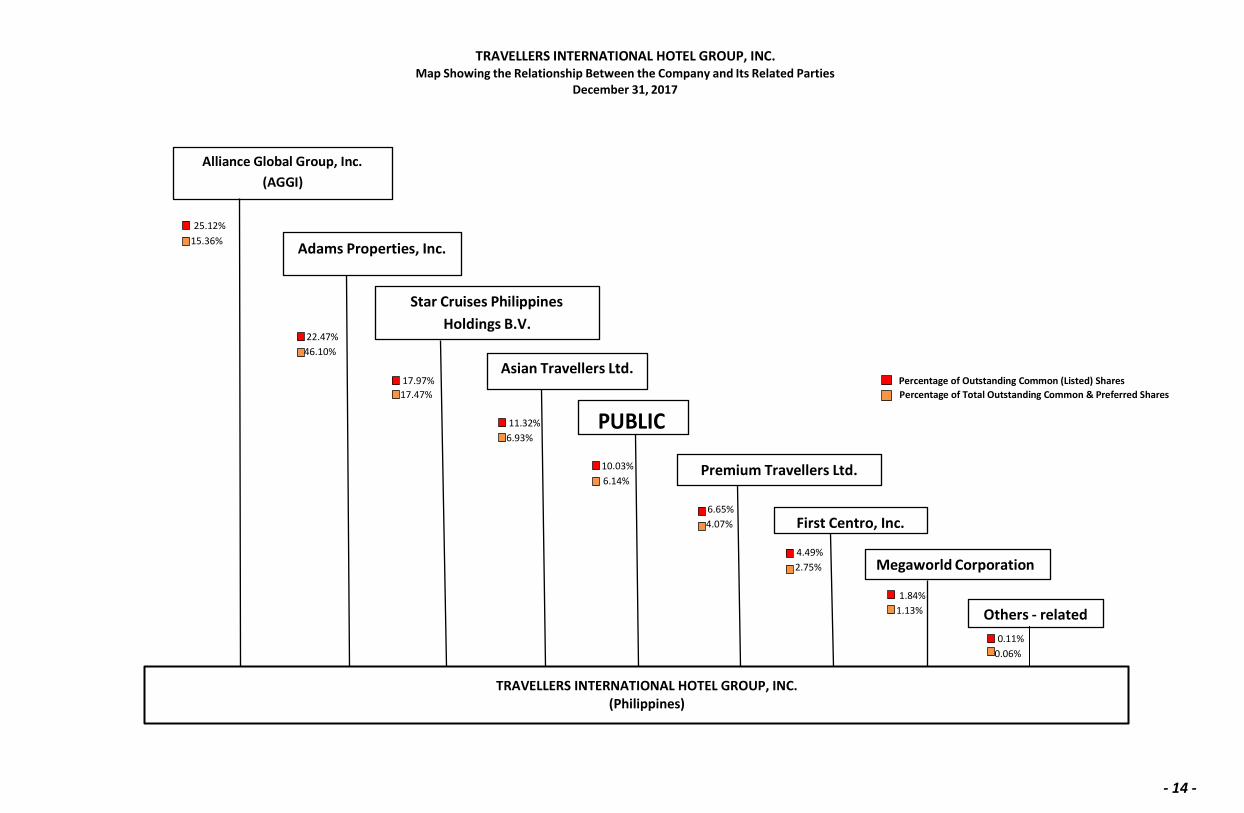
0.06%
TRAVELLERS INTERNATIONAL HOTEL GROUP, INC. Map Showing the Relationship Between the Company and Its Related Parties
December 31, 2017
Alliance Global Group, Inc.
(AGGI)
25.12%
15.36% Adams Properties, Inc.
22.47%
46.10%
Star Cruises Philippines
Holdings B.V.
Asian Travellers Ltd. 17.97% Percentage of Outstanding Common (Listed) Shares
17.47% Percentage of Total Outstanding Common & Preferred Shares
11.32%
6.93% PUBLIC
10.03%
6.14% Premium Travellers Ltd.
6.65%
4.07% First Centro, Inc.
4.49%
2.75%
Megaworld Corporation
1.84%
1.13%
Others - related
0.11%
0.06%
TRAVELLERS INTERNATIONAL HOTEL GROUP, INC. (Philippines)
- 14 -

TRAVELLERS INTERNATIONAL HOTEL GROUP, INC. Map Showing Relationship between the Company and its
Related Parties December 31, 2017
TRAVELLERS INTERNATIONAL HOTEL GROUP, INC. (Philippines)
100% Grandservices Inc. 100% Grand Integrated
Hotels and Recreation
Inc.
95% Westside City Resorts World Inc.
100% 100%
100% Newport Star
Lifestyle Inc.
100% Lucky Star Hotels
and Recreation Inc. 50%
Manila Bayshore
Property Holdings
Inc.
100% Grandventure
Management Services
Inc.
100%
Netdeals, Inc.
Purple Flamingos
Amusement and
Leisure Corporation
Red Falcon
Amusement and
Leisure Corporation
100% Deluxe Hotels and
Recreation Inc.
100% Bright Pelican
Leisure and
Recreation Inc.
100% 100%
Brightleisure
Management Inc.
Resorts World
Philippines Cultural
Heritage Foundation Inc.
100%
100%
Royal Bayshore Hotels
and Amusement Inc.
Entertainment City
100% FHTC Entertainment
& Productions Inc.
50%
Front Row
100%
Golden Peak Leisure
and Recreation inc.
100% Agile Fox Amusement
and Leisure
Corporation
Aquamarine
100%
Coral Primrose Leisure
and Recreation
Corporation
Integrated Resorts and
Leisure Inc.
100% 100%
Majestic Sunrise Leisure
and Recreation Inc.
Theatre
Management
Inc.
APEC Assets Limited
100%
100%
Valiant Leopard
Amusement and
Leisure Corporation
Vermillion
100% 100%
Delphinium Leisure and
Recreation Corporation
Lucky Panther
Amusement and
Leisure Corporation 100%
Magenta Centaurus
Amusement and Leisure
Corporation
100% Scarlet Milky Way
Amusement and
Leisure Corporation
Triangulum
Amusement and
Leisure Corporation
100% Brilliant Apex Hotels
and Leisure
Corporation
100% Luminescent Vertex
Hotels and Leisure
Corporation
100% Sapphire Carnation
Leisure and Recreation
Corporation
100%
100%
Sparkling Summit
Hotels and Leisure
Corporation
Westside Theatre
Inc.
100% Original Pilipino
Performing Arts
(OPPA) Foundation
Inc.
Children of Resorts World Manila
Foundation, Inc.
100%
- 15 -