1 constructing fuzzy signature based on medical data student: bai qifeng client: prof. tom gedeon
Post on 19-Dec-2015
217 views
TRANSCRIPT

1
Constructing Fuzzy Signature Based on Medical Data
Student: Bai Qifeng
Client: Prof. Tom Gedeon

2
Proposal
Explore an approach to automatic construct Fuzzy signature based on medical database
It contains three questions:1. How to identify SARS suspect patients
group?2. How to explore the relationships among
symptoms?3. How to construct fuzzy signature based on
above analysis?

3
Fuzzy Logic Theory
Fuzzy logic uses linguistic rules which reflect uncertainty or vagueness of concepts in natural in natural language.
If 50m/h is the boundary of “slow” and “fast” , Conventional bivalent sets regards 50.1m/h as fast.
What if current speed is 49.9m/h?
In real world, it should be a smooth shift.

4
Fuzzy Set
Now, assume there are three temperatures
We can get the fuzzy sets:
A fuzzy set is a set whose elements have degrees of membership.
78.0,22.0,0,08.39 A
0,0,0,83.08.37 A
0,0,71.0,29.04.38 A
8.39,4.38,8.37U
38.4 39.837.8
37.3 37.9 38.6 39.1 400
0.2
0.4
0.6
0.8
1
Slight Moderate Sever
eExtreme

5
Why use fuzzy sets
Assume:1. IF Fever = Slight THEN
dose = Low.
2. IF Fever = Moderate THEN dose = Ave.
Fuzzy value of fever is slight = 0.29 and moderate = 0.71
Value of dose will share properties of both Low and Ave range.
IN
OUT
0
0. 2
0. 4
0. 6
0. 8
1
1. 2
37 38 39 40 41
Low Ave
38. 4
37. 9 38. 6 39. 1 40
0
0. 2
0. 4
0. 6
0. 8
1
1. 2
37 38 39 40 41
0.71
0.29

6
Problem Definition
A Major issue in fuzzy applications is how to create fuzzy rules
the number of rules have an exponential increase with the number of inputs and terms.
At least one activated rule for every input.
e.g. 5 terms, 2 inputs => 25 rules
5 terms, 5 inputs => 3,125 rules
)(|| kTOR

7
Sketch of Solution
Three possible solutions Decrease T :
Sparse Fuzzy System
Decrease K:
Hierarchical Fuzzy System
Decrease both simultaneously :
Sparse Hierarchical Fuzzy Rule Bases

8
Hierarchical Fuzzy Systems
Hierarchical fuzzy systems reduce to the dimension of the sub-rule bases k by using meta – levels

9
Fuzzy Signatures
Fuzzy signatures structure data into vectors of fuzzy values, each of which can be a further vector.
Each signature corresponds to a nested vector structures or, equivalently, to a tree graph.

10
Fuzzy Signatures
The relationship between higher and lower levels is govern by fuzzy aggregations.
Fuzzy aggregation contains union, average, intersection etc.Examples: Union: AUB = max [A, B] = A or B Intersection: A∩B = min [A,B] = A and B

11
Clustering
The aim of cluster analysis is to classify objects based on similarities among them.
Definition of cluster is a group of objects that are more similar to one another than to members of other clusters.
Clustering is unsupervised classification: no predefined classes

12
Clustering: Similarity
How to evaluate the similarities of data?
Cluster analysis adapts the distance between two points as the criterion of similarity.
Distance-type measure has Euclidean distance and City block distance.

13
Clustering: hard/fuzzy methods

14
Clustering: Procedure

15
Clustering: Fuzzy C-Means
Bezdek define objective function as :
represents the deviation of data with centre. The number m governs the influence of membership grades. uij represents the degree of membership of the data point xj belonging to v .
c
i
n
jij
mijm mvxXVUJ
1 1
21,;,
2ik vx

16
Clustering: Cluster Valid Index
Xie and Beni Index
The numerator calculates the compactness of data in the same cluster and the denominator computes the separateness of data in different clusters.
Smaller value of numerator validity index indicates that the clusters are more compact and larger values of denominator denotes the clusters are well separated.
min
),,( 1 1
2
jivvn
xvu
cVUVji
c
i
n
jji
mij
xie

17
Factor Analysis
Factor analyses are performed by examining the pattern of correlations between the observed measures.
. X is a vector of variables, where
is a vector of r<p latent variables called factors, is a (p*r) matrix of coefficients (loadings),
is a vector of random errors.
X
Tr ,,, 21
Tp ),,,( 21

18
Factor Analysis

19
Factor Analysis: Principal component analysis
Principal component analysis aims to reduce the dimension of variables and these new variables can interpret most of cases.

20
Factor Analysis: Principal component analysis
. x is the p dimensional variables, where U is an orthogonal matrix. 1. The loading of matrix U and vector Z( ) ,
which correspond to the variance and vector of the principal components respectively.
2. The value represents the contribution ratio which indicates how much percentage the principal component represents of the total tendency of the variables.
3. Usually, an accumulative contribution ratio of 70 - 80 percent can effectively represent the major variations in the original data.
xUy '
jjj yz

21
Factor Analysis: PCA vs FA
Direction is reversed: the measured responses are based on the underlying factors while in PCA the principal components are based on the measured responses

22
Factor Analysis: Factor Rotation
For identify some variables having similar factor loading, we could rotate the factor coordinates in any direction without changing the relative locations of the points to each other.

23
Experiment: Scatter of Raw Data
kinaseaspartatedehydrogena
selymphopeniachestdyspneacoughmalaisefever
feve
rm
alai
seco
ugh
dysp
nea
ches
tly
mph
open
iade
hydr
ogen
ase
aspa
rtat
eki
nase
Gravities of components are deviated by the noise or outliers.

24
Experiment: Scatter After Clustering
Collected data can represent the pattern of the disease more accurately.
kinaseaspartatedehydrogena
selymphopeniachestdyspneacoughmalaisefever
feve
rm
alai
seco
ugh
dysp
nea
ches
tly
mph
open
iade
hydr
ogen
ase
aspa
rtat
eki
nase

25
Experiment: KMO and Bartlett’s Test
KMO test indicates the possibility of containing underlying factors. KMO < .50, factor analysis is not useful.
Bartlett's test indicate whether variables are unrelated. significance level < .05 significant relationships
Kaiser-Meyer-Olkin Measure of Sampling Adequacy.
.608
Bartlett's Test of Sphericity
Approx. Chi-Square 191.238
df 36
Sig. .000

26
Experiment: PCA Model
Initial Eigenvalues Sums of Squared Loadings
Total % of Variance Cumulative % Total % Variance Cumulative %
1 2.581 28.679 28.679 2.581 28.679 28.679
2 2.024 22.485 51.163 2.024 22.485 51.163
3 1.096 12.179 63.342 1.096 12.179 63.342
4 .902 10.022 73.365
5 .825 9.168 82.533
6 .644 7.153 89.686
7 .465 5.171 94.858
8 .249 2.770 97.627
9 .214 2.373 100.0
Accumulative contribution ratio = 63%

27
Experiment: PCA Model
It denotes that variables could be divided into 3 factors
987654321
Component Number
3.0
2.5
2.0
1.5
1.0
0.5
0.0
Eig
enva
lue

28
Experiment: Results
Factors
1 2 3
fever -.079 -.121 .600
malaise -.474 .487 -.035
cough -.054 -.164 .653
dyspnea .289 .868 -.037
chest .120 .290 .613
lymphopenia -.252 .813 -.095
dehydrogenase .857 .146 -.127
aspartate .861 -.014 -.014
kinase -.649 .121 -.035

29
Experiment: Results after rotation
Factors
1 2 3
fever -.082 -.275 .547
malaise -.551 .398 -.039
cough -.053 -.324 .590
dyspnea .132 .886 -.190
chest .040 .148 .672
lymphopenia -.388 .760 -.075
dehydrogenase .823 .309 -.016
aspartate .849 -.130 -.056
kinase -.658 .019 -.061

30
Experiment: Constructed fuzzy signature
Hierarchical clustering or K-means can be used to cluster each factor
Weighted aggregation method in this fuzzy signature had higher performance 3 weights & 3
aggregations
malaise
kinaseasedehydrogen
aspartate
alymphopeni
dyspnea
chest
cough
fever

31
Experiment: Possible rule bases
Aggregations: Min (fever, cough, chest) Min (dyspnes, lymphopenia) Max (Min (kinase, malaise), Min(aspartate, de
hydrogenase) )
Rules If a patient has fever, cough and chest. If a patient has dyspnes and lymphopenia. If patient has kinase and malaise or has aspart
ate and dehydrogenase

32
Experiment: Possible rule bases
Further assumption: If a patient has fever, cough and chest, he/sh
e would has 64% possibility to get SARS If he/she has kinase and malaise or has aspa
rtate and dehydrogenase simultaneously, the possibility is increasing to 93%
If he/she has dyspnes and lymphopenia, he/she can be diagnosed as a SARS Patient

33
Conclusion
Advantages:1. Fuzzy signatures are capable of improving
the applicability of fuzzy systems.
2. Fuzzy signatures have the ability to cope with complex structured data and interdependent features problems.
3. With weighted aggregated, fuzzy signatures can assist experts to make decision by removing redundant information

34
Further Work
Further research can be focused on evaluating underlying relationships between the structures of fuzzy signatures, aggregation functions and weights of each vector.

35
Thank you
---- Bai Qifeng

36
Appendix
Demo of Fuzzy Control Sparse Fuzzy System Automatic Constructing Fuzzy Signature Fuzzy c-Means

37
Fuzzy Control
Fuzzy control is the most important current application in fuzzy theory.
Usually, three steps in Fuzzy control:
1. Fuzzification
2. Rule evaluation
3. Defuzzification

38
Demo of Fuzzy Control
The most common one is the centre of gravity

39
Demo of Fuzzy Control
Use a procedure originated by Ebrahim Mamdani as demo. The application is to balance a pole on a mobile platform that can move
in only two direction, to the left or the right. The angle between the platform and the pendulum and the angular velocity of this angle are chosen as the inputs of the system. Output is corresponding to the speed of the platform.

40
Fuzzification
First of all, the different levels of input and output are defined by specifying the membership functions for the fuzzy sets.
For similarity, it is assumed that all membership functions are spread equally. Hence, this explains why no actual scale is included in the graphs

41
Fuzzification
Input Angel
Input Angel Velocity
Output Speed

42
Rule Evaluation
The next step is to define the fuzzy rules. The fuzzy rules are a series of if-then statements.
For example: If angle is zero and angular velocity is zero
then speed is also zero.
If angle is zero and angular velocity is low
then the speed shall be low.

43
Rule Evaluation
The full set of rules are listed in table
Speed AngleNeg. high Neg. Low Zero Pos. Low Pos. High
V Neg. High Neg. High
E Neg. Low Neg. Low Zero
L Zero Neg. High Neg. Low Zero Pos. Low Pos. High
O Pos. Low Zero Pos. Low
C Pos. High Pos. High

44
Rule Evaluation
Suppose an example has 1. 0.75 and 0.25 for zero and positive low angles
2. 0.4 and 0.6 for zero and negative low angular velocities.

45
Rule Evaluation
Consider the rule
"if angle is zero and angular velocity is zero, the speed is zero".

46
Rule Evaluation
Consider the rule
"if angle is zero and angular velocity is negative low, the speed is negative low".

47
Rule Evaluation
Consider the rule
"if angle is positive low and angular velocity is zero, the speed is positive low".

48
Rule Evaluation
The Results overlap and are reduced to the following figure

49
Defuzzification
Defuzzification is used to choose an appropriate representative value as the final output.
The most common one is the centre of gravity

50
Sparse Fuzzy Systems
Sparse fuzzy systems can be used in situations where full knowledge of the problem domain is not available. Problem domain experts often work with only important fuzzy rules.
Self learning algorithms to tune the parameters of a fuzzy system for accuracy improvement can also lead to sparse fuzzy systems.
In most cases, parameter tuning involves the reshaping of the fuzzy sets in the rule antecedents. It can happen that the shrinking of the fuzzy sets leads to gaps between neighboring fuzzy sets.
Generating a sparse fuzzy system benefits from the reduced number of rules. (Chong 2004)

51
Sparse Fuzzy Systems
Sparse system can reduce T. The essential idea is based on the omission of less important fuzzy rules to form sparse fuzzy systems.
In sparse systems, it would be possible that inputs do not match any of the rule antecedents.
Fuzzy rule interpolation is used to infer these rules for the inputs from existing fuzzy rules in the system.

52
Interpolation overview
Tomato colours: back
IF colour = Red THEN it is Ripe
IF colour = Green THEN it is Unripe What about a yellow tomato? Potential tomato colours:

53
Automatic Construct Fuzzy Signature
Sub-Structure may be hidden in large data set.
More separable the elements in subspace, the easier sub-rule base selection is.
Finding suitable Π and Z0 affect each other.
54
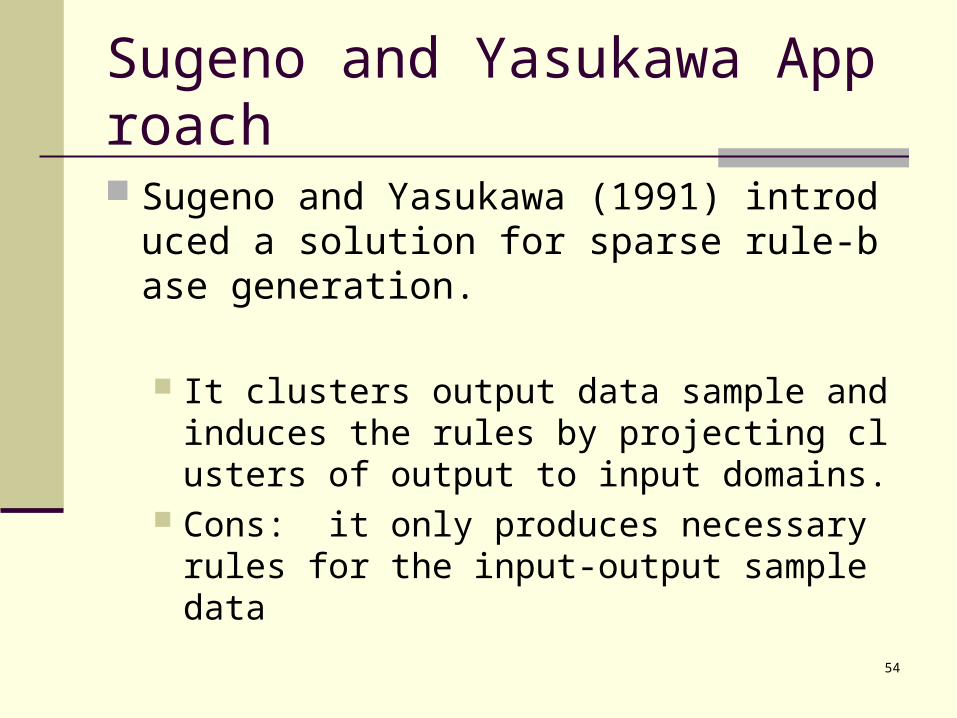
Sugeno and Yasukawa Approach
Sugeno and Yasukawa (1991) introduced a solution for sparse rule-base generation.
It clusters output data sample and induces the
rules by projecting clusters of output to input domains.
Cons: it only produces necessary rules for the input-output sample data

55
Projection-based Fuzzy Rule Extraction
1. Perform c-Means to cluster data along output space. The FS index of Fuzzy c-Means can be used to get a optimal number of clusters.
2. For each fuzzy output cluster, all points contained in the cluster are projected back to input dimensions.
3. The projected points in each dimension are clustered again. In this procedure, the FS index is used in conjunction with the merging index. This process will produce multiple fuzzy clusters in each dimension.
4. Each of the clusters in the input dimension is a projection of the multi-dimensional input cluster to that input dimension. Then, the clusters from the individual dimensions are combined to form the multi-dimensional input cluster.
5. For each of the multi-dimensional clusters identified, a rule can be created.

56
Fuzzy c-Means
Let as a fuzzy partition C
cnc
n
n
ncU
1
221
11211
),.....,( 121 c

57
Fuzzy c-Means
Dunn defined a fuzzy objective function:
vi is cluster center of i set
Bezdek extended it to:
represents the deviation of data with . The
number m governs the influence of membership grades.
c
i
n
jijijD vxVUJ
1 1
22,
c
i
n
jij
mijm mvxXVUJ
1 1
21,;,
2ik vx

58
Fuzzy c-Means
Limitation: it needs to know the number of clusters.
How to find an optimal number of clusters.
A cluster validity index proposed by Fukuyama and Sugeno (FS):
ncxvvxUSc
i
n
jiik
mijc
1 1
22)( 2),(

59
Finding Suitable Subspace
Rules: age & experience to salary
IF Age = young & Exp = Little Then $ =Low
IF Age = young & Exp = Moderate Then $ =Low
IF Age = young & Exp = Good Then $ =High
IF Age = Middle & Exp = Little Then $ =Low
IF Age = Middle & Exp = Moderate Then $ =Ave
IF Age = Middle & Exp = Good Then $ =High
IF Age = Older & Exp = Little Then $ =Ave
IF Age = Older & Exp = Moderate Then $ =Ave
IF Age = Older & Exp = Good Then $ =High

60
Finding Suitable Subspace
Rule in a tree (Age/Exp/Con)
Age
Exp
Y M O
lM
G
L L H L A H A A H
Age
Exp
Y M O
G
L H L A H A H
Prune tree

61
Finding Suitable Subspace
Rule in a tree (Exp/Age/Con) back
Age
Exp
Y
M
O
l
M
G
L L A L A A H H H
Age
ExpM
O
l
M
G
L A L A H
Prune rule tree

62
Fuzzy Signatures in SARS Diagnosis
The following scheme is of some daily symptom signatures of patients:
Sore
Nauseapm
amCough
pm
pm
pm
am
fever
AS
9
128
4
12
8

63
Fuzzy Signatures in SARS Diagnosis
Two examples with linguistic values and fuzzy signatures.
25.0
25.0
5.02.0
2.0
0.0
0.0
1
slight
slight
normalslight
slight
none
none
A
0
25.09.0
7.04.0
4.0
2
none
slightsevere
highmoderate
moderate
A

64
Fuzzy Signatures in SARS Diagnosis
An aggregation method can compare components regardless of the different numbers of sub-components.
25.0
25.05.0
5.02.0
1 fA
0
25.08.0
6.04.0
2 fA

65
Fuzzy Signatures in SARS Diagnosis
Aggregation methods for different symptoms here are different with that of signatures of same symptoms.
Here, we define weights are:
fever = 1, Cough = 0.9, Nausea = 0.4, Sore = 0.25
back
4.0,25.0 21 oo AA