1 climate change impacts and adaptation: an international perspective chris field carnegie...
TRANSCRIPT

1
Climate changeimpacts and adaptation:
An international perspective
Chris Field
Carnegie Institution: Department of Global Ecologywww.global-ecology.org

2
• Evolving perspectives on impacts
• Developing concepts on the role of the IPCC
• Adaptation in the response portfolio
3
IPCC AR4 - 2007
• Hundreds of top scientists
• Comprehensive assessment
• Multi-stage, broad-based, monitored review
• Plenary approval line-by-line, by
governments

4
Findings of the AR4• Warming is unequivocal
• Most warming over last 50 years very likely due to human influences
5
Findings of the AR4: 2
• Warming will continue
• “No policy” range for 2100– Lowest scenario: 1.1-2.9˚C– Highest scenario: 2.0-5.4˚C
WG1 SPM p13

6
Findings of the AR4: 3
• Damages from climate change– $3 to $95 per ton CO2
• 2030 costs of CO2 stabilization– 3% of GDP to a net benefit for GDP
WG3 SPM p11

7
• “Anthropogenic warming and sea level rise would continue for centuries due to the time scales associated with climate processes and feedbacks, even if greenhouse gas concentrations were to be stabilised.”
WG1 SPM p 16
Findings of the AR4: 4

8
• Wide range of documented impacts
• Vast regional variation
• Vulnerability linked to poverty, health,
institutions, governance
Findings of the AR4
9
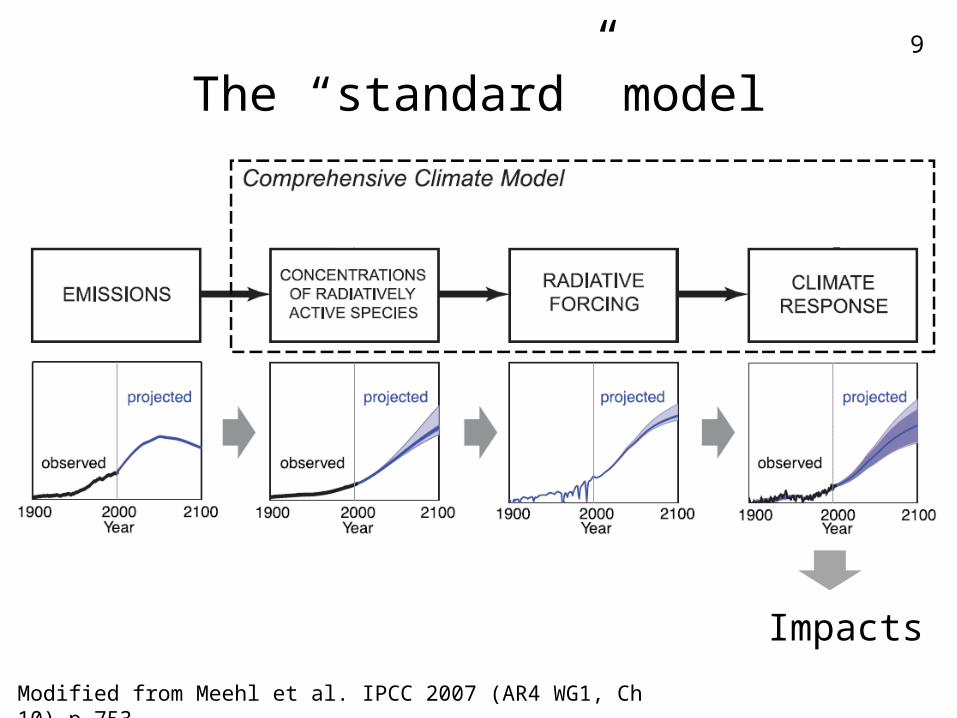
The “standard” model
Impacts
Modified from Meehl et al. IPCC 2007 (AR4 WG1, Ch 10) p 753
10
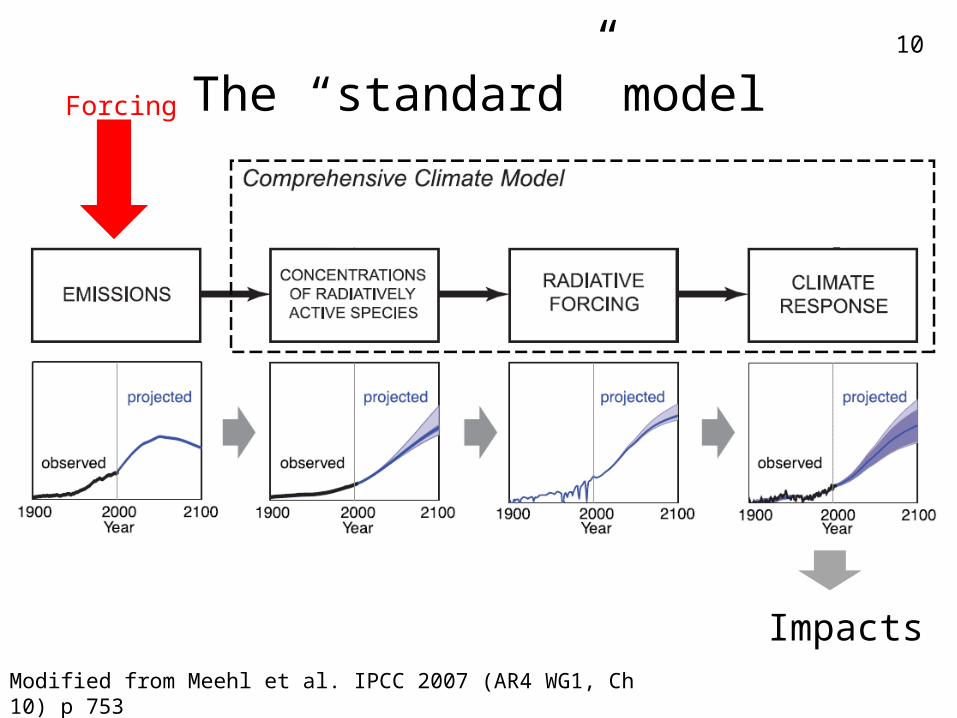
The “standard” model
Impacts
Forcing
Modified from Meehl et al. IPCC 2007 (AR4 WG1, Ch 10) p 753

11
The “revised” model
Impacts
Feedbacks
Modified from Meehl et al. IPCC 2007 (AR4 WG1, Ch 10) p 753

12
Forcing
How do actual emissions compare with the scenarios explored in the IPCC AR4?

13
Based on IPCC Special Report on Emissions Scenarios, 2000
Fossil intensive, industrialized
Advanced technology, industrialized
Diversified, local solutions

14Anthropogenic C Emissions: Fossil Fuel
Raupach et al. 2007, PNAS; Canadell et al 2007, PNAS, updated at http://www.globalcarbonproject.org/carbontrends/index.htm
1990 - 1999: 0.9% y-1
2000 - 2007: 3.5% y-1
0
1
2
3
4
5
6
7
8
9
1850 1870 1890 1910 1930 1950 1970 1990 2010
Fo
ssil
Fu
el E
mis
sio
n (
GtC
/y) Emissions
280
300
320
340
360
380
400
1850 1870 1890 1910 1930 1950 1970 1990 2010
1850 1870 1890 1910 1930 1950 1970 1990 2010
2007 Fossil Fuel: 8.5 Pg C[Total Anthrop.Emis.:8.5+1.5 = 10.0 Pg]

15
Raupach et al. 2007 PNAS
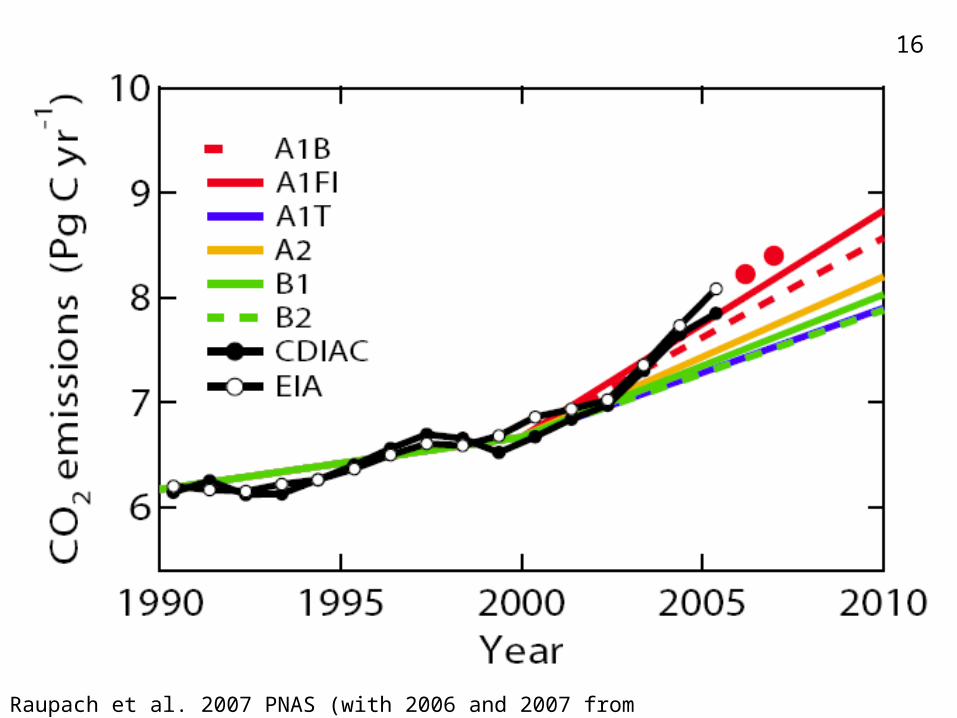
16
Raupach et al. 2007 PNAS (with 2006 and 2007 from CDIAC)

17
Finding the mechanism
Carbo
n int
ensit
y
Of eco
nom
ic ac
tivity
Per ca
pita
GDP
Popula
tion
size

18Anthropogenic C Emissions: Carbon Intensity of GDP
Raupach et al. Biogeosciences 2008
Fac
tor
(rel
ativ
e to
198
0)
World, including 2006
EmissionsPopulationWealth = per capita GDPCarbon intensity of DGP

19
Forcing
• Recent emissions were at or above the trajectory of the full range explored in the AR4
• High recent emissions mostly due to rapid economic growth
• Climate on a trajectory that has not been explored
20
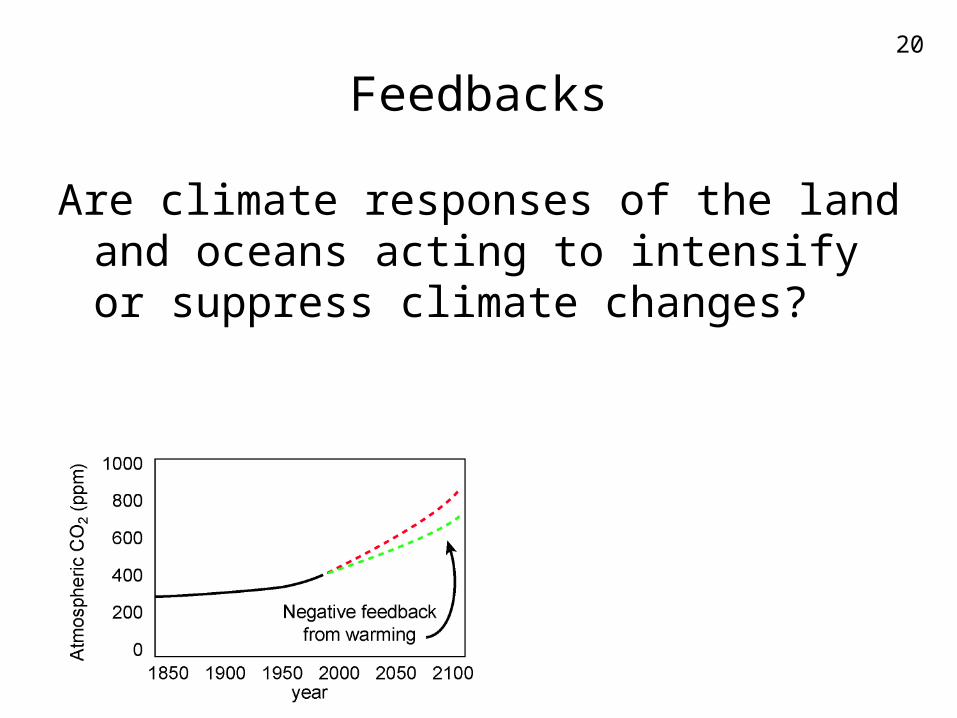
Feedbacks
Are climate responses of the land and oceans acting to intensify or suppress climate changes?
21
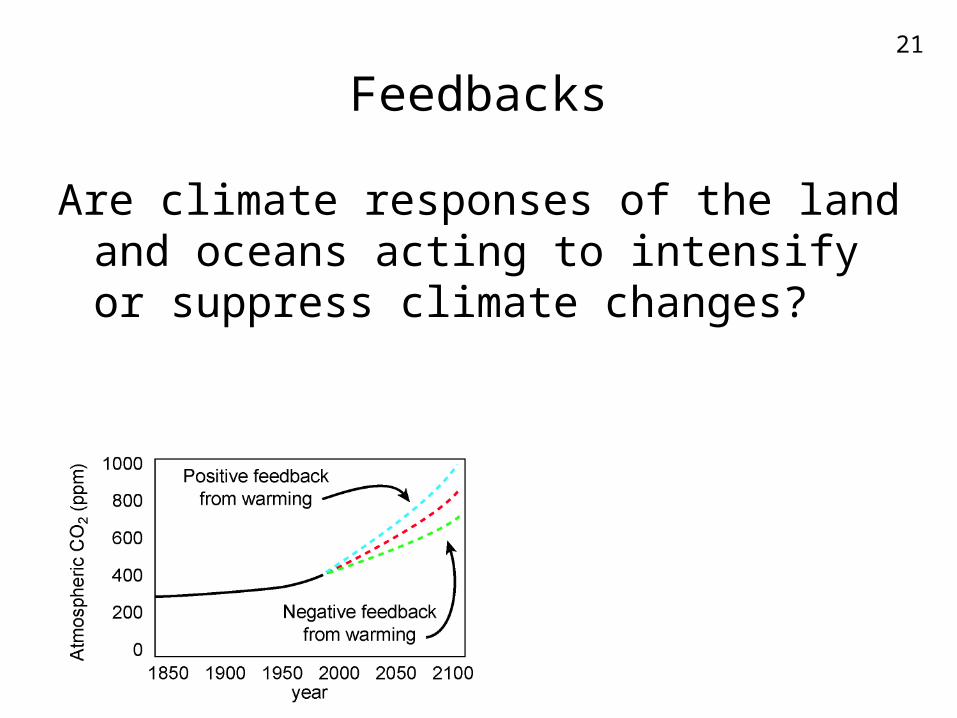
Feedbacks
Are climate responses of the land and oceans acting to intensify or suppress climate changes?

22
Feedbacks
Are climate responses of the land and oceans acting to intensify or suppress climate changes?
23
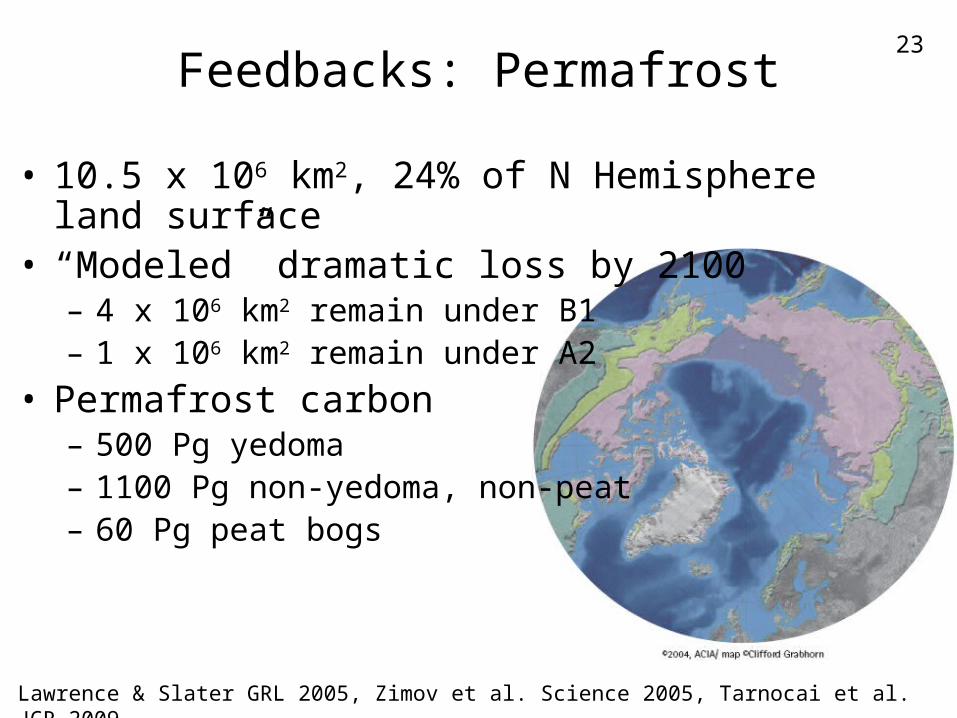
Feedbacks: Permafrost
• 10.5 x 10⁶ km2, 24% of N Hemisphere land surface
• “Modeled” dramatic loss by 2100– 4 x 10⁶ km2 remain under B1– 1 x 10⁶ km2 remain under A2
• Permafrost carbon– 500 Pg yedoma– 1100 Pg non-yedoma, non-peat– 60 Pg peat bogs
Lawrence & Slater GRL 2005, Zimov et al. Science 2005, Tarnocai et al. JGR 2009

24Feedbacks: Permafrost
• Yedoma sediments– Pleistocene roots– Highly
decomposable– Deep exposure
from thermokarst erosion
– Up to 30% released as CH4
Zimov et al. Science 2006, Walter et al. Science 2006, Schuur et al. BioScience 2008

25
Feedbacks
• Dynamic coupling between climate and permafrost carbon cycle not included in AR4 results
26
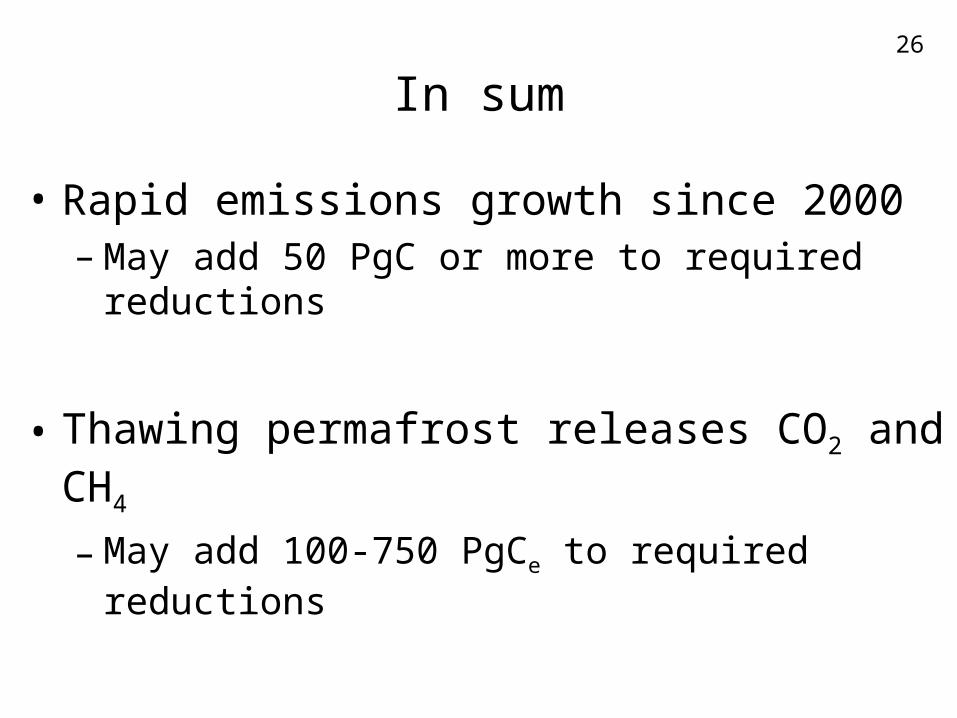
In sum
• Rapid emissions growth since 2000– May add 50 PgC or more to required
reductions
• Thawing permafrost releases CO2 and CH4
– May add 100-750 PgCe to required reductions
27
Needs for adaptation
• Climate change continues, even if CO2 emissions stabilize
• Lack of progress in limiting emissions• Continued skepticism about the costs
of large reductions

28
lists
WG2 in the AR5:Beyond lists

29Table TS.3. (lower) Examples of global impacts projected for changes in climate (and sea level and atmospheric CO2 where relevant)
IPCC AR4 WG2 TS

30AR5: Opportunities
• Multi-stressor environment• Risk management
– Supporting good decisions
• Adaptation– Beyond generalities
• Costing– Common framework for impacts,
adaptation, and mitigation
• Take advantage of full range of available knowledge

31
Adaptation in the arc of the IPCC
100% climate-change
100% multi-stress
impact
Early warningProtective structuresActivity shiftingEffective responses
Early warningProtective structures
Activity shiftingEffective responsesWin-win strategies
Multi-stress solutions
AR4
AR5
32

33

34
Mitigation
Adaptation
Adap
tatio
n

35
Core issues for the AR5
• Boundary between adaptation and coping
• Managing short-term responses to avoid long-term maladaption
• Balancing development and sustainability
• Contributing to Millennium Development Goals
• International dimensions

36
International dimensions
• CAM: an adaptation analog to the CDM?
• Perspectives on moving and activity switching?
• Interactions with security and conflict?