1 chapter 2 & 3 simulation examples and general principles
TRANSCRIPT
1
Chapter 2 & 3
Simulation ExamplesandGeneral Principles

2
Basic Steps
Determine the characteristics of the inputs. Usually modeled as probability distributions
Construct a simulation table. Problem specific Often consists of a set of inputs and one of more responses Repetitions
Repeatedly generate a value for each input andevaluate the function.
3
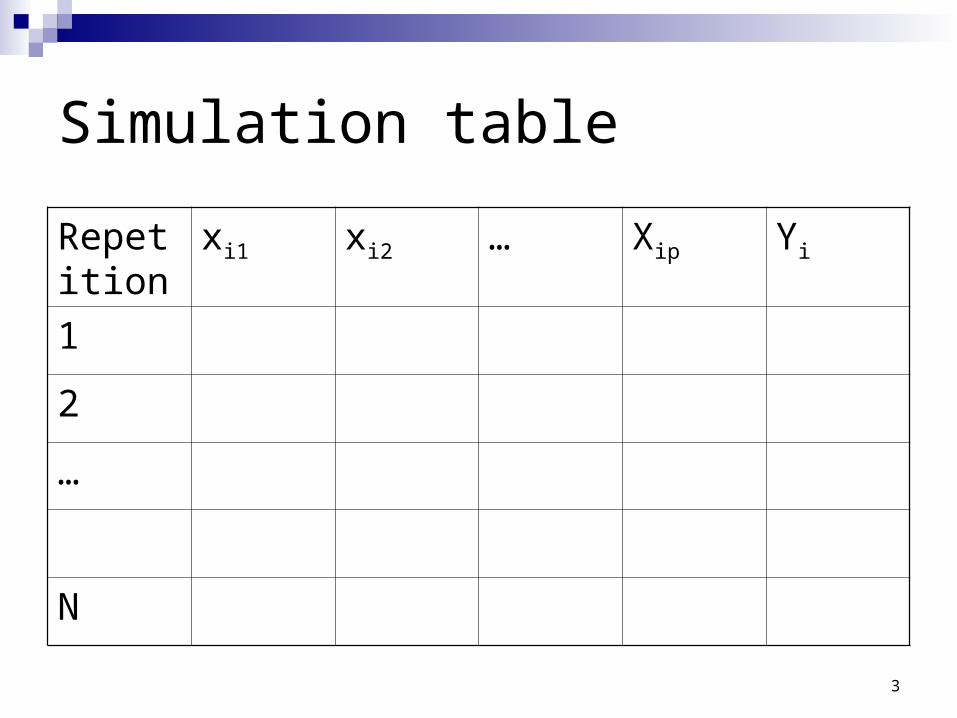
Simulation table
Repetition
xi1 xi2 … Xip Yi
1
2
…
N

4
Simulation Examples and General Principles Simulation examples (chap. 2)
Concrete & specific cases in various areasExample:
1 + 2 + 3 + …. + 100 = ?
General principles (chap. 3)Generalized representations and conceptsExample:
i, n, S
5
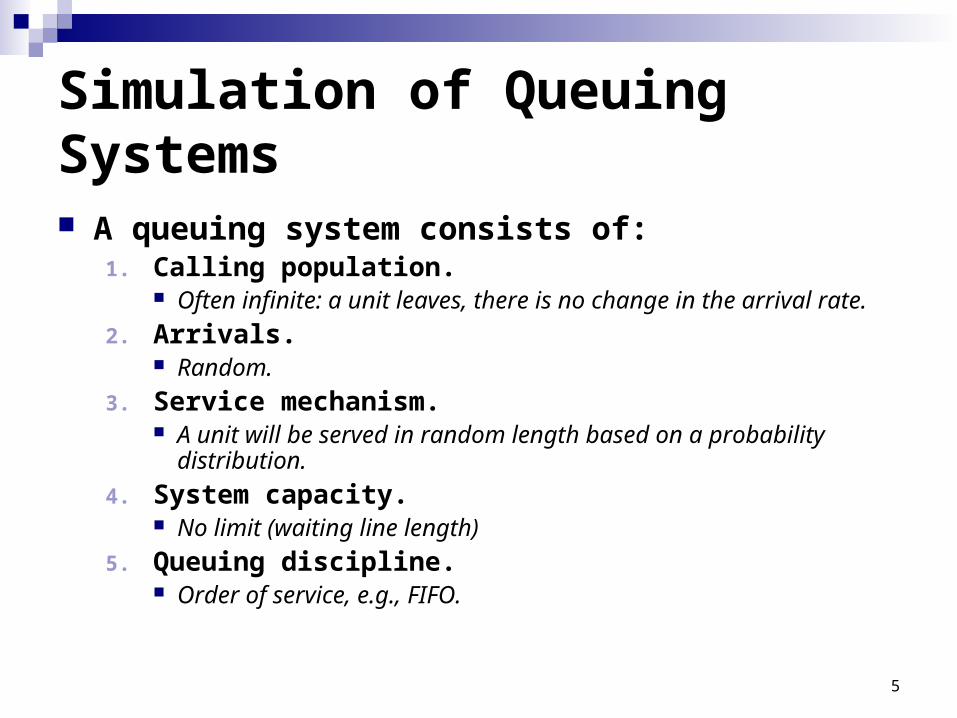
Simulation of Queuing Systems
A queuing system consists of:1. Calling population.
Often infinite: a unit leaves, there is no change in the arrival rate.
2. Arrivals. Random.
3. Service mechanism. A unit will be served in random length based on a probability
distribution.
4. System capacity. No limit (waiting line length)
5. Queuing discipline. Order of service, e.g., FIFO.

6
Simulation of Queuing Systems

7
Queuing Systems
Arrivals and services are defined by the probability distribution of time between arrivals and the distribution of service times, respectively.
Service rate vs. arrival rate Unstable or explosive
State Number of units in a system and status of server
Event Stimulus that causes system state to change.
Simulation clock Trace of simulation time.
8
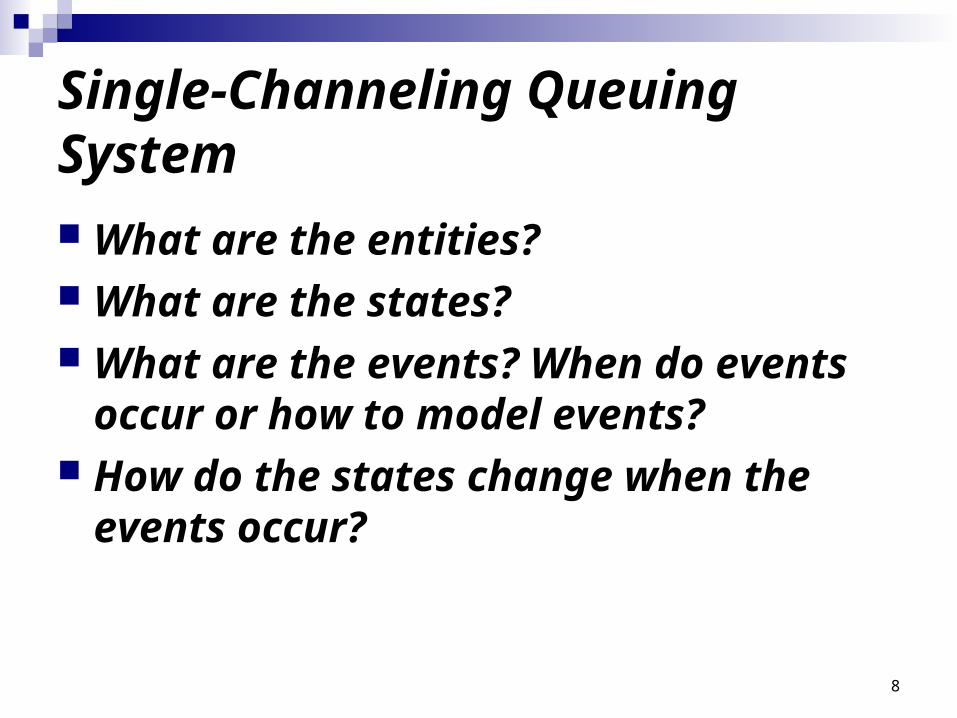
Single-Channeling Queuing System What are the entities? What are the states? What are the events? When do events
occur or how to model events? How do the states change when the
events occur?
9
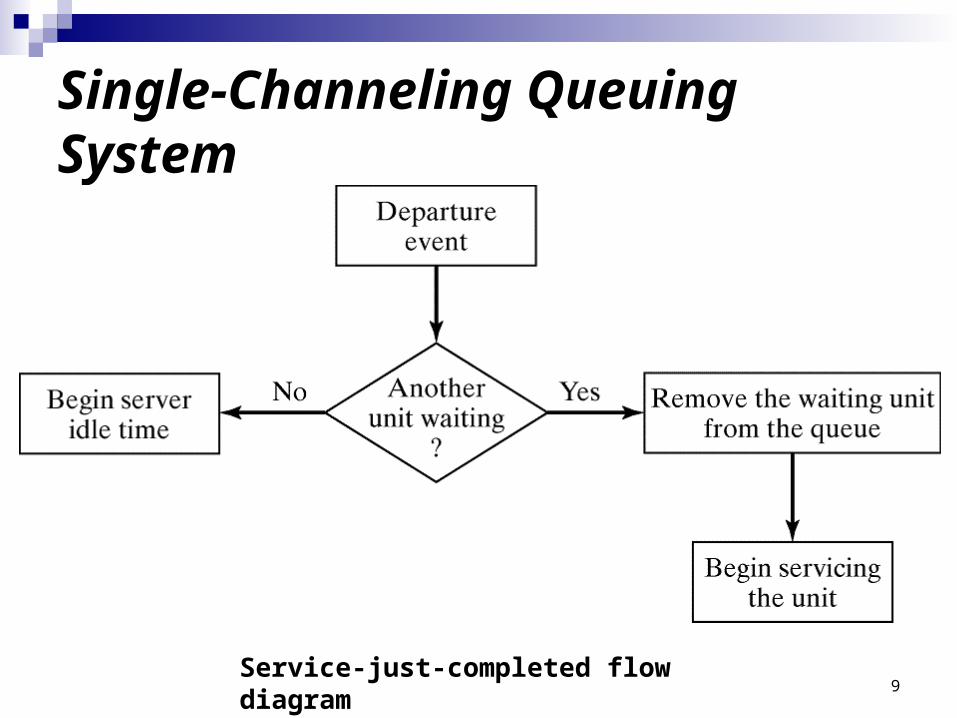
Single-Channeling Queuing System
Service-just-completed flow diagram
10
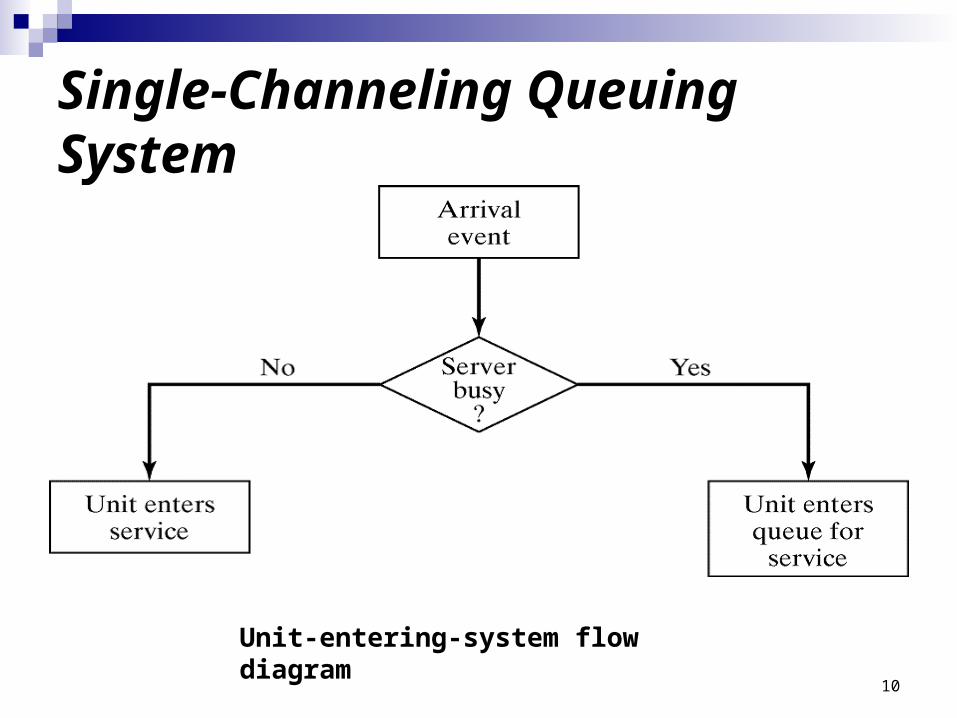
Single-Channeling Queuing System
Unit-entering-system flow diagram

11
Single-Channeling Queuing System
Potential unit actions upon arrival

12
Single-Channeling Queuing System
Server outcomes after service completion

13
Single-Channeling Queuing System
Simulation example:
Consider the following two tables represents the arrivals (interarrival) and service times in a grocery store.

14
Single-Channeling Queuing System
Interarrival and clock times service times
15
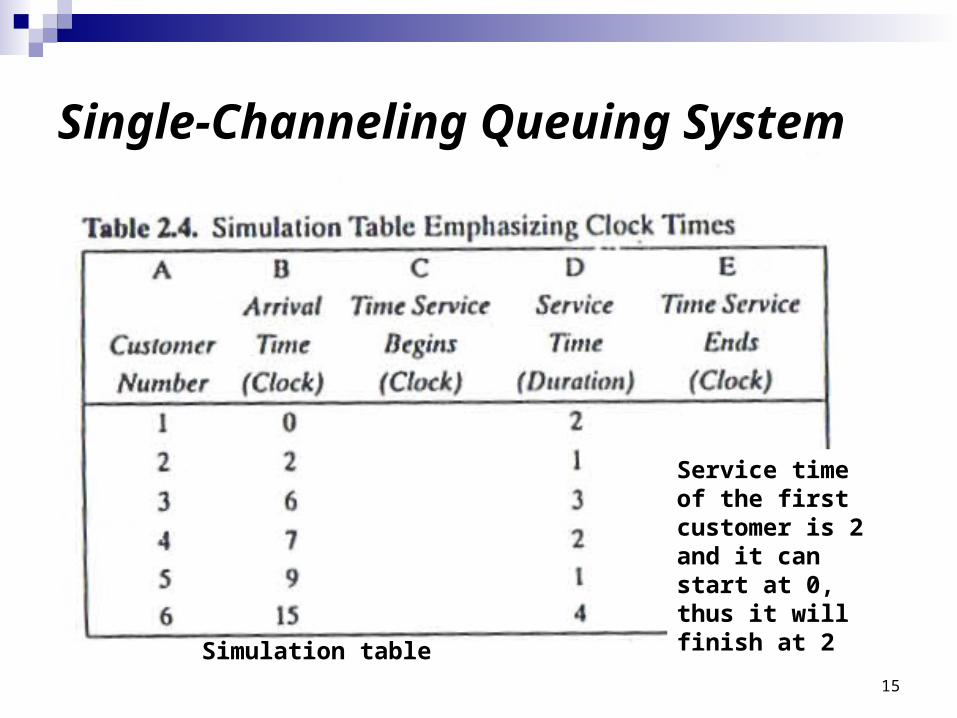
Single-Channeling Queuing System
Simulation table
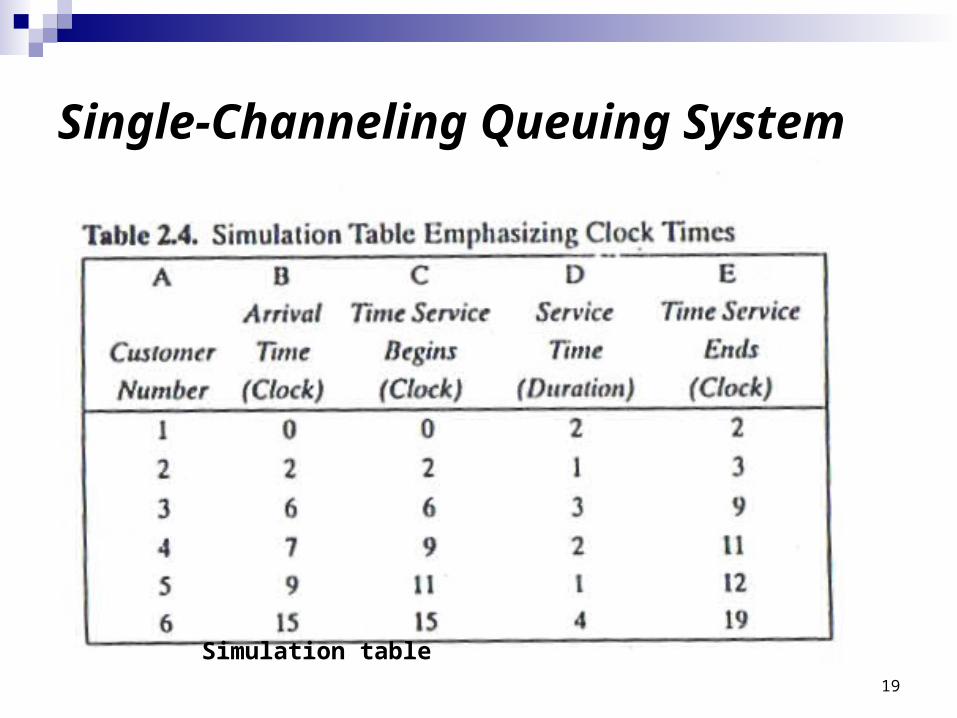
Service time of the first customer is 2 and it can start at 0, thus it will finish at 2

16
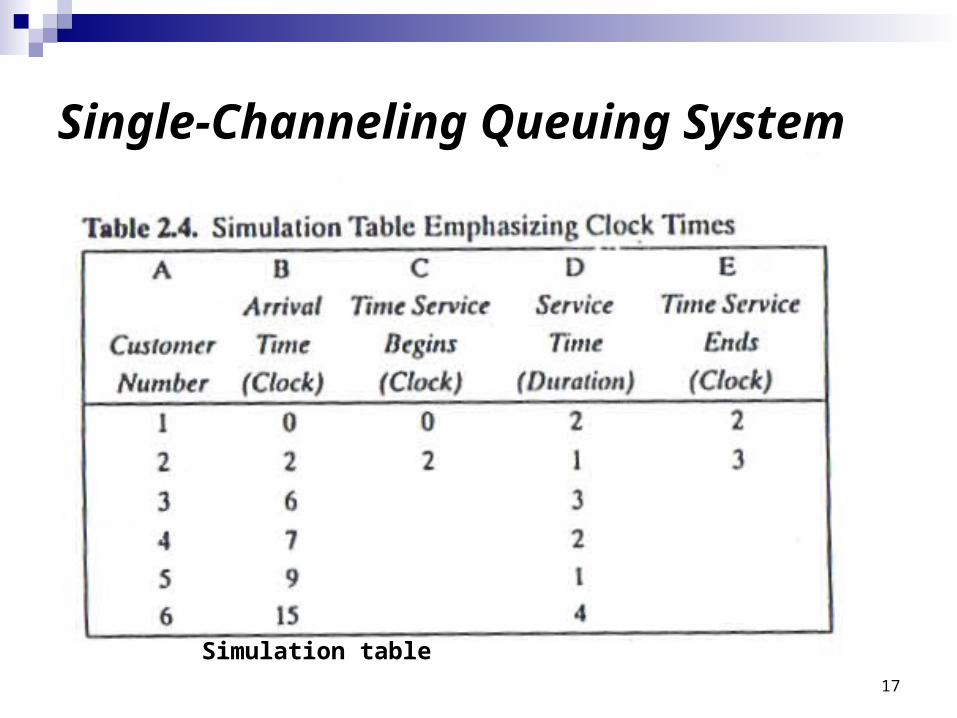
Single-Channeling Queuing System
Simulation table
Service time of the second customer is 1 and it can start at 2, thus it will finish at 3
17
Single-Channeling Queuing System
Simulation table

18
Single-Channeling Queuing System
Simulation table
19
Single-Channeling Queuing System
Simulation table

20
Single-Channeling Queuing System
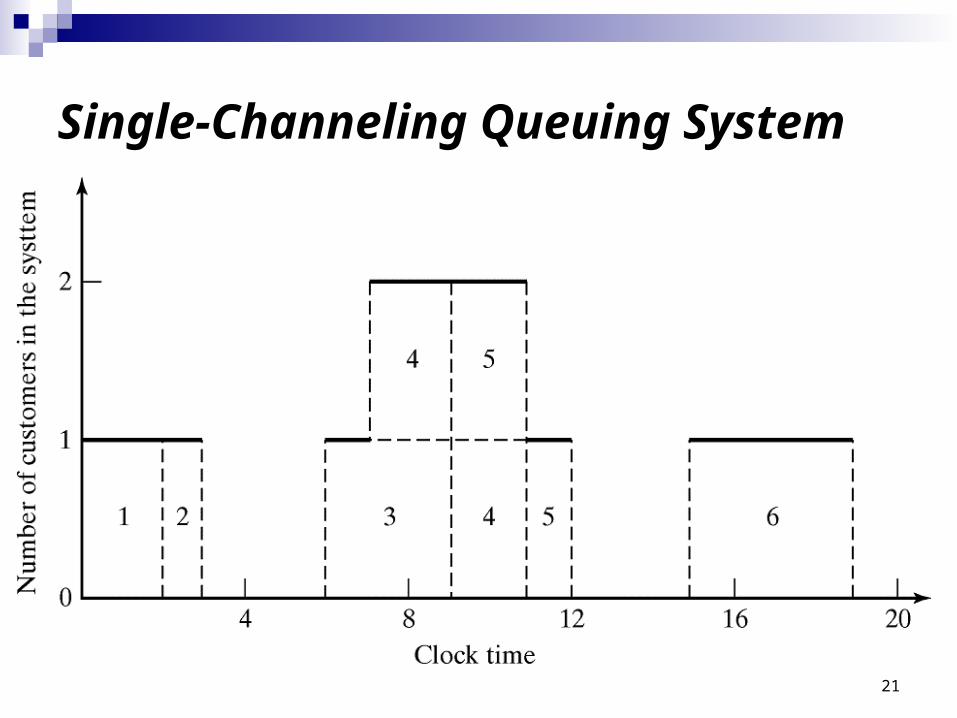
21
Single-Channeling Queuing System

22
Another example (single server)
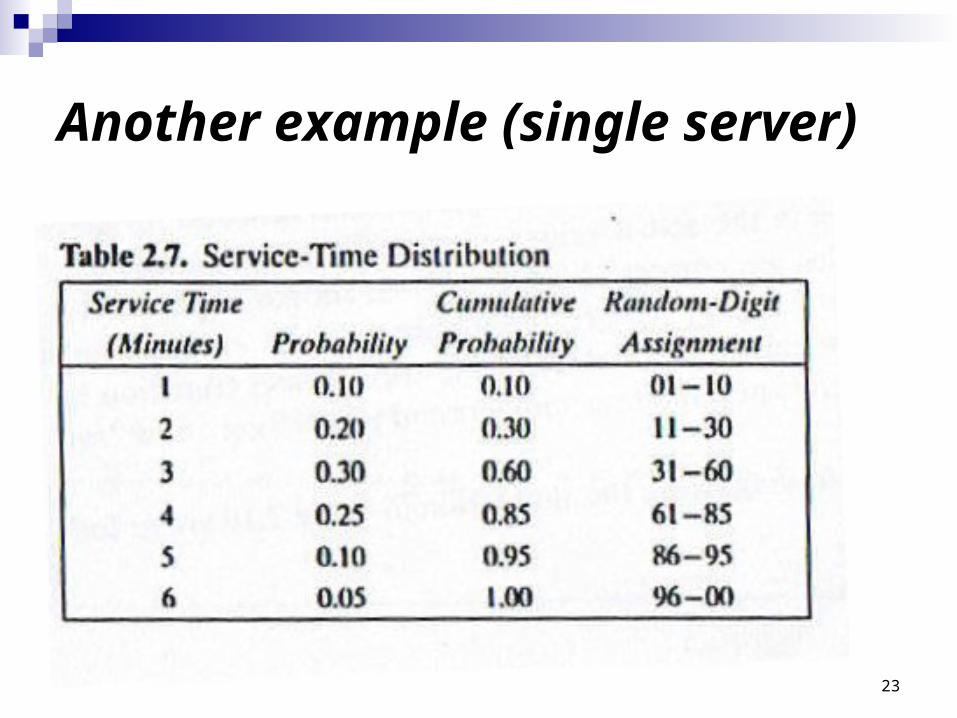
23
Another example (single server)

24
Another example (single server)

25
Another example (single server)

26
Another example (single server)
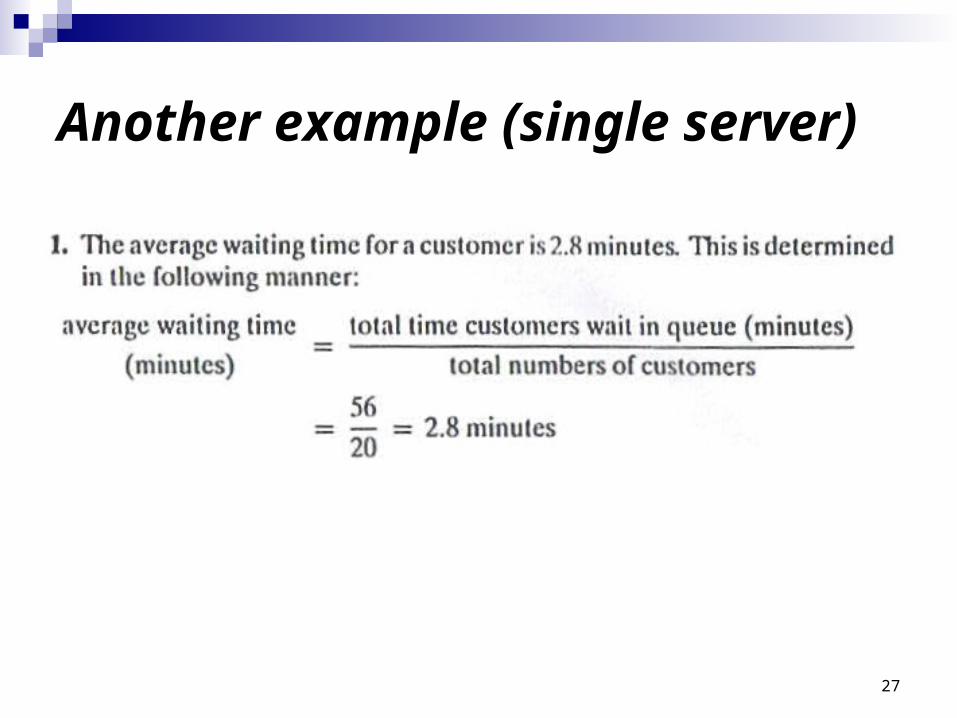
27
Another example (single server)

28

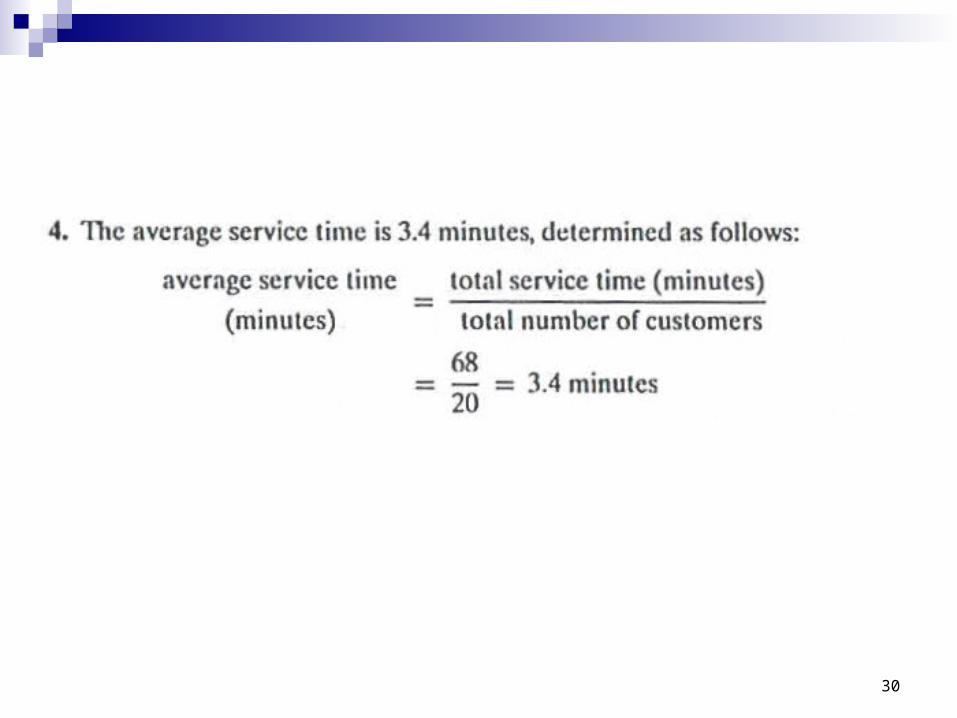
29
30
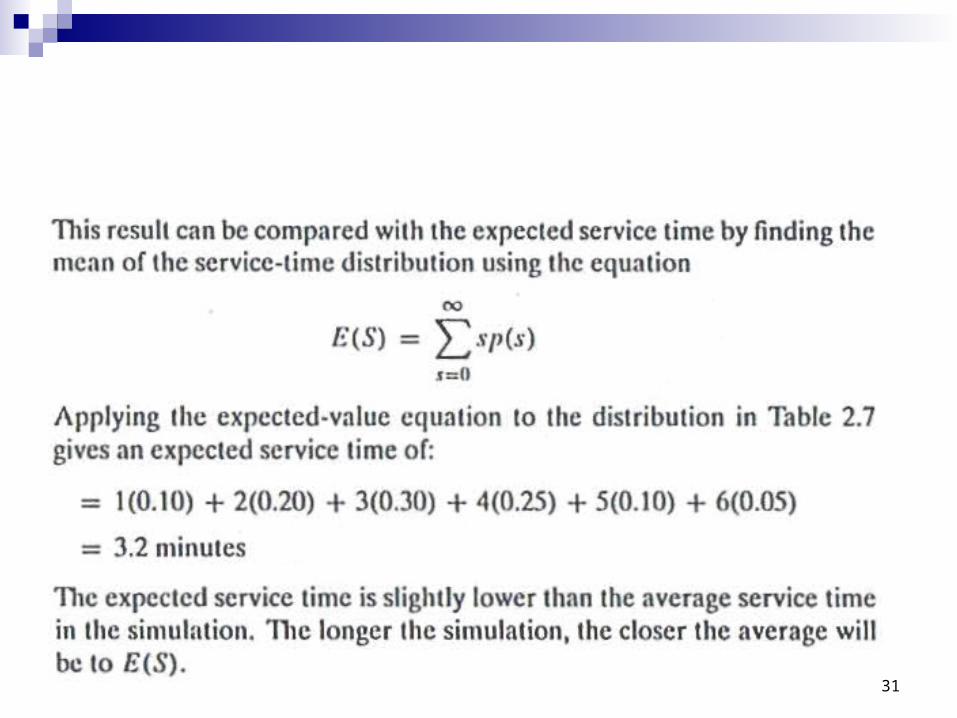
31

32
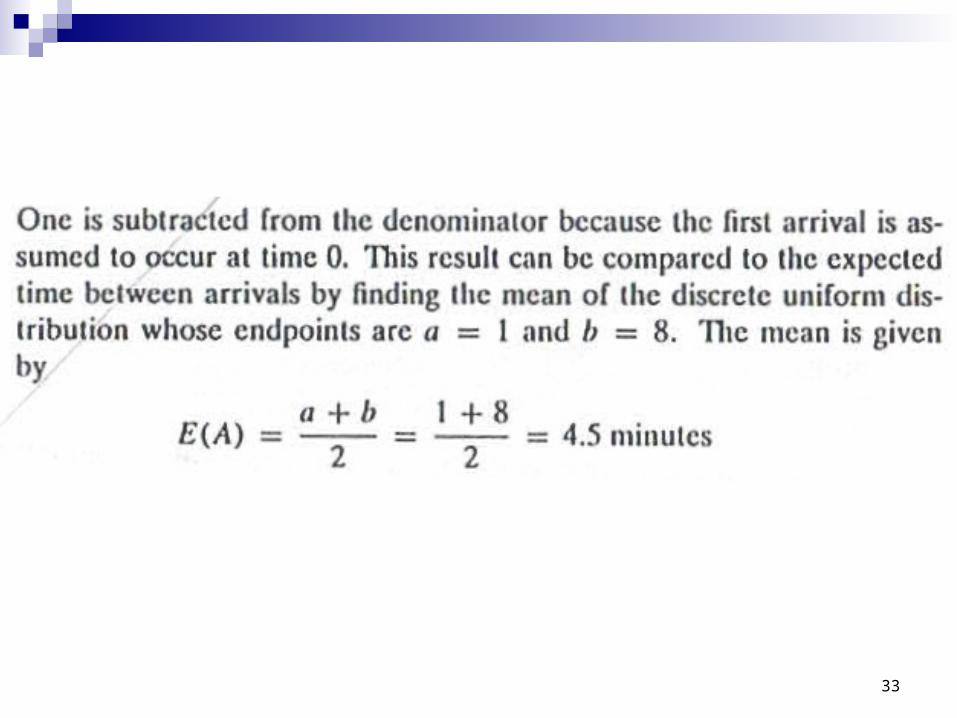
33

34

35

36
37
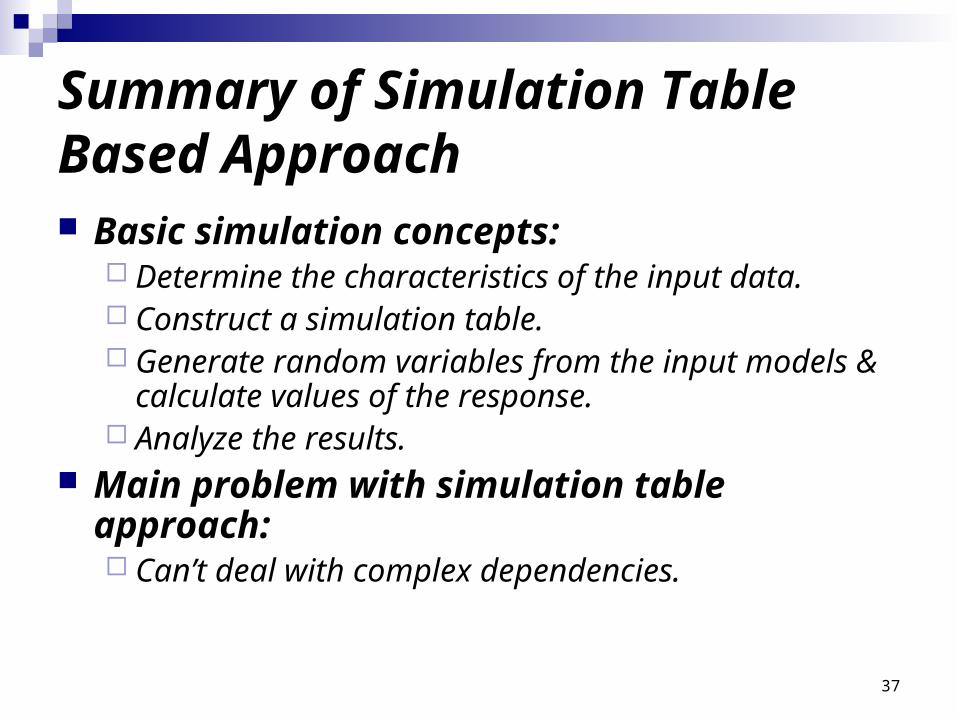
Summary of Simulation Table Based Approach Basic simulation concepts:
Determine the characteristics of the input data. Construct a simulation table. Generate random variables from the input models &
calculate values of the response. Analyze the results.
Main problem with simulation table approach: Can’t deal with complex dependencies.
38
Other Examples
The Able Baker Carhop Problem: Two channels. Inventory Systems
Simulation of an (M, N) inventory system. Reliability Problem
Evaluation of alternatives Military Problem
Random Normal Numbers Lead-Time Demand
Histogram
39
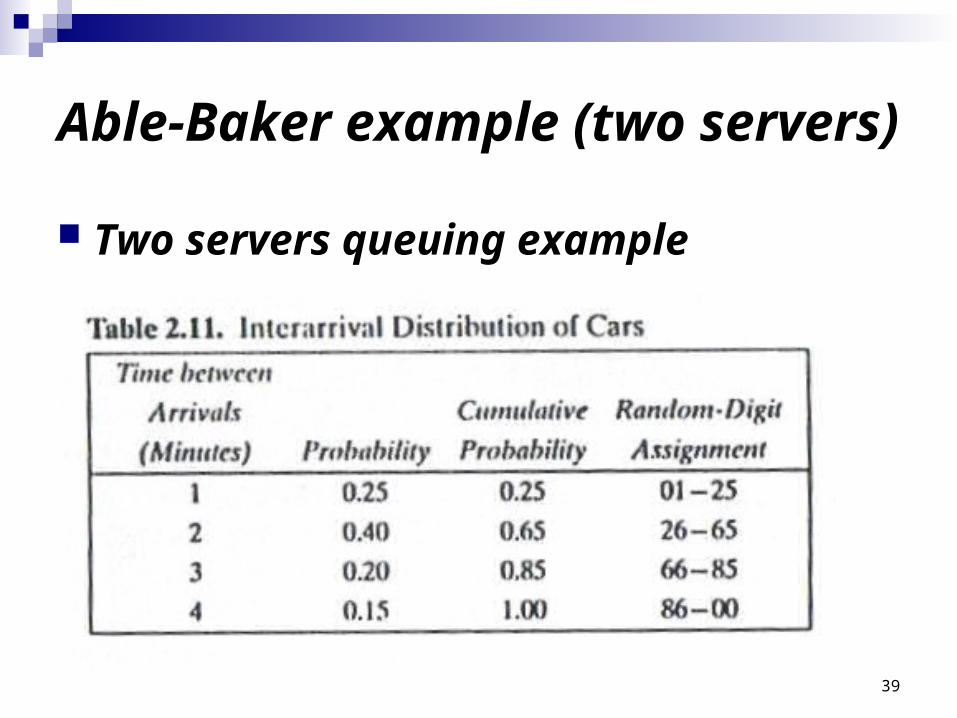
Able-Baker example (two servers) Two servers queuing example

40
Able-Baker example (two servers)

41
Able-Baker example (two servers) We will start using excel to construct the simulation
table for this example. (see www.bcnn.com) Usually the row for first customer is filled manually.
You need a random function to provide random digits (two digits in this case)
Fill in the other values based on the provided tables and these random digits (manually)
Write formulas to fill in the rows (usually) starting from row 2
42
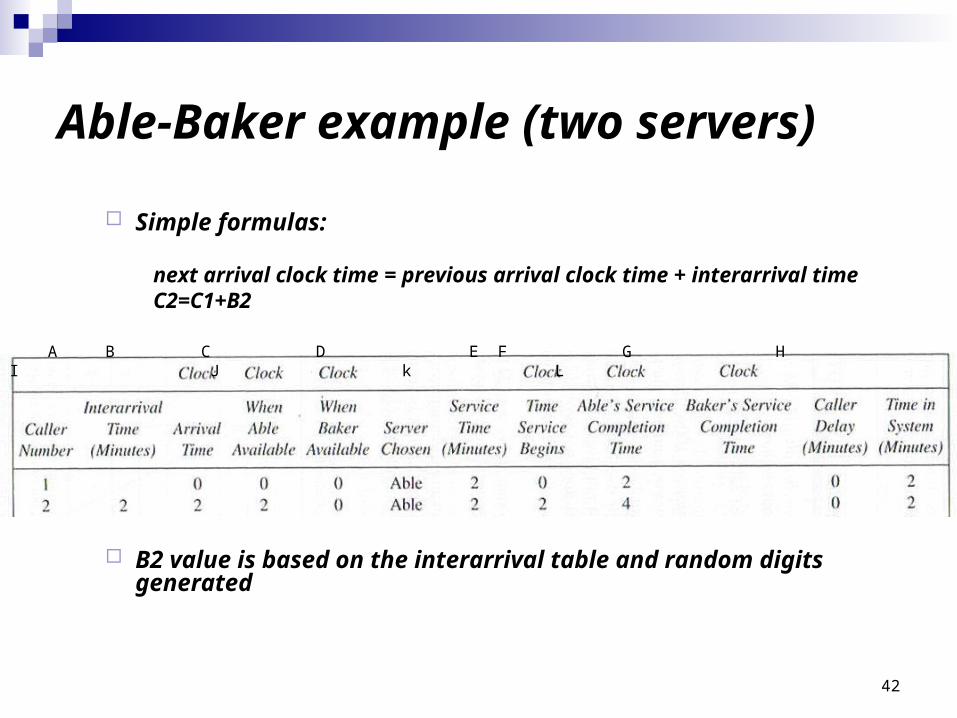
Able-Baker example (two servers)
Simple formulas:
next arrival clock time = previous arrival clock time + interarrival time C2=C1+B2
B2 value is based on the interarrival table and random digits generated
A B C D E F G H I J k L

43
Able-Baker example (two servers)
Simple formulas:
When able available = max number currently in column I
D2=max(I$1:I1)
…
D10=max(I$1:I9)
A B C D E F G H I J k L
44
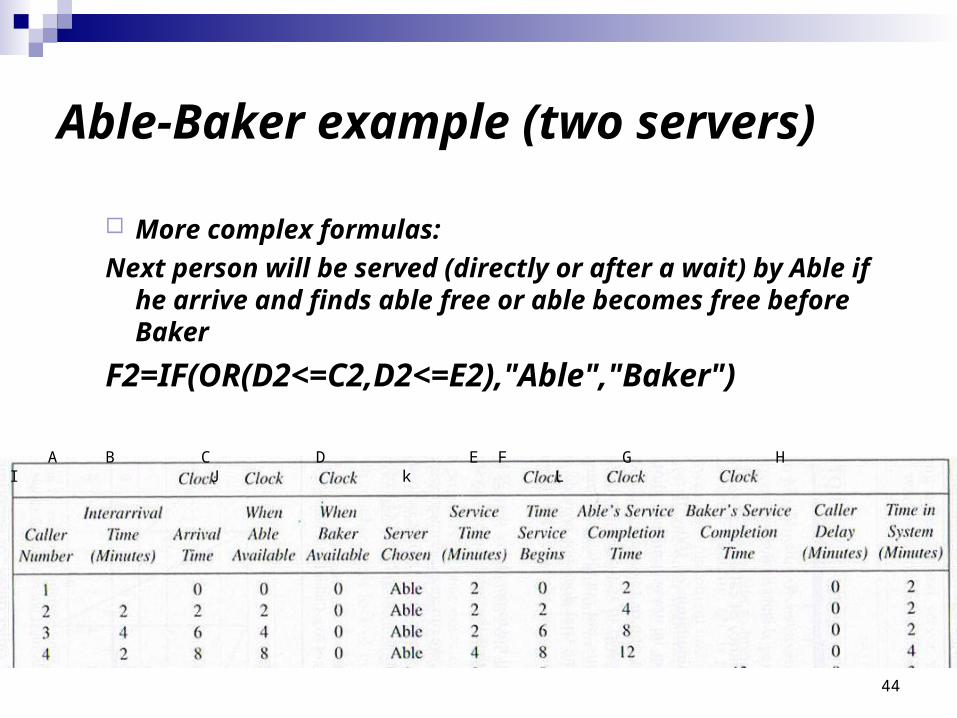
Able-Baker example (two servers)
More complex formulas:
Next person will be served (directly or after a wait) by Able if he arrive and finds able free or able becomes free before Baker
F2=IF(OR(D2<=C2,D2<=E2),"Able","Baker")
A B C D E F G H I J k L

45
Able-Baker example (two servers)
Time service begin: to fill it for Able if he is the intended person
If the server person is Able, then the service will begin at the max of either the arrival or when Able is available.
Else, the service will begin by Baker at the max of the customer arrival time and Baker being available
H2=IF(F2="Able",MAX(D2,C2),MAX(E2,C2))
A B C D E F G H I J k L

46
Able-Baker example (two servers)
The time service is completed by Able
If Able is the person serving, then it will be after service time begin plus service time.
Else, it will be BlankI2=IF($F2="Able",$H2+$G2,"")
A B C D E F G H I J k L

47
Able-Baker example (two servers)
48
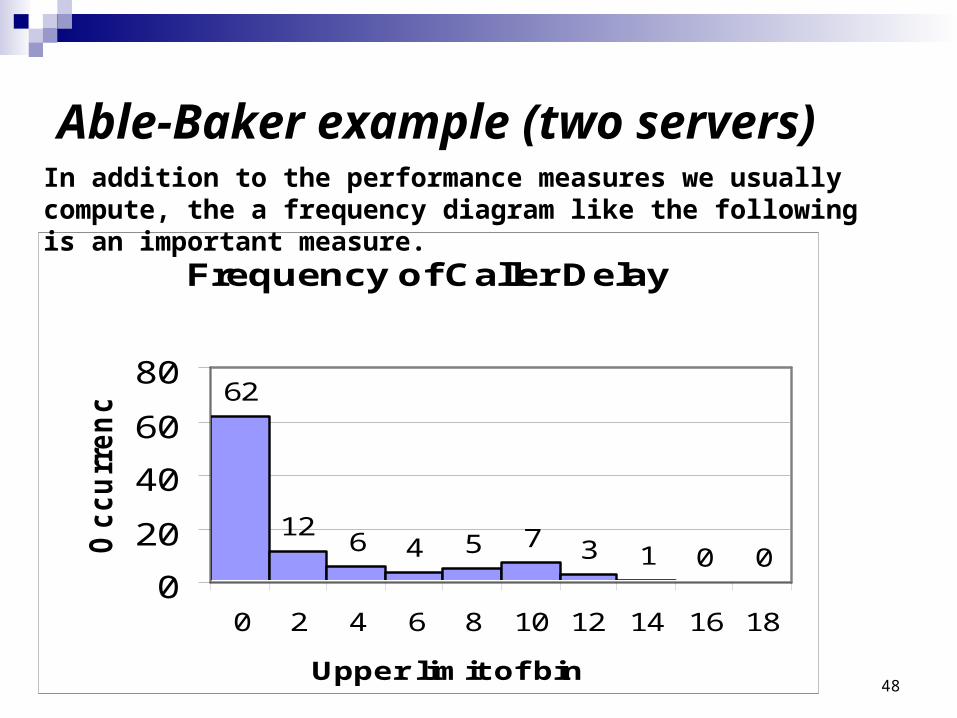
Able-Baker example (two servers)
Frequency of Caller Delay
62
126 4 5 7 3 1 0 0
0
20
40
60
80
0 2 4 6 8 10 12 14 16 18
Upper limit of bin
Occu
rren
ces
In addition to the performance measures we usually compute, the a frequency diagram like the following is an important measure.