1 | cemo standard setting conference 2015© pant, 2015 standard setting: bridging the worlds of...
TRANSCRIPT

1 | CEMO Standard Setting Conference 2015 © Pant, 2015
Standard setting: Bridging the worlds of research and policy makingHans Anand PantHumboldt-Universität zu BerlinFaculty of Humanities and Social SciencesDepartment of Education Studies
Standard-setting:International state of research and practices in
the Nordic countriesThe Centre for Educational Measurement
@ The University of OsloSeptember 21-23, 2015

2 | CEMO Standard Setting Conference 2015 © Pant, 2015
Outline
What this talk will cover
Educational Standards Reform in Germany
Standard Setting: The “German Case”
Multi-Purpose Tests: The Communication Trap
What we would we do next time

3 | CEMO Standard Setting Conference 2015 © Pant, 2015
„Empirical shift“ in education policy due to the „PISA Shock“ in 2001
Need to improve academic performance of students across literacy domains
Need to decrease disparities for ethnic and social groups
Need for stronger focus on output/ outcomes and accountability

4 | CEMO Standard Setting Conference 2015 © Pant, 2015
A shift from an input-based to an output-based quality management in education
State curricula
School books
Intendedcurriculum
Implemented (actual)curriculum
Studentachievement
Effectivecurriculum
Instruction
Input Processes Output (Outcome)
Education policy is within the jurisdiction of the 16 federal states!

5 | CEMO Standard Setting Conference 2015 © Pant, 2015
Enacted in 2003/2004 for core subjects by the Standing Conference of the Ministers of Education (KMK)
Subjects: Mathematics, German language, First Foreign Language (English or French), Sciences (Biology, Chemistry, Physics)
Represent the core elements of knowledge in each subject matter
Implementation is mandatory for all 16 states
Alignment of state-specific curricula and centralized exams with educational standards
Basis of output-orientation: National Educational Standards

6 | CEMO Standard Setting Conference 2015 © Pant, 2015
Educational System in Germany

7 | CEMO Standard Setting Conference 2015 © Pant, 2015
National Educational Standards by Grade Level
Elementary Level
Lower Secondary Level
Upper Secondary Level
Grade 4 Grade 9 Grade 10 Grade 12/13
German
Mathematics
First Foreign Language(English/French)
Science

8 | CEMO Standard Setting Conference 2015 © Pant, 2015
Multiple expectations
Develop a scientifically valid and standards-based assessment system
Provide policy-relevant results on the system level
Provide assessments relevant to teachers and schools

9 | CEMO Standard Setting Conference 2015 © Pant, 2015
Three types of cyclic school achievement tests in Germany
International National State-wide

10 | CEMO Standard Setting Conference 2015 © Pant, 2015
Differences between the three assessments in Germany
International
PISA, PIRLS, TIMSS
National Tests
16-states comparisons
State-wide Testswithin-state
Standards-based tests? No Yes Yes
Data Base Sample-based Sample-based(approx. 40-60,000)
Population-based
Frequency 3 years, 5 years 5-6 years Every year
Main Purpose System monitoring System monitoringSchool & classroom
instruction improvement
Who is accountable? ("High Stakes")
Federal Ministry of Education; 16 State
Ministries of Education
16 State Ministries of Education and their school authorities
Principals, teachers

11 | CEMO Standard Setting Conference 2015 © Pant, 2015
Content standards:State curriculua
Performance standards:
Can-do statementsTest
specifi-cations
(“blue print” for test
developers)
Test(item bank)
Standard setting
(definition of cut
scores)
Test use and
interpret-tations
(intended & actual)
Test impact
Outcome domain
Item domain
Content Domain
Schematic process in large scale assessment
Evidential aspects of validation(procedural, internal, and external aspects)
Consequential aspects of validation
(utility and impact aspects)
12 | CEMO Standard Setting Conference 2015 © Pant, 2015
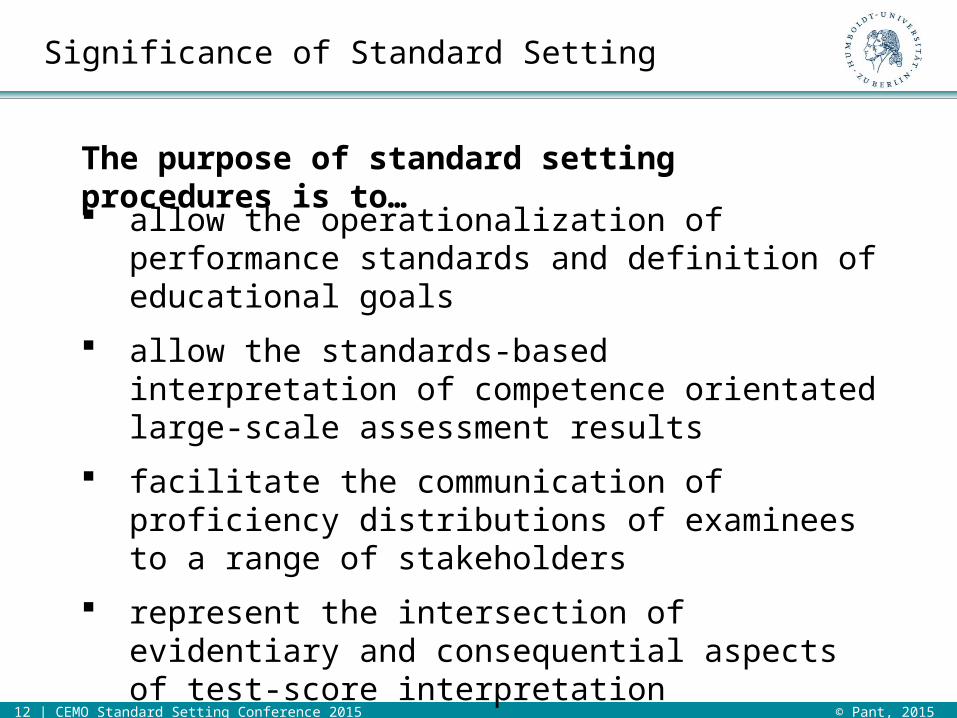
Significance of Standard Setting
allow the operationalization of performance standards and definition of educational goals
allow the standards-based interpretation of competence orientated large-scale assessment results
facilitate the communication of proficiency distributions of examinees to a range of stakeholders
represent the intersection of evidentiary and consequential aspects of test-score interpretation
The purpose of standard setting procedures is to…

13 | CEMO Standard Setting Conference 2015 © Pant, 2015
Continuum View of Proficiency
Continuous Student Proficiency
Basic Proficient Advanced
Cutscore 1 Cutscore 2
low ability high ability
Source: Meskauskas (1976)
Ordinal Categories of Proficiency
Principle of Standard Setting

14 | CEMO Standard Setting Conference 2015 © Pant, 2015
The Bookmark Method – Cut-score between levels L2 and L2
Standard Setting: The Bookmark Method
OrderedItem
Booklet
1
2
3
19
109
8
76
54
18
17
16
1514
13
12
11
22
21
20
OrderedItem
Booklet
1
2
3
19
109
8
76
54
18
17
16
1514
13
12
11
22
21
20
Book
mar
kL1
L2
Items a
re arrange
d by
ascending empiric
al
difficu
lty
Items below the Bookmark define the content a student at level L1
has mastered
Items above the Bookmarkhave not yet been mastered by a
student at level L2

15 | CEMO Standard Setting Conference 2015 © Pant, 2015
Panel experts set cut-scores in three rounds: Round1: individual cut-scores using OIBs and
proficiency level descriptors; followed by normative feedback
(group members’ individual and average cut-scores) Round 2: individual cut-scores; followed by normative feedback plus impact data
(resulting population distribution of student achievement)
Round 3: final cut-scores are set individually (striving for a consensus)
Iterative group consensus finding procedure
E x am inee Reading P rofic ienc y Dis tribut ion in relat ion to Cut-s c ores and P rofic ienc y Levels
100 200 300 400 500 600 700 800 900
Ex a m ine e Ability
0
2000
4000
6000
8000
10000
12000
14000
16000
18000
20000
22000
24000
26000
Freq
uen
cy
C ut 1
A 2 C 1B 2B 1A 1
C ut 4C ut 3C ut 2
The Bookmark-Methode

16 | CEMO Standard Setting Conference 2015 © Pant, 2015
Illustration of a proficiency level model(Scientific reasoning in biology)
17 | CEMO Standard Setting Conference 2015 © Pant, 2015
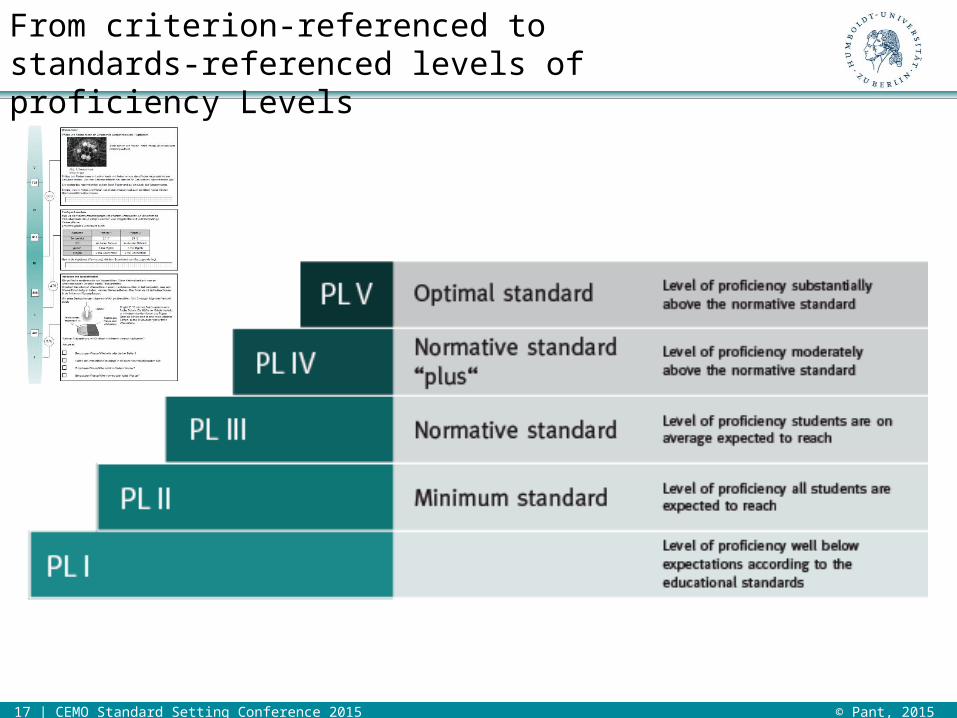
From criterion-referenced to standards-referenced levels of proficiency Levels

18 | CEMO Standard Setting Conference 2015 © Pant, 2015
The Interplay of Research and Policy in the Standard Setting Process in Germany
Policy enacts educational standards Researchers (domain content experts,
edumetricians, psychologists,…) set up an assessment system
Cut-score recommendations are presented to the 16 state ministers of education
Ministers formally approve and authorize the set of cut-scores for every single proficiency level model

19 | CEMO Standard Setting Conference 2015 © Pant, 2015
Results from national standards-based monitoring
International National State-wide

20 | CEMO Standard Setting Conference 2015 © Pant, 2015
Norm-referenced feedback: Mean scores of mathematic achievement by state (9th grade)
State M SD
Saxony 536 96Thuringia 521 93Brandenburg 518 105Bavaria 517 101Saxony-Anhalt 513 99Mecklenburg Western Pommerania 505 95Rhineland-Palatinate 503 97Schleswig-Holstein 502 98Baden-Wuerttemberg 500 100Germany 500 100Lower Saxony 495 91Hesse 495 97Saarland 489 93Hamburg 489 99North Rhine Westfalia 486 102Berlin 479 104Bremen 471 103
Significantly above average
Significantly below average
Maximum mean state difference corresponds to over 2 years in learning progression!
21 | CEMO Standard Setting Conference 2015 © Pant, 2015
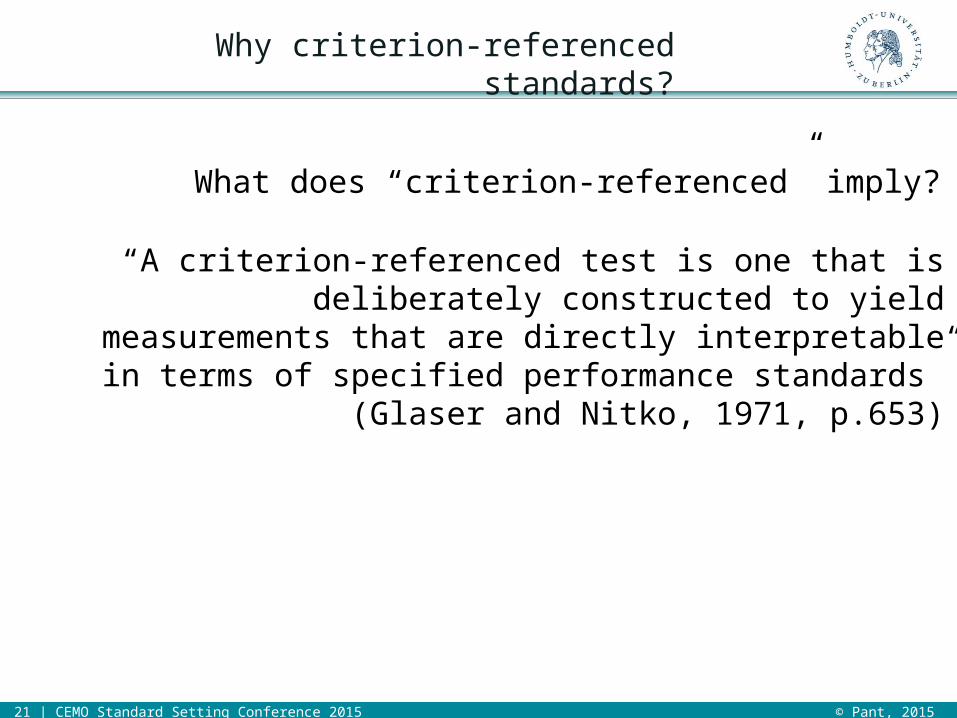
“A criterion-referenced test is one that is deliberately constructed to yield measurements that are directly interpretable in terms of
specified performance standards” (Glaser and Nitko, 1971, p.653)
What does “criterion-referenced” imply?
Why criterion-referenced standards?

22 | CEMO Standard Setting Conference 2015 © Pant, 2015
Criterion/Standards-referenced comparions:Proportions of students by proficiency level in maths (9th grade)
Bremen
Saxony
0% 10% 20% 30% 40% 50% 60% 70% 80% 90% 100%
39
11
27
27
21
31
10
23
3
7
I II III IV V
61% of students in Saxony meet normative standard
34% of students in Bremen meet normative standard
Proficiency level

23 | CEMO Standard Setting Conference 2015 © Pant, 2015
Criterion/Standards-referenced monitoring on a system level
Anmerkungen. <KS II = Mindeststandard nicht erreicht; ≥KS III = mindestens Regelstandard erreicht; Orthogr.= Orthografie; Fachwiss.= Fachwissen; Erkennt.= Erkenntnisgewinnung; im Fach Mathematik in der Sekundarstufe I beziehen sich die Prozentanteile auf alle zielgleich unterrichteten Neuntklässlerinnen und Neuntklässler, unabhängig davon, ob sie einen HSA oder MSA anstreben; hellrote Markierung= zwischen 10% und 15% haben den Mindeststandard (der Primarstufe bzw. des MSA) verfehlt bzw. lediglich zwischen 40% und 50% haben mindestens den Regelstandard (der Primarstufe bzw. des MSA) erreicht; dunkelrote Markierung= mehr als 15% haben den Mindeststandard (der Primarstufe bzw. des MSA) verfehlt bzw. weniger als 40% haben mindestens den Regelstandard (der Primarstufe bzw. des MSA) erreicht; grüne Markierung= weniger als 10% haben den Mindeststandard (der Primarstufe bzw. des MSA) verfehlt bzw. über 50% haben mindestens den Regelstandard (der Primarstufe bzw. des MSA) erreicht *= es liegen keine bundesweiten Angaben im Ländervergleich 2009 vor
< KS II ≥ KS III < KS II ≥ KS III < KS II ≥ KS III < KS II ≥ KS III < KS II ≥ KS III < KS II ≥ KS III < KS II ≥ KS III < KS II ≥ KS III < KS II ≥ KS III < KS II ≥ KS III < KS II ≥ KS III < KS II ≥ KS III < KS II ≥ KS III < KS II ≥ KS III < KS II ≥ KS IIIBW 10 69 6 77 9 73 5 73 1 90 1 87 15 41 7 46 24 44 8 68 13 54 20 53 13 60 12 67 10 69BY 10 73 6 79 8 77 2 80 0 94 1 93 8 56 4 60 21 50 6 75 5 67 12 67 9 71 8 76 5 80BE 22 54 15 62 27 47 14 60 6 75 4 76 27 37 17 38 33 37 9 67 12 57 19 56 14 61 13 65 11 70BB 13 66 9 70 13 65 10 62 3 79 5 73 34 27 27 20 19 53 2 86 3 74 7 74 5 78 3 84 3 87HB 21 52 14 60 25 50 14 59 5 75 8 71 32 32 16 39 39 34 7 66 12 54 22 51 18 58 12 64 10 69HH 18 59 11 68 20 56 12 63 2 83 4 75 24 37 11 46 28 41 8 66 11 54 20 52 15 58 12 63 8 71HE 13 64 8 71 14 62 8 66 2 84 2 86 19 38 9 43 27 41 7 66 11 53 19 53 13 59 10 66 8 71MV 9 70 6 76 11 69 11 61 3 80 3 77 33 29 28 25 20 47 3 77 6 62 9 65 8 67 6 73 6 77NI 12 67 7 75 12 65 10 65 2 87 4 80 26 34 13 37 25 42 5 72 8 61 17 57 11 64 10 67 6 77NW 14 63 8 71 13 65 7 66 1 87 1 83 19 38 10 40 31 39 8 63 11 53 20 51 17 56 13 61 8 70RP 14 64 8 70 13 65 5 73 1 88 1 88 16 42 8 44 24 46 3 78 6 65 11 63 7 70 5 74 4 81SL 13 66 10 69 12 69 5 73 1 86 1 89 18 43 10 44 28 41 5 73 6 63 14 61 9 67 8 71 6 77SN 8 72 6 76 7 76 9 67 3 80 3 76 32 32 26 25 12 61 2 84 4 70 7 72 5 77 3 83 3 86ST 9 74 9 71 8 75 7 67 2 85 3 80 26 34 22 26 21 50 2 81 5 66 6 75 6 73 4 81 3 82SH 13 65 6 76 13 64 5 72 1 90 2 86 14 41 5 48 23 46 4 76 6 64 12 62 7 70 5 76 5 79TH 10 70 6 75 12 67 8 65 1 82 3 79 29 33 22 28 18 52 3 83 3 71 8 72 4 77 3 84 2 87DE 12 67 7 74 12 68 * * * * * * 19 40 10 43 25 44 6 71 9 59 16 58 12 64 10 69 7 75
Primarstufe
B-Fachwiss.
Sekundarstufe IDeutsch
D-Lesen D-ZuhörenM-Global D-Orthogr.Deutsch Englisch
E-Leseverst.D-Lesen D-ZuhörenMathematik Physik
Ph-Fachwiss. Ph-Erkennt.E-Hörverst.MathematikM-Global B-Erkennt.
Biologie ChemieCh-Fachwiss. Ch-Erkennt.

24 | CEMO Standard Setting Conference 2015 © Pant, 2015
A glossary so far…
Educational Standards
Educational performance expectations
Standard Setting
Mapping of performance expectations to assessments
Cut-scores
Minimum criteria for meeting level-specific
expectations
Validity
Plausibility, appropriateness,defensibility

25 | CEMO Standard Setting Conference 2015 © Pant, 2015
Current validity concept (APA, AERA, NCME)
It is the uses and interpretations of an assessment result, i.e. the inferences, rather than the assessment result itself that is validated.
Validity may be relatively high for one use of assessment results by quite low for another use or interpretation.
Validity is a matter of degree rather than all or none.
“The consequential aspect of (…) validity includes evidence and rationales for evaluating the intended and unintended consequences of score interpretation and use in both the short- and long-term” (Messick, 1995, p. 746)
“[T]he validation process is scientific as well as rhetorical and requires both evidence and argument” (p. 747).

26 | CEMO Standard Setting Conference 2015 © Pant, 2015
In sum:
Validation takes the form of an open-ended
argument that evaluates the overall
plausibility of the proposed interpretations
of an assessment result and its
consequences.
Samuel Messick’s Validity Concept
27 | CEMO Standard Setting Conference 2015 © Pant, 2015
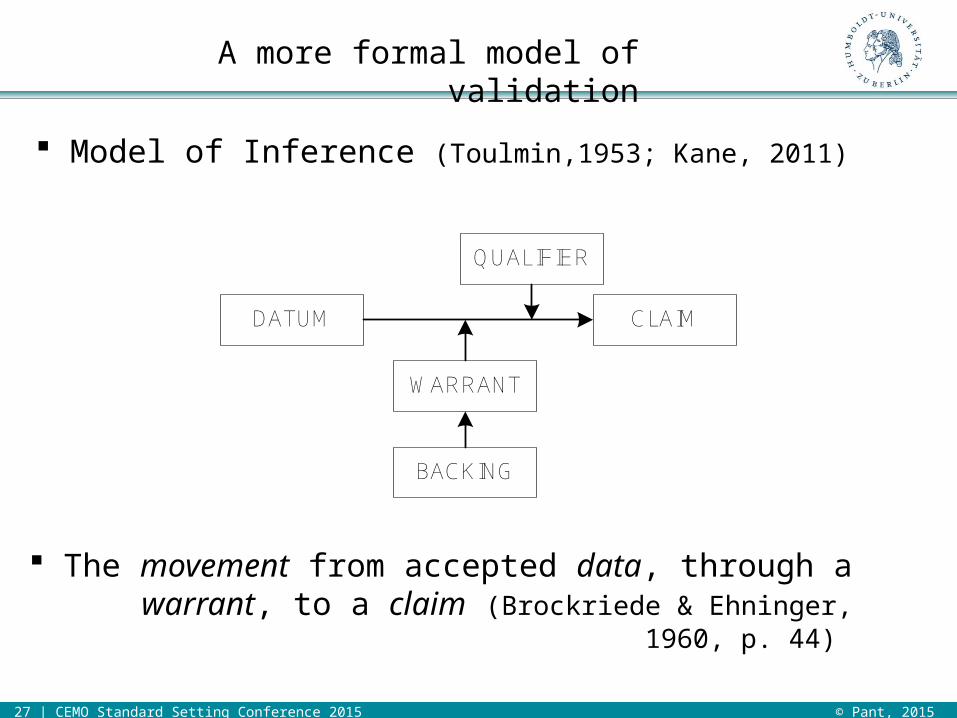
The movement from accepted data, through a warrant, to a claim (Brockriede & Ehninger, 1960, p. 44)
Model of Inference (Toulmin,1953; Kane, 2011)
A more formal model of validation
DATUM CLAIM
WARRANT
BACKING
QUALIFIER

28 | CEMO Standard Setting Conference 2015 © Pant, 2015
Validity argument
DATUM
Examineeperformance measeured
as a test-score on an assessment
CLAIM
Interpretation of test-scores as a proficiency
level classification
QUALIFIER
Justification for test usefor specified
populations under specified conditions
WARRANT
BACKING
Pre-Test-Score
Definition of output domain in terms of cognitive processes required to perform domain-relevant tasks
Definition of specific examples of examinee domain-relevant behaviors at each level of proficiency
Evidence of appropriate- content representation - response processes- level ofchallenge - difficulty generating item characteristics
Classical test theory and item response theory psychometric analyses of item and person parameters
Evidence of- procedural- internal, - external validity
Cut-scores correspond to the performance level descriptors
Clearly defined content domain
Test content
alignment
Clearly defined PLDs
Test-Score Reliability
Defensible Cut-Scores
Empirical and rhethorical evidence for the support of the propositions of
validity
Validity argument for the intended porpose of
the assessment and standard-based
(criterion-referenced) interpretation of test-
scores
Inte
nded
and
uni
nten
ded
cons
eque
nces
Bottleneck for consequential
concerns

29 | CEMO Standard Setting Conference 2015 © Pant, 2015
Standards-based state-wide assessments
International National State-wide

30 | CEMO Standard Setting Conference 2015 © Pant, 2015
Differences between the three assessments in Germany
International
PISA, PIRLS, TIMSS
National tests
16-states comparisons
State-wide Testswithin-state
Standards-based tests? No Yes Yes
Data base Sample-based(approx. 5,000)
Sample-based(approx. 40-60,000)
Population-based
Periodicity 3 years, 5 years 5-6 years Every year
Main purpose System monitoring System monitoringSchool & classroom
instruction improvement
Who is accountable? (“high stakes")
Federal Ministry of Education; 16 State
Ministries of Education
16 State Ministries of Education and their school authorities
Principals, teachers

31 | CEMO Standard Setting Conference 2015 © Pant, 2015
Goal of state-wide testing:Data-based instruction and school improvement
Coverage: 1.5 million students and 64,000 teachers every year

32 | CEMO Standard Setting Conference 2015 © Pant, 2015
Test preparation strategies in teachers
Increasing instructional time
More individualized teaching
Increasing instructional load
Reallocation of content
Coaching
Cheating

33 | CEMO Standard Setting Conference 2015 © Pant, 2015
State
I II III IV V III+ I II III IV V III+ A 26 21 21 14 18 53 13 21 30 25 11 66
3rd grade (state-wide, 2010)
B 38 19 18 11 15 43 22 24 27 19 7 54 C 29 20 21 13 17 51 10 21 32 26 11 69 D 21 19 23 15 20 58 10 17 29 28 16 74 E 22 19 22 15 22 59 9 21 33 27 10 70 F 24 20 22 14 20 57 12 21 29 25 13 67 G 23 19 22 14 22 58 14 23 30 22 11 63 H 20 19 23 15 23 61 13 22 30 24 11 65
4th grade (national, 2011)
Proficiency level distributions in population-based vs. sample-based studies of identical student cohort (1 year lag)
34 | CEMO Standard Setting Conference 2015 © Pant, 2015
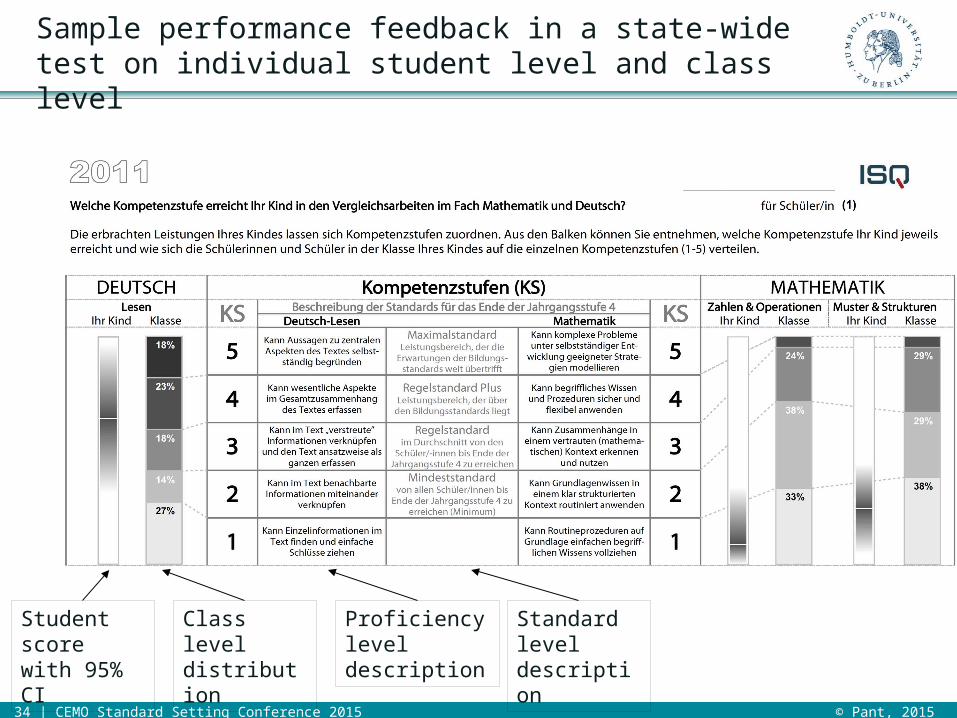
Sample performance feedback in a state-wide test on individual student level and class level
Student score with 95% CI
Class level distribution
Proficiency level description
Standard level description

35 | CEMO Standard Setting Conference 2015 © Pant, 2015
Classification accuracy as a differential threat to validity depending on the test purpose
Classification accuracy is not an issue in the system monitoring case, where plausible value distributions are used to estimate the population percentage of students on each proficiency level.
However, in the case of school and class level aggregate feedback, individual person ability estimates (MLE or WLE) are used to report proficiency level distribution (e.g., 20% of school X students perform below basic standard). Hence, misclassification bias is important, specifically when trends in the proficiency distribution are fed back.
One test type, different purposes

36 | CEMO Standard Setting Conference 2015 © Pant, 2015
Item Response Theory based classification accuracy using Rudner’s (2001) method
score-cut θ
score true θ
score observed θ
c
j
The standardized distance between true score and cut-score is determined
The area right of the cut-score is calculated to determine the probability of the examinee being incorrectly classified above their ability.
Freu
quen
cy
ability scale
0 1 3-2 2-1-3
θc
θj
θ̂
Cut-score
)θ(
θθ
j
jc
SEz
Consequential Validity Study:Definition of Classification Accuracy

37 | CEMO Standard Setting Conference 2015 © Pant, 2015
Consequential Validity Study
The number of proficiency levels set on an ability scale;
the reliability of examinee ability estimates (Ercikan, 2006; Ercikan & Julian, 2002);
the distance on the ability scale between cut-scores (Zhang, 2010);
the number of examinees with ability estimates close to a cut-score (Emons, Sijtsma, & Meijer, 2007);
the measurement error associated with the examinee ability estimates (Betebenner, et al., 2008).
Factors that have been hypothesized to systematically affect classification accuracy (Wyse 2010):

38 | CEMO Standard Setting Conference 2015 © Pant, 2015
Consequential Validity Study
For their state-wide assessments in grade 8 states in Germany can administer multiple psychometrically linked non-equivalent parallel test-forms of varying mean item difficulty.
This is done in order to take the average ability of different target populations (Hauptschul vs. Realschule vs. Gymnasium) into account.
Moreover, some states prefer to give a more “fine grained” feedback to their schools based on an 8-level instead of the usual 5-level competence model version of the CEFR.
Applied context for research questions on classification accuracy

39 | CEMO Standard Setting Conference 2015 © Pant, 2015
Classification accuracy vs. feedback differentiation
The Common European Framework for LanguagesLevels of Language Proficiency
A2.2A2.1
A1Breakthrough
A2Waystage
B1Threshold
B2Vantage
C1Operational Proficiency
C2Mastery
A BasicLanguage Use
IndependentLanguage Use B C Proficient
Language Use
B1.2B1.1 B2.2B2.1

40 | CEMO Standard Setting Conference 2015 © Pant, 2015
Consequential Validity Study
How do the two factors ability matched test forms and number of proficiency levels affect classification accuracy using a real sample of large-scale data?
Is class-level aggregated classification accuracy differentially affected by increasing the number of proficiency levels? Put differently: Is it possible to identify schools which would likely experience a disproportionally high loss in classification accuracy with the increase of the number of proficiency levels?
Research questions on classification accuracy

41 | CEMO Standard Setting Conference 2015 © Pant, 2015
Consequential Validity Study
Response data of N=33,520 year eight examinees from the states of Berlin and Brandenburg totaling N=1,706 classes with an average size of 19 students was analyzed.
The assessment of examinee ability was estimated using maximum likelihood estimates (MLE) with a reliability of .919. English reading comprehension was conducted using two parallel test-forms with n=58 and n=52 items.
The items contained in test-form one, taken by lower achieving classes, had lower logit difficulty estimates (M=-1.13, SD=1.4) than items contained in test-form two (M=-0.12, SD=1.49), taken by higher achieving classes.
Data base and analyses

42 | CEMO Standard Setting Conference 2015 © Pant, 2015
Classification accuracy of two non-equivalent parallel test-forms relative to examinee ability and 4 vs. 7 cut scores
Clas
sific
ation
Acc
urac
y
Ability Estimate
Testform 2
Testform 1
Classification AccuracyCl
assi
ficati
on A
ccur
acy
Ability Estimate
Testform 2Testform 1

43 | CEMO Standard Setting Conference 2015 © Pant, 2015
The paradox relationship between the increase in perceived detail of reports and the accuracy with which examinees can be assigned to these levels leads to the recommendation to set only as many cut-score to define proficiency levels as is necessary for the purpose of the assessment.
Recipients of test-result should be made aware that when making comparisons between aggregated units, such as classes or schools, groups which differ in their mean ability may also differ in the accuracy with which they can be assigned to proficiency levels.
Taking the present findings and those of earlier studies into account, it can be recommended that reports of the proportions of examinee classifications on criterion-referenced proficiency levels should include the degree of uncertainty attached to the classification at each proficiency level.
Conclusions for standard setting and feedback format

44 | CEMO Standard Setting Conference 2015 © Pant, 2015
Consequential aspects when designing standards-referenced assessments
Performance feedback level
Level of stakes
Evaluation purpose
high
low
individual
class
school
state
summative (status)
formative (trend, trajectory)

45 | CEMO Standard Setting Conference 2015 © Pant, 2015
Valid standard setting procedures require …
a thourogh and thoughtful discussion on test-use and purpose before setting-up an assessment system
an open discussion about the vested interests of various stake-holders in the interpretation of test results
an explicit strategy how to relate assessment results to existing exams and certification systems
an idea about how to deal with uncertainty/ ambiguity/ imprecision of test results and how to communicate this to other stake-holders
What we ideally should have done
46 | CEMO Standard Setting Conference 2015 © Pant, 2015
Take-home
Early management of expectations rather than later management of disappointment!

Contact:[email protected]@deutsche-schulakademie.de
Contact:[email protected]@deutsche-schulakademie.de
Thank you for your atten n

48 | CEMO Standard Setting Conference 2015 © Pant, 2015
The argument for test-score interpretation
cons
eque
nces
DATUMExaminee performance as an assessment test-score
CLAIMInterpretation of test-score as proficiency level classification
QUALIFIERConditions under which proposed claims are valid
Content standards are well defined
Test content is aligned
PLDs are well defined
Test-scores are reliable and unbiased
Cut-scores are appro-priate
WARRANT

49 | CEMO Standard Setting Conference 2015 © Pant, 2015
Regional Groups Evaluation Group
Items for Standardized Assessments
Items and Tasks for Classroom
Implementation
StudentSolutions
FirstItemPool
Inte
rnet
Por
tal
Review and revision of items, feedback to item development
group, development of overarching framework
Revised Item Pool
FinalItemPool
Pool of items for classroom Implementation
IQB
Pool of items for standardized assessments
Testing InstitutesPublishers
Collecting, Commenting, and Evaluating Release of items after review
/ revision
Item Development Process at the IQB