1 cbj water system energy audit - juneau · lcb last chance basin ll lena loop llc life cycle cost...
TRANSCRIPT

Water System Energy Audit Final Report
August 13, 2009
City and Borough of Juneau Water System
Prepared for:
City and Borough of Juneau
Contract No. RFP E09-126
Prepared by:
Alaska Energy Engineering LLC
25200 Amalga Harbor Road Tel/Fax: 907.789.1226 Juneau, Alaska 99801 [email protected]

This page intentionally left blank

Alaska Energy Engineering LLC
City and Borough of Juneau 1 Water System Energy Audit
Table of Contents
Table of Contents 1
Project Team 2
Abbreviations 2
Section 1: Executive Summary 3 System Description 3 Energy Conservation Opportunities 4 Facility Guidelines 7 Summary 11
Section 2: Introduction 13 Background 13 Methodology 16
Section 3: Last Chance Basin Well Field 19 Introduction 19 Buildings 20 Process 24 Energy Conservation Opportunities 26
Section 4: Salmon Creek Pump Station 33 Introduction 33 Buildings 35 Process 38 Energy Conservation Opportunities 39
Section 5: Crow Hill Pump Station 43 Introduction 43 Building 45 Process 47 Energy Conservation Opportunities 48
Section 6: Cedar Park Pump Station 51 Introduction 51 Building 52 Process 54 Energy Conservation Opportunities 55
Section 7: Bonnie Brae Pump Station 59 Introduction 59 Building 60 Process 61 Energy Conservation Opportunities 62

Alaska Energy Engineering LLC
City and Borough of Juneau 2 Water System Energy Audit
Table of Contents (continued)
Section 8: Mountain Side Pump Station 65 Introduction 65 Building 66 Process 68 Energy Conservation Opportunities 69
Section 9: Lena Loop Pump Station 73 Introduction 73 Building 74 Process 76 Energy Conservation Opportunities 77
Appendix A: Energy Use Data
Appendix B: Calculations
Appendix C: Life Cycle Cost Analysis
Project Team
Energy Engineering Jim Rehfeldt, P.E., Mechanical Engineer Alaska Energy Engineering LLC 25200 Amalga Harbor Road Juneau, Alaska 99801 907.789.1226 [email protected]
Civil Engineering Jim Dorn, P.E., Civil Engineer Carson Dorn Inc. 712 West 12th Street Juneau, Alaska 99801 907.586.4447 [email protected]
Abbreviations
AEL&P Alaska Electric Light & Power Co. BB Bonnie Brae BTUH BTU per hour CBJ City and Borough of Juneau CH Crow Hill CP Cedar Park HP Horsepower GPM Gallons per minute kW Kilowatt kWh Kilowatt-hour
LCB Last Chance Basin LL Lena Loop LLC Life Cycle Cost MS Mountain Side NEMA National Electrical Manufacturers Assoc PRV Pressure reducing valve SC Salmon Creek SCADA Supervisory Control & Data Acquisition VFD Variable frequency drive

Alaska Energy Engineering LLC
City and Borough of Juneau 3 Water System Energy Audit
Section 1
Executive Summary
This report presents the findings of an energy audit of the City and Borough Of Juneau’s Water System. The purpose of the energy audit is to identify energy conservation opportunities (ECOs) that, if implemented, will provide a life cycle savings.
The findings were gathered from on-site observations, review of construction documents, and interviews with water utility operations and maintenance personnel.
The energy audit was performed by Jim Rehfeldt, P.E. of Alaska Energy Engineering LLC with technical engineering assistance by Jim Dorn, P.E. of Carson Dorn, Inc.
SYSTEM DESCRIPTION
The CBJ water system has two water sources. The Last Chance Basin Well Field consists of five wells, linked to an on-site chlorination system, which supply the community-wide low elevation distribution system and a high elevation distribution system. The Salmon Creek Pump Station treats water from the Salmon Creek Reservoir surface water source and pumps it to the Salmon Creek chlorination tank which is connected to the community-wide low elevation system.
There are three steel tank water storage reservoirs connected to the low elevation system that provide water storage—Lemon Creek Reservoir, East Valley Reservoir, and Auke Bay Reservoir.
There are three steel tank water storage reservoirs and pump stations that boost system pressure to serve upland or distant areas. The Crow Hill Pump Station and Reservoir supplies upland areas in Douglas. Cedar Park Pump Station and West Juneau Reservoir supply upland areas in West Juneau. Lena Loop Pump Station and Reservoir supply the upland areas of Lena Loop and the end of the distribution system “out the road”.
Three pump stations supply upland areas, but do not include reservoir storage. The Mountain Side Pump Station supplies the upland areas of Mountain Side Estates. The Bonnie Brae Pump Station supplies upland areas in Bonnie Brae Subdivision, and the Lee Street Pump Station supplies upland areas on Lee Street.
An energy audit of the following sites was performed:
• Last Chance Basin Well Field • Salmon Creek Pump Station • Crow Hill Pump Station • Cedar Park Pump Station • Bonnie Brae Pump Station • Mountain Side Pump Station • Lena Loop Pump Station
Water Production
The Last Chance Basin Well Field and Salmon Creek Water Source produced 1,500M gallons of water in 2008. The facilities are all-electric and consumed 2,500 MWh of electricity in 2008 at a cost of $206,000.

Alaska Energy Engineering LLC
City and Borough of Juneau 4 Water System Energy Audit
ENERGY CONSERVATION OPPORTUNITIES
The energy audit revealed that all of the sites have energy conservation opportunities. The energy performance of each ECO is evaluated based on the operating parameters of the water system and facilities. The economic viability of each ECO is evaluated by a life cycle cost analysis.
Behavioral or Operational Energy Conservation Opportunities
Top priority should be given to the following behavioral or operational ECOs that require minimal investment and offer immediate savings. The ECOs at each site are listed from highest to lowest priority.
Last Chance Basin Well Field
• LCB-1: Optimize Mill Tunnel Flow to the Low Elevation System • LCB-2: Set and Monitor Consistent Heating Setpoints • LCB-3: Repair Exterior Lighting Photocells • LCB-4: Adjust Cooling Setpoints • LCB-5: Adjust Cooling and Emergency Generator Makeup Air Louvers • LCB-6: Weather-strip Exterior Doors
Salmon Creek Pump Station
• SC-1: Turn Off Freezer • SC-2: Set and Monitor Consistent Heating Setpoints • SC-3: Repair Exterior Lighting Photocells • SC-4: Weather-strip Exterior Doors • SC-5: Replace Heating Thermostat
Crow Hill Pump Station
• CH-1: Change the Electric Rate • CH-2: Set and Monitor Consistent Heating Setpoints • CH-3: Weather-strip Exterior Doors
Cedar Park Pump Station
• CP-1: Set and Monitor Consistent Heating Setpoints • CP-2: Weather-strip Exterior Doors
Bonnie Brae Pump Station
• BB-1: Set and Monitor Consistent Heating Setpoints
Mountain Side Pump Station
• MS-1: Change the Electric Rate • MS-2: Set and Monitor Consistent Heating Setpoints • MS-3: Weather-strip Exterior Doors
Lena Loop Pump Station
• LL-1: Set and Monitor Consistent Heating Setpoints • LL-2: Weather-strip Exterior Doors

Alaska Energy Engineering LLC
City and Borough of Juneau 5 Water System Energy Audit
Recommended Energy Conservation Opportunities
The following tables list the recommended ECOs and the construction, maintenance, and energy costs over a 25-year period. The ECOs for each site are listed from highest to lowest priority. Table 1-1 provides a prioritized listing of all the ECOs. Table 1-2 provides a listing of each recommended ECO by facility.
Table 1-1: Life Cycle Cost Analysis Summary (Priority Ranking)
Energy Conservation Opportunity Construction Maintenance Energy Total LCC 1
High Priority CP-3: Replace Oversize Heater $500 $0 ($17,400) ($16,900) LL-3: Restore Variable Speed Pumping $200 $0 ($4,700) ($4,500) LCB-7: Install VFD on Well 2 Pump $17,000 $2,000 ($387,000) ($368,000) CH-5: Replace Oversize Heaters $1,100 $0 ($14,900) ($13,800) LL-4: Replace Oversize Heaters $1,600 $0 ($21,000) ($19,400) LCB-8: Install VFD/ Replace Motor Well 3 Pump $7,000 $2,000 ($91,000) ($82,000) LCB-9: Install VFD on Well 1 Pump $10,000 $2,000 ($106,000) ($94,000) LCB-10: Replace Treatment Building HW Heater $700 $0 ($6,700) ($6,000) CH-6: Seal Louvers During Winter Months $100 $0 ($800) ($700) LCB-11: Replace Oversize Heaters $3,700 $0 ($20,900) ($17,200) MS-4: Replace Oversize Heaters $1,100 $0 ($5,600) ($4,500) CP-4: Change Lighting Control $200 $0 ($1,000) ($800) SC-6: Seal Louvers During Winter Months $1,200 $0 ($5,700) ($4,500) SC-7: Replace Soda Ash Motor $600 $0 ($1,900) ($1,300) CP-5: Seal Cooling Louvers During Winter Months $100 $0 ($300) ($200) High Priority Total $45,100 $6,000 ($684,900) ($633,800) Low Priority LCB-12: Install VFD/Replace Motor Well 4 Pump $17,000 $2,000 ($52,000) ($33,000) SC-8: Replace Older Transformers $15,700 $0 ($42,600) ($26,900) LCB-13: Install VFD/Replace Motor Well 5 Pump $17,000 $2,000 ($45,000) ($26,000) LCB-15: Seal Louvers During Winter Months $600 $0 ($1,200) ($600) MS-5: Seal Cooling Louvers During Winter Months $200 $0 ($400) ($200) CP-6: Install VFDs and Replace Motors on Pumps $31,000 $2,300 ($47,000) ($13,700) CH-7: Install VFDs and Replace Motors on Pumps $33,400 $2,300 ($49,300) ($13,600) LCB-14: Replace Older Transformers $16,500 $0 ($22,200) ($5,700) BB-3: Replace Older Transformer $5,800 $0 ($7,300) ($1,500) LL-5: Seal Cooling Louvers During Winter Months $100 $0 ($100) $0 Medium Priority Total $137,300 $8,600 ($267,100) ($121,200) Totals $182,400 $14,600 ($952,000) ($755,000) Note: Negative numbers, in parenthesis, represent savings. LCB = Last Chance Basin; SC=Salmon Creek; CH=Crow Hill; CP=Cedar Park; BB=Bonnie Brae; MS=Mountain Side; LL=Lena Loop

Alaska Energy Engineering LLC
City and Borough of Juneau 6 Water System Energy Audit
Table 1-2: Life Cycle Cost Analysis Summary (by Facility)
Energy Conservation Opportunity Construction Maintenance Energy Total LCC 1
Last Chance Basin Well Field High Priority LCB-7: Install VFD on Well 2 Pump $17,000 $2,000 ($387,000) ($368,000) LCB-8: Install VFD/Replace Motor on Well 3 $7,000 $2,000 ($91,000) ($82,000) LCB-9: Install VFD on Well 1 Pump $10,000 $2,000 ($106,000) ($94,000) LCB-10: Replace Treatment Bldg. HW Heater $700 $0 ($6,700) ($6,000) LCB-11: Replace Heating Units $3,700 $0 ($20,900) ($17,000) Medium Priority LCB-12: Install VFD/Replace Motor on Well 4 $17,000 $2,000 ($52,000) ($33,000) LCB-13: Install VFD/Replace Motor on Well 5 $17,000 $2,000 ($45,000) ($26,000) LCB-14: Replace Transformers $16,500 $0 ($22,200) ($5,000) LCB-15: Seal Cooling Louvers during Winter $600 $0 ($1,200) ($600) Last Chance Basin Well Field Totals $89,500 $10,000 ($732,000) ($632,500) Salmon Creek Pump Station High Priority SC-6: Seal Cooling/Gen. Louvers during Winter $1,200 $0 ($5,700) ($4,500) SC-7: Replace Soda Ash Motor $600 $0 ($1,900) ($1,300) Medium Priority SC-8: Replace Older Transformers $15,700 $0 ($42,600) ($26,900) Salmon Creek Totals $17,500 $0 ($50,200) ($32,700) Crow Hill Pump Station High Priority CH-4: Replace Heating Unit $1,100 $0 ($14,900) ($13,800) CH-5: Seal Cooling Louvers during Winter $100 $0 ($800) ($700) Medium Priority CH-6: Install VFD and Replace Motor $33,400 $2,300 ($49,300) ($13,600) Crow Hill Pump Station Totals $34,600 $2,300 ($65,000) ($28,100) Cedar Park Pump Station High Priority CP-3: Replace Electric Heater $500 $0 ($17,400) ($16,900) CP-4: Control Light Fixture $200 $0 ($1,000) ($800) CP-5: Install VFD and Replace Motor $31,000 $2,300 ($47,000) ($13,700) Medium Priority CP-6: Seal Cooling Louvers during Winter $100 $0 ($300) ($200) Cedar Park Pump Station Totals $31,800 $2,300 ($65,700) ($31,600) Bonnie Brae Pump Station Medium Priority BB-3: Replace Older Transformer $5,800 $0 ($7,300) ($1,500) Mountain Side Pump Station High Priority MS-4: Replace Oversized Heaters $1,100 $0 ($5,600) ($4,500) Medium Priority MS-5: Seal Cooling Louver during Winter $200 $0 ($400) ($200) Mountain Side Pump Station Totals $1,300 $0 ($6,000) ($4,700) Lena Loop Pump Station High Priority LL-3: Restore Variable Speed Pumping Operation $0 $0 ($4,800) ($4,800) LL-4: Replace Oversized Heaters $1,600 $0 ($21,000) ($19,400) Medium Priority LL-5: Seal Cooling Louver during Winter $100 $0 ($130) ($30) Lena Loop Pump Station Totals $1,700 $0 ($25,900) ($24,200)
Totals $182,400 $14,600 ($952,000) ($755,000) Note: Negative numbers, in parenthesis, represent savings.

Alaska Energy Engineering LLC
City and Borough of Juneau 7 Water System Energy Audit
Energy Savings
Table 1-3 shows the current energy costs and projected ECO energy savings at each site.
Table 1-3: Energy Savings Summary
Energy Cost Projected 2008 ECO Savings %
Last Chance Basin Well Field $113,000 $40,000 36%
Salmon Creek Pump Station (CBJ cost) 1 $15,000 $2,700 18%
Crow Hill Pump Station $16,000 $3,500 22%
Cedar Park Pump Station $12,000 $3,500 29%
Mountain Side Pump Station $5,000 $320 6%
Lena Loop Pump Station $4,000 $1,400 35%
Bonnie Brae Pump Station $2,000 $400 20%
Vaults, Reservoirs, Other Pump Stations $42,000 - -
Totals $209,000 $52,000 25%
1. At the Salmon Creek Pump Station, AEL&P pays for up to 3,214.2 kWh per day of pumping energy. The CBJ pays for additional pumping energy and all other loads.
FACILITY GUIDELINES
Many of the sites have the same or similar ECOs. This indicates that there is a need to establish guidelines that optimize the facility and operational energy consumption. The following guidelines were developed based on the findings of the energy audit. The guidelines should be incorporated into new and renovated facilities. Given the long service life of the existing facilities, they should also be applied when possible as part of ongoing facility maintenance.
Building Envelope
The water system facilities are electrically heated. None of the existing buildings is optimally insulated for the current cost of heat.
The optimal insulation level depends upon the type of construction and the cost of heat, which varies at each facility. While an envelope optimization analysis is beyond the scope of this energy audit, the following insulation levels, based on indoor temperature of 55°F, are likely to be optimal for most facilities. In general, an overall heating load of 10 BTUH per sqft is achievable and optimal.
• Walls: R-25 to R-34 (depends upon wall construction) • Roof: R-45 to R-60 (depends upon roof construction) • Perimeter Footing: R-15 • Floor slab-on-grade: R-10 • Doors: Insulated metal doors and frames, with thermal break and weather-stripping

Alaska Energy Engineering LLC
City and Borough of Juneau 8 Water System Energy Audit
Electric Heating
The water system facilities are heated with electric heating units. Most heaters are permanently installed units, but there are some portable heaters plugged into outlets. Controls include wall thermostats, integral thermostats supplied with the heater, and no control (always on).
The electric heaters are oversized in most of the buildings. While an oversized heater will supply the same amount of heat as a properly sized heater, it will incur higher demand changes. For example, a heater that is 2 kW oversized, will incur added unnecessary demand charges of $235 annually when compared to a properly sized heater that supplies the same amount of heat.
Integral thermostats provide poor control because they are influenced by the output of the heater, which causes them to turn off before the room has come up to temperature.
The following guidelines are recommended for heating the buildings and the numerous water system vaults:
• Establish a reasonable indoor temperature. A setpoint of 55°F is likely to provide freeze protection and humidity control.
• Properly size the heaters for the heating load. • Install permanent heaters and control them from wall thermostats with temperature setpoints.
Attached a nameplate to each thermostat with the setpoint. • For facilities with heating loads of 3 kW or higher, reduce demand charges by installing two
or more heaters with a maximum size of 3 kW. Provide each heater with a separate thermostat and stagger the thermostat setpoints with a minimum 3°F differential so the heating demand can vary with the heating load.
Cooling Systems
There are several cooling schemes installed in the facilities. A recommended scheme is:
• Install a cabinet exhaust fan (interior insulation) sized for 6 air changes per hour. • The exhaust fan should be connected to an automatic exhaust damper and exhaust louver.
Insulate the discharge duct and louver with 2” duct insulation. Install an insulated 12x12 access door for the automatic damper.
• Install a makeup air louver with automatic damper. Connect a 36” length of insulated ductwork to within 12” of the floor. Locate the outlet to provide good cross-flow to the exhaust fan. Insulate all with 2” duct insulation.
• The makeup and exhaust ductwork is recommended to provide a thermal break between the louver and the inside.
• Control the fan and dampers from a wall thermostats set at 75°F.
Lighting
At most of the facilities, the lighting is operated a minimal number of hours each year. Inexpensive fluorescent T-8 lighting is optimal.
Exterior lighting is operated 50% of the year. Energy efficient metal halide lighting is recommended with integral photocells. Photocell control should be fine-tuned so the lighting is off during daylight hours.

Alaska Energy Engineering LLC
City and Borough of Juneau 9 Water System Energy Audit
Transformers
Most of the buildings are supplied with 480V power. The benefit of a 480V service, when compared to 208V/120V service, is that smaller conductors are required and motors are slightly more efficient at higher voltages. The downside is the investment in a step-down transformer that is downstream of the utility meter. The losses of the step-down transformer are paid by the owner.
Most transformer losses are converted to heat. The heat gain to the building can be beneficial during the heating season, but is inefficient when it is not needed. There are two methods for reducing the transformer losses. First, the transformer should be right-sized. Losses are typically a percentage of the transformer capacity, so a smaller transformer costs less and has smaller losses. Second, highly energy efficient transformers should be used.
Recommendations for transformers are:
• Determine if the motor loads and motor efficiencies warrant a 480V service and the losses associated with a step-down transformer.
• Right-size the transformer by establishing reasonable estimates of loads. • Use energy efficient transformers. Transformers that are 15 kVA and larger should meet the
energy efficiency requirements of NEMA Standard TP 1-2001. Smaller transformers do not have standards for energy efficiency.
• Locate the transformer near the floor where the heat output will create convective currents, spreading the heat though the facility.
Operational Guidelines
The following guidelines were developed based on energy conservation opportunities in the existing facilities and operations. The guidelines are recommended to improve the energy performance of the water system.
Pumps
Pumps consume the majority of the energy consumed by the water system. The pumps should be right-sized and selected for optimal efficiency. Variable speed pumping allows pumps to operate for longer periods at lower flow rates, which reduces energy consumption and demand charges. Variable speed pumping also negates the need for PRVs which essentially dissipate pump energy. The many energy and operational benefits of variable speed pumping should be implemented where appropriate.
Motors
Many of the motors in the water system are less efficient than modern motors. Replacing the motors with NEMA Premium® efficient motors will reduce energy consumption and demand charges.
The energy cost of operating a motor usually exceeds the purchase price. Whether an investment in an energy efficient motor should be made depends upon the cost of the motor, cost of electricity, and the number of operating hours each year. There is no guideline that is applicable to all of these variables. NEMA Premium® motors may not be available in the required frames.

Alaska Energy Engineering LLC
City and Borough of Juneau 10 Water System Energy Audit
Table 1-4 provides the full load efficiencies of “standard” and NEMA Premium® motors.
Table 1-4: Motor Full Load Efficiency
Horsepower “Standard” NEMA Premium®
1 76.7 to 82.5 85.5 1.5 79.1 to 84.0 86.5 2 80.8 to 84.0 86.5 3 81.4 to 87.5 89.5 5 83.3 to 87.5 89.5 7.5 85.5 to 89.5 91.7 10 85.7 to 89.5 91.7 15 86.6 to 91.0 92.4 20 88.5 to 91.0 93.0 25 89.3 to 92.4 93.6 30 89.6 to 92.4 93.6 40 90.2 to 93.0 94.1 50 91.3 to 93.0 94.5 60 91.8 to 93.6 95.0 75 91.7 to 94.1 95.4 100 92.3 to 94.5 95.4
Demand Control
AEL&P determines the electric demand by averaging demand over a continuously sliding fifteen-minute window. The highest fifteen-minute average during the billing period determines the peak demand. As a rule of thumb, each kW of peak load adds $10 in demand charges to the monthly electric bill. For example, at Cedar Park Pump Station, one pump fills the reservoir each night. If the second pump also operated simultaneously for over 15 minutes, it will add 44 kW x $10 = $440 in demand charges to that month’s bill.
Demand charges are applicable to the following facilities:
• Last Chance Basin • Crow Hill Pump Station • Cedar Park Pump Station • Mountain Side Pump Station • Lena Loop Pump Station
The following strategies are recommended to minimize demand:
• Implement the above facility and operational guidelines at each facility. • Use variable speed pumping and establish control sequences that operate pumps for longer
periods at lower flow rates. • At facilities with redundant pumps, limit simultaneous operation of pumps to emergencies
and testing. Perform back-to-back tests within one billing cycle so the added demand charges are applied to a single month’s bill.
• Use NEMA Premium® energy efficient motors where operating hours warrant the investment. • Right-size equipment such as pumps, transformers, and electric heaters.

Alaska Energy Engineering LLC
City and Borough of Juneau 11 Water System Energy Audit
SUMMARY
The water system facilities are in good condition and appear to be well maintained. However, there is financial incentive to invest in energy efficiency at each water system facility and obtain a 25% reduction in energy costs. The water system facilities are very similar, which provides an incentive to establish and implement consistent guidelines for facility construction and operation.
The author would like to express appreciation to the CBJ Water Department operation and maintenance personnel who provided assistance during this project. Their knowledge of the water systems and interest in energy efficiency was invaluable.

Alaska Energy Engineering LLC
City and Borough of Juneau 12 Water System Energy Audit
This page intentionally left blank

Alaska Energy Engineering LLC
City and Borough of Juneau 13 Water System Energy Audit
Section 2
Introduction
This report presents the findings of an energy audit of the City and Borough of Juneau’s Water System. The purpose of the energy audit is to identify energy conservation opportunities (ECOs) that will provide a life cycle savings.
The following facilities were audited:
• Last Chance Basin Well Field • Salmon Creek Pump Station • Crow Hill Pump Station • Cedar Park Pump Station • Bonnie Brae Pump Station • Mountain Side Pump Station • Lena Loop Pump Station
The findings were gathered from on-site observations, review of documentation, and interviews with water utility operations and maintenance personnel.
The energy audit was performed by Jim Rehfeldt, P.E. of Alaska Energy Engineering LLC with technical assistance by Jim Dorn, P.E. of Carson Dorn, Inc.
BACKGROUND
System Description
The CBJ water system has two water sources: Last Chance Basin Well Field and Salmon Creek. The distribution system consists of a community-wide low elevation system and several high elevation systems scattered throughout the area.
Last Chance Basin Well Field
The Last Chance Basin Well Field consists of five wells supplying the community-wide low elevation distribution system and a high elevation distribution system.
The low elevation water supply flows from the well field through an on-site chlorine treatment system and through the Jualpa Tunnel (former mine tunnel), which provides chlorine contact time, and into the distribution system.
The high elevation system supplies the upland area surrounding downtown Juneau. Water flows from the well field through a second on-site chlorine treatment system and into the Mill Tunnel (former mine tunnel), which provides storage for both the high and low elevation systems, and into the high elevation distribution system.
Alaska Energy Engineering LLC
City and Borough of Juneau 14 Water System Energy Audit
Salmon Creek Water Source
Salmon Creek consists of a surface water source that is connected to the community-wide low elevation system. Water from Salmon Creek flows through an Alaska Electric Light & Power Company hydroelectric facility and is pumped from the tailrace through an on-site chlorination system and into the Salmon Creek Reservoir which provides chlorine contact time. The water flows from the reservoir through a soda ash treatment system and into the community-wide low elevation distribution system. AEL&P pays some of the pumping costs as part of an agreement with the CBJ.
Low Elevation System Reservoirs
There are three reservoirs connected to the low elevation system that provide water storage—Lemon Creek Reservoir, East Valley Reservoir, and Auke Bay Reservoir.
High Elevation System Pump Stations and Reservoirs
There are three steel tank water storage reservoirs and pump stations that boost system pressures to serve upland or distant areas. The Crow Hill Pump Station and Reservoir supplies upland areas in Douglas. Cedar Park Pump Station and West Juneau Reservoir supply upland areas in West Juneau. Lena Loop Pump Station and Reservoir supply the upland areas of Lena Loop and the end of the distribution system “out the road”.
Three pump stations supply upland areas, but do not include reservoir storage. The Mountain Side Pump Station supplies the upland areas of Mountain Side Estates. The Bonnie Brae Pump Station supplies upland areas in Bonnie Brae Subdivision, and the Lee Street Pump Station supplies upland areas on Lee Street.
Water Production
The Last Chance Basin Well Field and Salmon Creek Water Source produced 1,500 million gallons of water in 2008. The flow from each source was:
• Last Chance Basin Well Field: 1,100M gallons • Salmon Creek Pump Station: 400M gallons
The amount of water pumped by the major high elevation pump stations in 2008 was:
• Crow Hill Pump Station: 31M gallons • Cedar Park Pump Station: 20M gallons • Lena Loop Pump Station: 12M gallons • Mountain Side Pump Station: 7M gallons • Bonnie Brae Pump Station: 4M gallons

Alaska Energy Engineering LLC
City and Borough of Juneau 15 Water System Energy Audit
Energy Use per Facility
Table 2-1 provides a breakdown of the water system energy use.
Table 2-1: Annual Energy Use and Cost Summary
Usage Demand Cost Cost Cost Facility kWh kW $ ¢/kWh ¢/kgal
Last Chance Basin Well Field 1,280,000 223 $113,000 8.1 10
Salmon Creek Pump Station (Total) 1 556,000 280 $70,000 12.1 18
Salmon Creek Pump Station (CBJ) 1 136,000 - $15,000 10.2 4
Crow Hill Pump Station 149,000 48 $16,000 11.0 52
Cedar Park Pump Station 52,000 57 $12,000 16.6 60
Mountain Side Pump Station 46,000 10 $5,000 10.6 71
Lena Loop Pump Station 34,000 15 $4,000 12.1 33
Bonnie Brae Pump Station 16,000 - $2,000 11.5 50
Vaults, Reservoirs, Pump Stations 323,000 - $42,000 13.0 -
Water System Totals 2 2,500,000 - $264,000 10.4
CBJ Totals 3 2,080,000 - $209,000 9.9
1. At the Salmon Creek Pump Station, AEL&P pays for up to 3,214.2 kWh per day of pumping energy. The CBJ pays for additional pumping energy and all other loads.
2. Includes AEL&P pumping costs at Salmon Creek Pump Station. 3. Excludes AEL&P pumping costs at Salmon Creek Pump Station.
Analysis
One column in the above table lists the effective energy cost per kWh (¢/kWh), which is the sum of the energy and demand charges per kWh. A site with a significantly higher effective cost has disproportionately higher demand charges. There should be opportunities at these facilities to reduce demand and lower the energy bill.
• Cedar Park Pump Station: Has the highest effective electricity cost because the large pumps operate only a few hours each day.
• Lena Loop Pump Station: Has high effective energy costs due to oversized electric heaters that create high demand changes year-round.
• Crow Hill Pump Station: Has relatively high effective electricity cost because the high horsepower pumps operate a few hours each day. In addition, the pump station powers electric heaters in PRV vaults, which also contribute to the total demand.
• Vaults, Reservoirs, and Small Pump Stations: These facilities consume 13% of the energy, but provide no pumping. It is likely that electric heating is the main load that offers energy saving opportunities. The high effective cost (¢/kWh) is likely because monthly service charges at each facility make up a significant portion of the bill.
Alaska Energy Engineering LLC
City and Borough of Juneau 16 Water System Energy Audit
The energy cost per kgal indicates the amount of energy required to pump the water. As expected, the high elevation pump stations have higher energy costs per gallon due to the pressure requirements of lifting water to the high elevation pressure.
• The larger the pumping head, the higher the energy cost per gallon. When comparing Cedar Park and Crow Hill, the primary difference is that Cedar Park has the larger pressure gain.
• Mountain View Pump Station: Has the highest cost per kgal because the pumps operate continuously, even when flows are minimal. This added cost is not significant enough to warrant investment in a reservoir.
• Lena Loop Pump Station: Has a relatively low cost per kgal because the pumping head is smaller.
• Last Chance Basin produces water for less cost per gallon than Salmon Creek. This is due to the higher elevation of the well field, which is slightly offset by pumping to the high elevation system. Since AEL&P pays some of the pumping costs at Salmon Creek, it produces water at less cost to the CBJ than Last Chance Basin.
METHODOLOGY
Energy Conservation Opportunities (ECOs)
Energy conservation opportunities were identified by evaluating the energy systems and the operating parameters of the water system. The process for identifying the ECOs acknowledges the limitations of modifying existing buildings and systems, most of which were constructed when energy costs were much lower. The ECOs represent practical measures to improve the energy efficiency of the system.
Life Cycle Cost Analysis
The ECOs are evaluated using life cycle cost analysis to determine if an energy efficiency investment will provide a savings over a 25-year life. The analysis incorporates construction, replacement, maintenance and repair, and energy costs to determine the total cost over the life of the ECO. Future maintenance and energy cash flows are discounted to present worth using escalation factors for general inflation, energy inflation, and the value of money. The methodology is based on the National Institute of Standards and Technology (NIST) Handbook 135 – Life Cycle Cost Analysis.
Life cycle cost analysis is preferred to simple payback for facilities that have long—often perpetual—service lives. Simple payback, which compares construction cost and present energy cost, is reasonable for short time periods of 2-4 years, but yields below optimal results over longer periods because it does not properly account for the time value of money or the effect inflation has on operating budgets. Accounting for energy inflation and the cost of money properly values the true cost of facility ownership and seeks to minimize the total cost over its life.
Appendix C contains the life cycle cost calculations of each ECO.
Construction Costs
The cost estimates are derived based on a preliminary understanding of the scope of each ECO as gathered during the walk-through audit. The construction costs assume in-house labor at $60 for work typically performed by maintenance staff and contract labor for larger projects and electrical work. The estimates assume some efficiency gain by being incorporated into larger, energy efficiency or other construction projects. This will spread mobilization costs over a number of ECOs and minimize costs.
Alaska Energy Engineering LLC
City and Borough of Juneau 17 Water System Energy Audit
When ECOs are taken for implementation, the cost estimate should be revisited once the scope and preferred method of performing the work has been determined. It is possible some ECOs will not provide a life cycle savings once the scope is finalized.
Maintenance Costs
Maintenance costs are based on in-house labor using historical maintenance efforts and industry standards. Maintenance costs are determined for the 25-year life of each ECO and represent realistic levels of effort to maintain the relative systems.
Energy Analysis
The energy performance of each ECO is evaluated using operating parameters of the water system and facilities. Appendix B contains the energy analysis calculations.
Prioritization
A prioritized ranking of the ECOs was calculated for each building using the following formula:
Prioritization Factor = Life Cycle Savings / Capital Costs
This factor puts weight on the capital cost of an ECO, which is aligned with budgeting realities that allow early implementation of low cost improvements while higher cost ECOs must wait for funding and implementation.
The ECOs are grouped into the following prioritized categories:
• Behavioral or Operational: ECOs that need minimal capital investment but require operational or behavioral changes. A life cycle cost analysis is not performed of these ECOs because the energy savings is difficult to quantify and a life cycle savings is certain.
• High Priority: ECOs that require a small capital investment and offer a life cycle savings. • Medium Priority: ECOs that require a significant capital investment to provide a life cycle
savings. Some offer a substantial life cycle savings but require planning and investment to implement. Many medium priority ECOs return a high life cycle savings and offer substantial incentive to increase investment in building energy efficiency.
• Low Priority: ECOs that will save energy but do not provide a life cycle savings.
Economic Factors
Economic factors are significant to the findings and should undergo careful scrutiny.
• Nominal Interest Rate: This is the nominal rate of return on an investment without regard to inflation. The analysis uses a rate of 5.0% which is the current cost of bonds for CBJ capital improvement projects.
• Inflation Rate: This is the average inflationary change in prices over time. The analysis uses an inflation rate of 3.0% which is the consumer price index average of the past 25-years.
• Real Discount Rate: This is the actual rate of return when the inflation rate is considered. The analysis uses a real discount rate of 1.9% which is a calculated value derived from the nominal interest rate and the inflation rate.
• Economic Period: This is the period of time in which costs are considered. The analysis is based on a 25-year economic period with construction beginning in 2009.

Alaska Energy Engineering LLC
City and Borough of Juneau 18 Water System Energy Audit
Electricity
The water facilities are all–electric facilities. The electric rates applied to each site are determined by Alaska Electric Light & Power Company (AEL&P) based on the provisions of their tariff. The section for each site discusses the applicable electric rate.
AEL&P is a privately owned utility regulated by the Regulatory Commission of Alaska. Power generation facilities utilized by AEL&P include both hydroelectric and diesel plants. Currently, the hydroelectric plants generate most of the electricity and the diesel plants provide backup.
Over recent history, electricity inflation has been less than 1% per year, which has lagged general inflation. This trend has been discontinued in recent years as fuel oil price increases led to more electric heating loads. The winter of 2007/2008 is the first extended period where AEL&P had to supplement with diesel generation. This caused a temporary Power Cost Adjustment of 1.2¢ per kWh.
In the fall of 2009, the new Lake Dorothy Hydroelectric Facility will begin producing power. The power from Lake Dorothy will be more expensive than power from the existing hydroelectric facilities. It is assumed that the community will consume most of the Lake Dorothy Phase 1 power in the near future and that the blended generation cost will raise electric rates 1.5¢ per kWh. The life cycle cost analysis includes a 1.5¢/kWh increase in electric costs.
Even with Lake Dorothy, electric heating loads are likely to continue to place demands on the hydroelectric generation facilities. A recent CBJ energy balance report indicates that Juneau’s heating energy—which is currently met with fuel oil—is 175% higher than non-heating electrical energy. This is a large potential load that could convert to electricity if high fuel oil inflation occurs again. In essence, Juneau’s future electricity prices are tied to fuel oil inflation. The life cycle cost analysis uses an electric inflation of 2.5%, which is higher than the historic average to account for future electric heating price pressures.
Table 2-2: Summary of Economic and Energy Factors
Factor Rate or Cost Factor Rate or Cost
Nominal Discount Rate 5.0% Electricity Current rates + 1.5¢/kWh
General Inflation Rate 3.0% Electricity Inflation 2.5%
Real Discount Rate 1.9%

Alaska Energy Engineering LLC
City and Borough of Juneau 19 Water System Energy Audit
Section 3
Last Chance Basin Well Field
INTRODUCTION
The Last Chance Basin Well Field consists of five wells, each with a well pump located in a separate building. The wells pump ground water into a high elevation distribution system and a low elevation distribution system. The water is chlorinated prior to flowing to the distribution systems.
A single electrical service supplies energy to the well field for pumping loads, heating, and lighting. The electric service feeds a main distribution panel in the Treatment Building which distributes power to the five well buildings and the Treatment Building.
Energy Data
Electricity is billed under AEL&P’s Rate 34, Large Government, which charges for both electrical consumption (kWh) and peak electric demand (kW). Electrical consumption is the amount of energy consumed and electric demand is the rate of consumption. AEL&P determines the electric demand by averaging demand over a continuously sliding fifteen-minute window. The highest fifteen-minute average during the billing period determines the peak demand.
Table 3-1: AEL&P Large Government Rate
Charge 1 On-peak (Nov-May) Off-peak (June-Oct)
Energy Charge per kWh 4.93¢ 4.62¢
Demand Charge per kW $11.53 $7.35
Service Charge per month $99.24 $99.24
1. Currently, a Power Cost Adjustment of 1.2¢ per kWh is added to pay for diesel supplementation due to low hydroelectric water levels. That charge will end in a few months.
Four years of electrical energy usage data was obtained from AEL&P. The data and usage graphs are provided in Appendix A
Energy consumption
• From 2006 to 2008, energy consumption averaged 1,282,000 kWh per year • Energy usage varies monthly due to normal changes in water production that occur with
system demand and staging of the LCB and Salmon Creek water sources. • Energy usage is highest in the summer due to increased water demand from cruise ships and
summer tourism. • Energy usage is increasing annually even as water production has dropped. This is because
well production has been decreasing, so additional wells are being staged on earlier to protect the pumps from cavitating. A well reconditioning project is currently in progress to improve well production.
Electrical Demand
• From 2005 to 2008, monthly demand has been very consistent at an average of 223 kW.

Alaska Energy Engineering LLC
City and Borough of Juneau 20 Water System Energy Audit
Costs
• During 2007-2008, annual energy costs averaged $113,000 per year. • The monthly electric bill has the following breakdown.
1. Energy consumption (kWh) = 74%
2. Electrical demand (kW) = 25%
3. Customer charges = 1%
• The effective cost (sum of energy and demand charges) is 8.1¢ per kWh. • The well field has an annual load factor 67%, which is the ratio of the average load to the
peak load. This high load factor indicates cost efficient operations where pumps operate for long periods and are not cycled for short durations. The primary benefit of a high load factor is proportionally lower demand charges which result in a lower effective cost per kWh.
BUILDINGS
There are five ground water wells in the Last Chance Basin Well Field that supply water. Each has a well pump located in separate buildings. A Treatment Building contains the electric service, an emergency generator, and treatment systems for the low pressure system.
Building Envelopes
Description
Table 3-2: Building Envelope
Room Description (inside to outside) R-value Remarks
Wells 1 and 2 Walls Laminate panel; 1-1/2” rigid; 8” CMU R-7 Low R-value Roof Gyp. bd.; 3-1/2” rigid; 2x12 joists; plywood; metal R-21 Floor slab Concrete slab-on-grade R-2 No insulation Perimeter Concrete footing; 2” rigid, inside face R-10 Door Insulated metal door and frame R-2 No thermal break
No weather-stripping Well 3: Original Building Walls No drawing record Roof No drawing record Floor slab No drawing record Perimeter No drawing record Doors Insulated metal door and frame R-2 No thermal break
Poor weather-stripping

Alaska Energy Engineering LLC
City and Borough of Juneau 21 Water System Energy Audit
Table 3-2: Building Envelope (continued)
Room Description (inside to outside) R-value Remarks
Well 3 Addition Walls Laminate panel; 1-1/2” rigid; 8” CMU R-7 Low R-value Roof Gyp. bd.; 3-1/2” rigid; 2x12 joists; plywood; metal R-21 Floor slab Concrete slab-on-grade R-2 No insulation Perimeter Concrete footing; 2” rigid, inside face R-10 Door Insulated metal door and frame R-2 No thermal break
Poor weather-stripping Wells 4 and 5 Walls Gypsum board; 1-1/2” rigid; 8” CMU R-7 Low R-value Roof Gypsum board; 3” rigid; roof joists; plywood; metal R-18 Low R-value Floor slab Concrete slab-on-grade R-2 No insulation Perimeter Concrete footing; 2” rigid, inside face R-10 Door Insulated metal door and frame R-4 Frame w/o thermal break Treatment Building Walls Gypsum board; 1-1/2” rigid; 8” CMU R-7 Low R-value Roof Gypsum board; attic rafters, R-30 batt insulation R-32 Low R-value Floor slab Concrete slab-on-grade R-2 No insulation Perimeter Concrete footing; 2” rigid, inside face R-10 Door Insulated metal door and frame R-2 No thermal break
Poor weather-stripping
Analysis
The buildings all have similar insulation levels despite being upgraded at different times. This suggests that insulation levels have not been optimized as electricity costs have increased.
The walls and roofs are under insulated. Insulation can be added but the cost of removing items from the surfaces, adding insulation, and installing wallboard typically more than offsets the life cycle energy savings.
The floor slabs are under insulated. However, there is no economical way to add insulation to the floor slabs.
Door weather-stripping can be installed or upgraded to seal the opening, minimizing infiltration. There is no economical way to replace doors and frames with thermally broken units.
Heating Systems
Description
The buildings are heated by electric heating units. At Wells 1, 2, 4, and 5, a wall thermostat controls the heaters. At Well 3, a thermostat integral with the heater controls the heater. The thermostat setpoints varied from 65°F to 78°F.
Alaska Energy Engineering LLC
City and Borough of Juneau 22 Water System Energy Audit
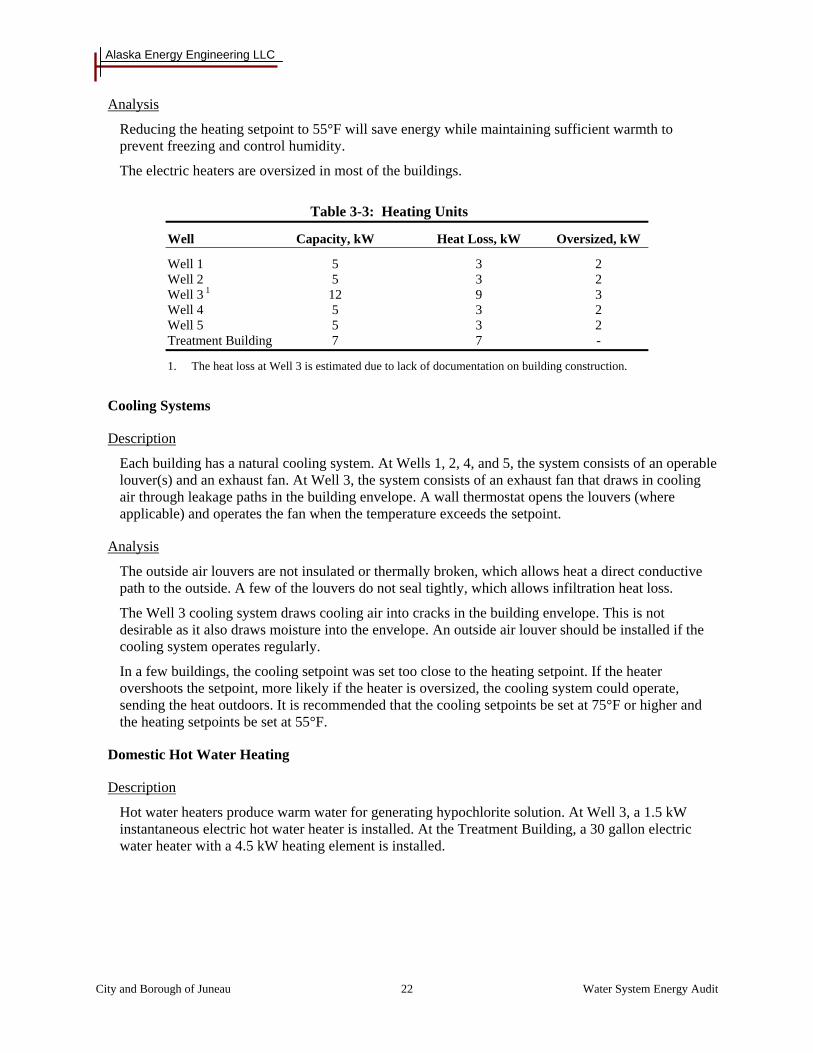
Analysis
Reducing the heating setpoint to 55°F will save energy while maintaining sufficient warmth to prevent freezing and control humidity.
The electric heaters are oversized in most of the buildings.
Table 3-3: Heating Units
Well Capacity, kW Heat Loss, kW Oversized, kW
Well 1 5 3 2 Well 2 5 3 2 Well 3 1 12 9 3 Well 4 5 3 2 Well 5 5 3 2 Treatment Building 7 7 -
1. The heat loss at Well 3 is estimated due to lack of documentation on building construction.
Cooling Systems
Description
Each building has a natural cooling system. At Wells 1, 2, 4, and 5, the system consists of an operable louver(s) and an exhaust fan. At Well 3, the system consists of an exhaust fan that draws in cooling air through leakage paths in the building envelope. A wall thermostat opens the louvers (where applicable) and operates the fan when the temperature exceeds the setpoint.
Analysis
The outside air louvers are not insulated or thermally broken, which allows heat a direct conductive path to the outside. A few of the louvers do not seal tightly, which allows infiltration heat loss.
The Well 3 cooling system draws cooling air into cracks in the building envelope. This is not desirable as it also draws moisture into the envelope. An outside air louver should be installed if the cooling system operates regularly.
In a few buildings, the cooling setpoint was set too close to the heating setpoint. If the heater overshoots the setpoint, more likely if the heater is oversized, the cooling system could operate, sending the heat outdoors. It is recommended that the cooling setpoints be set at 75°F or higher and the heating setpoints be set at 55°F.
Domestic Hot Water Heating
Description
Hot water heaters produce warm water for generating hypochlorite solution. At Well 3, a 1.5 kW instantaneous electric hot water heater is installed. At the Treatment Building, a 30 gallon electric water heater with a 4.5 kW heating element is installed.

Alaska Energy Engineering LLC
City and Borough of Juneau 23 Water System Energy Audit
Analysis
The 1.5 kW instantaneous hot water heater at Well 3 incurs lower demand charges than the 4.5 kW electric hot water heater at the Treatment Building. Both facilities produce equal size batches of hypochlorite and each heater is capable of producing enough hot water. Installing an instantaneous hot water heater at the Treatment Building will reduce demand charges.
Lighting
Description
Table 3-4: Lighting Fixtures and Lamps
Room Fixture No. / Type Lamp No. / Type Control Remarks
Well 1 Interior 4 / Surface 2 / T8 Switch - Exterior 1 / Surface 1 / MH Photocell On during daylight Well 2 Interior 4 / Surface 2 / T8 Switch - Exterior 1 / Surface 1 / MH Photocell On during daylight Well 3 Interior 7 / Surface 2 / T8 Switch - Exterior 2 / Surface 1 / MH Photocell On during daylight Well 4 Interior 2 / Surface 2 / T12 Switch Inefficient Exterior 1 / Surface 1 / MH Photocell - Well 5 Interior 2 / Surface 2 / T12 Switch Inefficient Exterior 1 / Surface 1 / MH Photocell - Treatment Building Interior 19 / Surface 2 / T12 Switch Inefficient Exterior 3 / Surface 1 / MH Photocell -
Analysis
The interior T12 lighting has a much lower efficacy than the T8 lighting. However, the lighting is used only a few hours each year and there is no economic incentive to upgrade the lighting.
Several exterior lights were on during daytime due to failure of the photocells.

Alaska Energy Engineering LLC
City and Borough of Juneau 24 Water System Energy Audit
Transformers
Description
Each building is supplied with 480V power for the pumps. A transformer is installed to step down the 480V building power to obtain 208V/120V power.
Table 3-5: Transformers
Pump Station Size Remarks
Well 1 10 kVA No replacement Well 2 10 kVA No replacement Well 3 30 kVA Less efficient Well 4 7.5 kVA No replacement Well 5 7.5 kVA No replacement Treatment Building 45 kVA Less efficient
Analysis
Transformers 15 kVA or larger can be upgraded to meet the energy efficiency requirements of NEMA Standard TP 1-2001.
PROCESS
The Last Chance Basin Well Field supplies a high elevation distribution system and a low elevation distribution system. The high elevation system serves the upland area surrounding downtown Juneau. The low elevation system supplies the city-wide distribution system. The following table shows the capacity of the each well pump and the system it supplies.
Table 3-6: Pumps
Pump Flow, GPM Head, ft Motor HP
Low Elevation System Well 1 800 115 40 Well 2 1 1,300 235 100 Well 4 1,950 66 50 Well 5 1,600 92 50 High Elevation System Well 3 (primary) 1,150 200 100 Well 2 1 1,300 235 100
1. Well 2 typically supplies the low elevation system, but has sufficient pump capacity to supply the high elevation system when needed.

Alaska Energy Engineering LLC
City and Borough of Juneau 25 Water System Energy Audit
Low Elevation System
Description
Wells 1, 2, 4, and 5 supply water to the low elevation system. Each pump has a downstream pressure reducing valve that reduces the pump outlet pressure. Typical pressure drops across each pressure reducing valve are 17 psig, 83 psig, 8 psig, and 17 psig at wells 1, 2, 4, and 5, respectively.
The water from the wells flows past the Treatment Building, where it is injected with chlorine, and continues through the Jualpa Tunnel, which provides chlorine contact time prior to entering the distribution system. The high elevation of the LCB wells would over-pressurize the low elevation system, so pressure reducing valves at Cope Park and 8th Street lower to distribution pressure.
The SCADA system sequences the low elevation pumps to meet system water demand. Operators manually set the pump flow rates and operating sequence regularly as well conditions change.
Analysis
The PRVs, which serve necessary functions of maintaining constant distribution pressure, essentially dissipate pumping energy. The amount of lost energy can be reduced by optimally sizing the pumps so there is minimal excess head at the pump discharge. Unfortunately, properly sized pumps require sufficient head to overcome well draw-down, screen accumulation, and piping pressure drop at maximum flow, so some pressure drop is necessary. An energy efficient solution is to use variable frequency drives (VFDs) to control the speed of each pump to match the system pressure and flow requirements. This will reduce both pumping energy and demand charges.
Pump 2 is sized to supply either the high or low elevation systems. When supplying the low elevation system, the pump has excess head which results in an 83 psig pressure drop across the discharge PRV. This energy penalty is substantial, and warrants using Well 2 to supply the low elevation systems only when necessary. If the pump is controlled by a VFD, the energy penalty will be substantially reduced.
High Elevation System
Description
Well 3 (primary) and Well 2 (standby) supply water to the high elevation system. Each pump has a PRV that reduces the pump outlet pressure as needed to limit well production. Typical pressure drops across each flow control valve are 6 psig and 21 psig at pumps 3, and 2, respectively.
The water is treated at Well 3, where it is injected with chlorine and pumped up into the Mill Tunnel, which provides storage for the high elevation system and fire water storage for downtown Juneau. The elevation of the Mill Tunnel is high enough to over-pressurize the high elevation system. To prevent this from occurring, there is a PRV at 8th Street that reduces to distribution pressure. Since the high elevation system supplies the Mill Tunnel on the same end as the outlet to the high elevation system (using the same pipe), chlorine levels in the Mill Tunnel are maintained by flowing water out the other end of the tunnel into the low elevation system through a PRV, where the pressure is significantly reduced to the low elevation distribution pressure.
The SCADA system operates the high elevation pumps in a Well 3 lead / Well 2 standby configuration to maintain the water elevation in the Mill Tunnel.

Alaska Energy Engineering LLC
City and Borough of Juneau 26 Water System Energy Audit
Analysis
The PRV between the high elevation and low elevation system has a large pressure drop of 87 psig. This dissipation of pumping energy, while necessary to maintain water quality in the Mill Tunnel, should be optimized so flow to the low elevation system is limited to the minimum necessary to maintain water quality.
Strategies to reduce pumping energy and demand costs by properly sizing pumps and using VFDs, as discussed for the low elevation system, are also applicable to the high pressure system.
Motors
Description
Table 3-7: Motors
Service Horsepower Efficiency New Efficiency 1 Remarks
Well 1 40 94.5% 94.1% Efficient motor Well 2 100 95.4% 95.4% Efficient motor Well 3 100 93.0% 95.4% Less efficient Well 4 50 90.2% 94.5% Less efficient Well 5 50 90.2% 94.5% Less efficient
1. New motor efficiency is based on NEMA Premium® MG-1 efficiency motors.
Analysis
The pump motors are operated a significant number of hours each year. Replacing the Pump 3, 4, and 5 motors with NEMA Premium® efficient motors will reduce energy consumption.
ENERGY CONSERVATION OPPORTUNITIES
Behavioral or Operational Energy Conservation Opportunities
Top priority should be given to the following behavioral or operational ECOs that require minimal investment and offer immediate savings. The ECOs in this group are listed from highest to lowest priority.
Last Chance Basin-1: Optimize Mill Tunnel Flow to the Low Elevation System
Purpose: Considerable pumping energy is dissipated through the Franklin Street PRV when the Mill Tunnel supplies the low elevation system. This energy loss can be minimized by optimizing the flow rate needed to maintain Mill Tunnel chlorine levels.
Scope: Monitor Mill Tunnel chlorine levels and reduce the flow from the Mill Tunnel to the low elevation system to the minimum required to maintain water quality in the tunnel.
Recommendation: This ECO is recommended without additional analysis.

Alaska Energy Engineering LLC
City and Borough of Juneau 27 Water System Energy Audit
Last Chance Basin-2: Set and Monitor Heating Setpoints
Purpose: The heating setpoints exceed the temperature needed for freeze protection and humidity control. Establishing a consistent setpoint of 55°F will save energy and provide operating personnel a consistent standard to follow.
Scope: Replace integral thermostats with wall thermostats. Reset all heating thermostats at 55°F. This ECO is applicable to all heating thermostats.
Recommendation: This ECO is recommended without additional analysis. All heating units should be controlled from a separate wall thermostat with a setpoint of 55°F. Building maintenance funds will be used for this work.
Last Chance Basin-3: Repair Exterior Lighting Photocells
Purpose: Several exterior light fixtures remain on during daylight hours. Adjusting or replacing the internal photocell on each fixture so the light turns off during daytime will save lighting energy.
Scope: Adjust or replace faulty exterior lighting photocells so the lamps are off during the day. This ECO is applicable to all buildings.
Recommendation: This ECO is recommended without additional analysis.
Last Chance Basin-4: Adjust Cooling Setpoints
Purpose: The cooling setpoints should be at least 20°F higher than the heating setpoint to prevent unintentional operation of the cooling system.
Scope: Adjust the cooling system setpoint to 75°F or higher so the cooling system does not turn on inadvertently. This ECO is applicable to Wells 1, 2, 4, and 5.
Recommendation: This ECO is recommended without additional analysis.
Last Chance Basin-5: Adjust Cooling and Emergency Generator Makeup Air Louvers
Purpose: Several louvers do not seal tightly, which allows cool, humid air to infiltrate into the building. Adjusting the louvers so they seal tight will minimize infiltration and save heating energy.
Scope: Adjust the cooling louvers so they seal tightly when closed. This ECO is applicable to all buildings except Well 3.
Recommendation: This ECO is recommended without additional analysis.
Last Chance Basin-6: Weather-strip Exterior Doors
Purpose: The weather-stripping on many of the doors is poor or does not exist. Adding weather-stripping will reduce heat loss and minimize infiltration of damp air into the building.
Scope: Replace or add door weather-stripping. This ECO is applicable to nearly all LCB doors.
Recommendation: This ECO is recommended without additional analysis. Building maintenance funds will be used for this work.

Alaska Energy Engineering LLC
City and Borough of Juneau 28 Water System Energy Audit
High Priority Energy Conservation Opportunities
High priority energy conservation opportunities provide a high life cycle savings for the relative investment. The ECOs in this group are listed from highest to lowest priority.
Last Chance Basin-7: Install VFD on Well 2 Pump
Purpose: The Well 2 pump is a constant speed pump that is sized to deliver water to either the high elevation or low elevation systems. When the well is supplying the low elevation system—most of the time—the system must drop a considerable amount of pressure through PRVs to deliver water at the distribution pressure. Installing a variable speed drive to align the pump operation with the water delivery requirements will minimize the pumping energy lost to pressure reduction.
Scope: Install a VFD to control the Well 2 pump.
Analysis: Well 2 supplied 251M gallons of water in 2008. The pump operated 3,900 hours at an average output of 482 gpm. This output is below the rated pump capacity of 1,300 gpm so considerable energy was lost to the PRVs.
The analysis assumed an average Well 2 output of 800 gpm with a discharge pressure of 2 psig. Variable speed operation will provide an annual energy savings of 277,000 kWh and 348 kW of demand and an annual cost savings of $20,900.
Energy Conservation Opportunity Construction Maintenance Energy Total LCC
Install VFD on Well 2 Pump $17,000 $2,000 ($387,000) ($368,000)
Note: Negative numbers, in parenthesis, represent savings.
Recommendation: This ECO is recommended.
Last Chance Basin-8: Install VFD and Replace Motor on Well 3 Pump
Purpose: The Well 3 pump is a constant speed pump that drops pressure through PRVs to deliver water at the distribution pressure. Installing a variable speed drive to align the pump operation with the water delivery requirements will minimize the pumping energy lost to pressure reduction. The motor is less efficient than NEMA Premium® standards.
Scope: Install a VFD and NEMA Premium® motor.
Analysis: Well 3 supplied 251M gallons of water in 2008. The pump operated 3,900 hours at an average output of 1,070 gpm.
The analysis assumed the pump will operate for longer periods at 800 gpm, which will reduce friction losses in piping and electrical demands. Variable speed operation with a more efficient motor will provide an annual savings of 37,000 kWh and 264 kW of demand and an annual cost savings of $4,900.
Energy Conservation Opportunity Construction Maintenance Energy Total LCC
Install VFD/Replace Motor on Well 3 Pump $7,000 $2,000 ($91,000) ($82,000)
Note: Negative numbers, in parenthesis, represent savings.
Recommendation: This ECO is recommended.
Alaska Energy Engineering LLC
City and Borough of Juneau 29 Water System Energy Audit
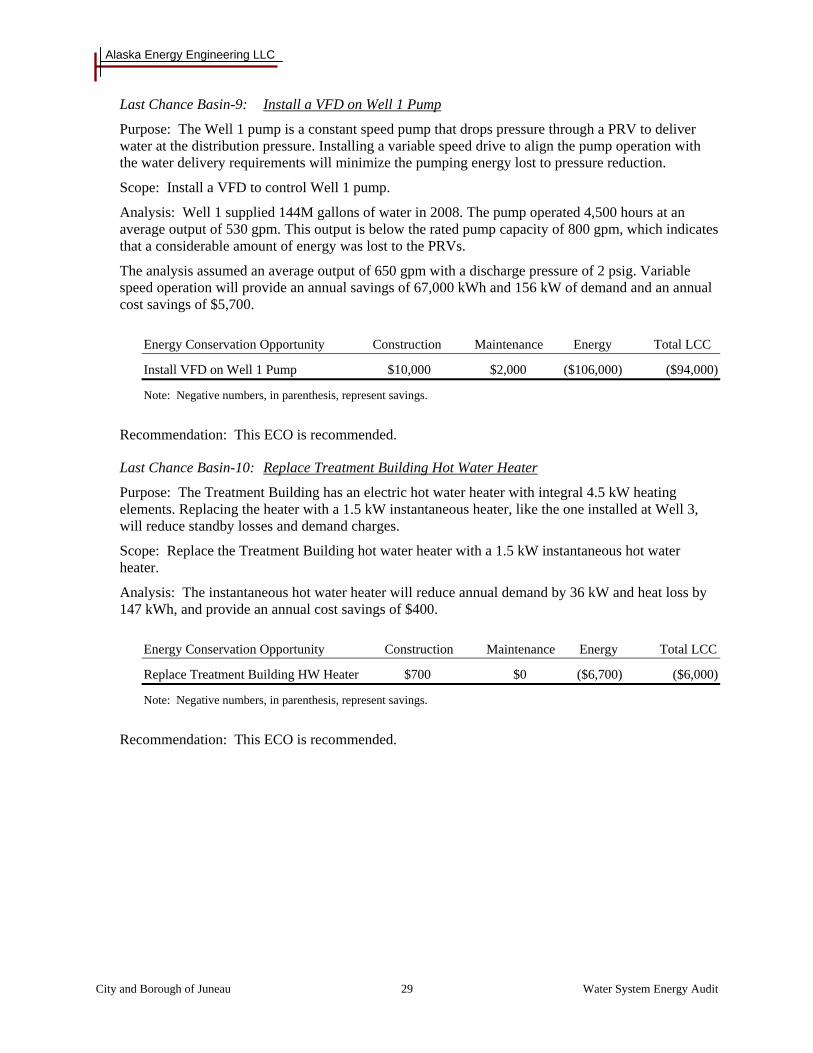
Last Chance Basin-9: Install a VFD on Well 1 Pump
Purpose: The Well 1 pump is a constant speed pump that drops pressure through a PRV to deliver water at the distribution pressure. Installing a variable speed drive to align the pump operation with the water delivery requirements will minimize the pumping energy lost to pressure reduction.
Scope: Install a VFD to control Well 1 pump.
Analysis: Well 1 supplied 144M gallons of water in 2008. The pump operated 4,500 hours at an average output of 530 gpm. This output is below the rated pump capacity of 800 gpm, which indicates that a considerable amount of energy was lost to the PRVs.
The analysis assumed an average output of 650 gpm with a discharge pressure of 2 psig. Variable speed operation will provide an annual savings of 67,000 kWh and 156 kW of demand and an annual cost savings of $5,700.
Energy Conservation Opportunity Construction Maintenance Energy Total LCC
Install VFD on Well 1 Pump $10,000 $2,000 ($106,000) ($94,000)
Note: Negative numbers, in parenthesis, represent savings.
Recommendation: This ECO is recommended.
Last Chance Basin-10: Replace Treatment Building Hot Water Heater
Purpose: The Treatment Building has an electric hot water heater with integral 4.5 kW heating elements. Replacing the heater with a 1.5 kW instantaneous heater, like the one installed at Well 3, will reduce standby losses and demand charges.
Scope: Replace the Treatment Building hot water heater with a 1.5 kW instantaneous hot water heater.
Analysis: The instantaneous hot water heater will reduce annual demand by 36 kW and heat loss by 147 kWh, and provide an annual cost savings of $400.
Energy Conservation Opportunity Construction Maintenance Energy Total LCC
Replace Treatment Building HW Heater $700 $0 ($6,700) ($6,000)
Note: Negative numbers, in parenthesis, represent savings.
Recommendation: This ECO is recommended.

Alaska Energy Engineering LLC
City and Borough of Juneau 30 Water System Energy Audit
Last Chance Basin-11: Replace Oversize Heaters
Purpose: Most of the electric heating units are oversized, creating higher demand charges while delivering the same amount of heat as a properly sized heater. The demand charges will be reduced if properly sized heaters are installed.
Scope: Replace oversized heating units in each building with properly sized heaters.
• Well 1: Replace a 5 kW heater with a 3 kW heater. • Well 2: Replace a 5 kW heater with a 3 kW heater. • Well 3: Replace a 7.5 kW heater with a 3 kW heater. Install a second 3 kW heater with
separate thermostat. Stage the thermostat setpoints at 58°F and 53°F. • Well 4: Replace a 5 kW heater with a 3 kW heater. • Well 5: Replace a 5 kW heater with a 3 kW heater.
Analysis: The properly sized heaters will reduce annual demand by 115 kW and provide an annual cost savings of $1,100.
Energy Conservation Opportunity Construction Maintenance Energy Total LCC
Replace Oversize Heaters $3,700 $0 ($20,900) ($17,200)
Note: Negative numbers, in parenthesis, represent savings.
Recommendation: This ECO is recommended.
Medium Priority Energy Conservation Opportunities
Medium priority energy conservation opportunities provide life cycle energy savings that exceed the investment cost required to implement the change. The ECOs are listed from highest to lowest priority.
Last Chance Basin-12: Install VFD and Replace Motor on Well 4 Pump
Purpose: The Well 4 pump is a constant speed pump that drops pressure through PRVs to deliver water at the distribution pressure. Installing a variable speed drive to align the pump operation with the water delivery requirements will minimize the pumping energy lost to pressure reduction. The motor is less efficient than NEMA Premium® standards.
Scope: Install a VFD and NEMA Premium® motor.
Analysis: Well 4 supplied 243M gallons of water in 2008. The pump operated 7,200 hours at an average output of 560 gpm. This output is below the rated pump capacity of 1,950 gpm, which indicates that a considerable amount of energy was lost to the PRVs.
The analysis assumed an average output of 1,000 gpm with a discharge pressure of 2 psig. Variable speed operation will provide an annual savings of 43,000 kWh and 12 kW of demand and an annual cost savings of $2,800.
Energy Conservation Opportunity Construction Maintenance Energy Total LCC
Install VFD/Replace Motor on Well 3 Pump $17,000 $2,000 ($52,000) ($33,000)
Note: Negative numbers, in parenthesis, represent savings.
Recommendation: This ECO is recommended.

Alaska Energy Engineering LLC
City and Borough of Juneau 31 Water System Energy Audit
Last Chance Basin-13: Install VFD and Replace Motor on Well 5 Pump
Purpose: The Well 5 pump is a constant speed pump that drops pressure through PRVs to deliver water at the distribution pressure. Installing a variable speed drive to align the pump operation with the water delivery requirements will minimize the pumping energy lost to pressure reduction. The motor is less efficient than NEMA Premium® standards.
Scope: Install a VFD and NEMA Premium® motor.
Analysis: Well 5 supplied 148M gallons of water in 2008. The pump operated 6,000 hours at an average output of 413 gpm. This output is below the rated pump capacity of 1,600 gpm, which indicates that a considerable amount of energy was lost to the PRVs.
The analysis assumed an average output of 900 gpm with a discharge pressure of 2 psig. Variable speed operation will provide an annual savings of 37,000 kWh and 12 kW of demand and an annual cost savings of $2,400.
Energy Conservation Opportunity Construction Maintenance Energy Total LCC
Install VFD/Replace Motor on Well 5 Pump $17,000 $2,000 ($45,000) ($26,000)
Note: Negative numbers, in parenthesis, represent savings.
Recommendation: This ECO is recommended.
Last Chance Basin-14: Replace Older Transformers
Purpose: The transformers within the buildings have lower efficiencies than modern, energy efficient transformers. Replacing the transformers will save electricity.
Scope: Replace older dry-type transformers with energy efficient models.
• Well 3: Replace a 30 kVA transformer. • Treatment Building: Replace a 45 kVA transformer.
Analysis: This ECO will reduce annual transformer losses by 15,600 kWh and 21 kW in demand, and provide an annual cost savings of $1,200.
Energy Conservation Opportunity Construction Maintenance Energy Total LCC
Replace Older Transformers $16,500 $0 ($22,200) ($5,700)
Note: Negative numbers, in parenthesis, represent savings.
Recommendation: This ECO is recommended.

Alaska Energy Engineering LLC
City and Borough of Juneau 32 Water System Energy Audit
Last Chance Basin-15: Seal Cooling Louvers During Winter Months
Purpose: The cooling louvers are metal and provide a direct conductive path for heat to flow to the outdoors. The louver seals are poor, which allows infiltration. Installing removable, insulated panels during the winter months when cooling is not needed will reduce heating costs.
Scope: Install removable, insulated panels in the louver openings at wells 1, 2, 4, and 5.
Analysis: Insulating the louvers will save 1,049 kWh per year, reduce infiltration, and an annual cost savings of $100.
Energy Conservation Opportunity Construction Maintenance Energy Total LCC
Insulate Louvers $600 $0 ($1,200) ($600)
Note: Negative numbers, in parenthesis, represent savings.
Recommendation: This ECO is recommended.

Alaska Energy Engineering LLC
City and Borough of Juneau 33 Water System Energy Audit
Section 4
Salmon Creek Pump Station
INTRODUCTION
The Salmon Creek Pump Station has two buildings, the Point of Entry (POE) Building and the Treatment Building. The POE Building contains an emergency generator, soda ash mixing equipment, the POE vault, and a tool room. The Treatment Building consists of a pump room, control room, hypochlorite solution room, and treatment room with a lab.
The water from the Salmon Creek Dam flows into a wet well located under the Pump Station. The water is drawn out of the wet well by the pumps, it is treated with chlorine and transferred to the Salmon Creek Reservoir.
Energy Data
CBJ / AEL&P Agreement
The CBJ and AEL&P have an agreement to share the water from the Salmon Creek Dam to accommodate their electric power and water requirements. The essence of the agreement is that AEL&P has a right to generate power from all water stored behind the Salmon Creek Dam, but must pump 4.64 ft3/sec (2,322 gpm) up to the Salmon Creek Reservoir. If the CBJ requires additional water, it must pay to pump the water from the tailrace. A summary of the 1984 agreement is as follows:
• AEL&P repaired the Salmon Creek Conduit from the Upper Powerhouse near the dam to the Lower Powerhouse adjacent to the Salmon Creek Pump Station. CBJ contributed $900,000 toward the repair.
• CBJ has a water right of 4.64 ft3/sec (2,322 gpm) of pressurized water from the conduit delivered to the Salmon Creek Reservoir.
• At their option, AEL&P can pass the CBJ water right of 4.64 ft3/sec (2,322 gpm) through the Salmon Creek Powerhouse and pay to pump the water from the powerhouse tailrace to the Salmon Creek Reservoir.
• The CBJ has a right to additional water from the powerhouse tailrace, but must pay the pumping costs.
• The agreement will expire in 2014.
The agreement does not provide information on the water rights of the parties or why the CBJ right to water from the pressurized conduit from Salmon Creek Reservoir was set at 2,322 gpm. The CBJ would have a substantial incentive to maximize water production from Salmon Creek if it had a larger right to pressurized water from the conduit.

Alaska Energy Engineering LLC
City and Borough of Juneau 34 Water System Energy Audit
CBJ Electric Bills
There are four electric meters on the building. One measures total consumption and the other three measure usage by each of the three pumps. AEL&P pays the first 3,124.2 kWh of pumping energy and the CBJ pays for additional pumping energy and all other usage (heat, treatment, lights, etc.).
AEL&P was not able to provide a basis for the 3,142.2 kWh credit amount. A calculation based on the installed pumps and motors (2,322 gpm @ 270’ of head; hp = 83%; hm = 95%) determined that AEL&P should pay for 3598.5 kWh per day.
The CBJ portion of the electric use is billed under AEL&P’s Rate 31, Small Government which charges for electrical consumption (kWh). There are no demand charges, even though the usage justifies the facility being on a demand rate. This is likely because the agreement does not provide a mechanism for assigning demand charges to either party.
Table 4-1: AEL&P Small Government Rate
Charge 1 On-peak (Nov-May) Off-peak (June-Oct)
Energy Charge per kWh 2 9.33¢ 7.42¢
Service Charge per month $18.80 $18.80
1. Currently, a Power Cost Adjustment of 1.2¢ per kWh is added to pay for diesel supplementation due to low hydroelectric water levels. That charge will end in a few months.
Electric Usage
Four years of electrical billing data was obtained from Alaska Electric Light & Power Company. The data and usage graphs are provided in Appendix A. On the average, AEL&P has paid for 73% of the energy consumed.
Total Energy Consumption
• From 2005 to 2008, consumption averaged 556,000 kWh per year. • Energy use varies widely from month to month with no discernable pattern. • Consumption varies from year to year as water production changes with system demand and
turbidity levels. • Consumption is highest in the beginning of the year, drops off during summer when Salmon
Creek is often to turbid to be used as a water source, and is moderate during the fall and winter.
Total Electrical Demand
• From 2005 to 2008, demand has averaged 280 kW per month. • Electric demand fluctuates widely from month to month, with up to three pumps operating
simultaneously. The effective cost is 12.8¢/kWh which is much higher than Last Change Basin’s cost of 8.6¢/kWh. The reason LCB has a lower effective cost is that usage and demand is more consistent from month to month.

Alaska Energy Engineering LLC
City and Borough of Juneau 35 Water System Energy Audit
CBJ Energy Usage and Costs
• From 2005 to 2008, consumption averaged 136,000 kWh per year. • During 2007-2008, annual energy costs averaged $14,500 per year. • The CBJ pays an effective cost of 10.2¢ per kWh.
BUILDINGS
The Salmon Creek Pump Station has two buildings, the Point of Entry (POE) Building and the Treatment Building.
Building Envelopes
Description
Table 4-2: Building Envelopes
Room Description (inside to outside) R-value Remarks
Point of Entry Building Walls Laminate panel; 1-1/2” rigid; 8” CMU R-7 Low R-value Roof Gyp. bd.; 3-1/2” rigid; 2x12 joists; plywood; metal R-21 Low R-value Floor slab Concrete slab-on-grade R-2 No insulation Perimeter Concrete footing; 2” rigid, inside face R-10 Door Insulated metal door and frame R-2 No thermal break
No weather-stripping Treatment Building Walls Laminate panel; 1-1/2” rigid; 8” CMU R-7 Low R-value Roof Gyp. bd.; 3-1/2” rigid; 2x12 joists; plywood; metal R-21 Low R-value Floor slab Concrete slab-on-grade R-2 No insulation Perimeter Concrete footing; 2” rigid, inside face R-10 Door Insulated metal door and frame R-2 No thermal break
No weather-stripping
Analysis
The buildings have similar insulation levels and are electrically heated at a current cost of 10.2¢ per kWh.
The walls and roofs are under insulated. Insulation can be added but the cost of removing items from the surfaces, adding insulation, and installing wall board typically more than offsets the life cycle energy savings.
The floor slabs are under insulated. However, there is no economical way to add insulation to the floor slabs.
Door weather-stripping can be installed or upgraded to seal the opening, minimizing infiltration. There is no economical way to replace doors and frames with thermally broken units.

Alaska Energy Engineering LLC
City and Borough of Juneau 36 Water System Energy Audit
Heating Systems
Description
The buildings are heated by electric heating units located in each room. All of the heaters are controlled by wall thermostats. The thermostat setpoints varied from 65°F to 75°F.
Analysis
Reducing the temperature to 55°F will save energy while insuring freeze protection and humidity control.
The thermostat in the POE tool room does not have temperature gradations that allow for accurately setting the temperature. Installing a temperature gage will provide operators a visual indication of room temperature.
The electric heaters are oversized. However, since there are no demand charges on the electric service, this oversizing does not result in unnecessary demand charges.
Ventilation Systems
Description
POE Building: The Soda Ash Room in the POE Building has a natural cooling system that consists of a louver. The louver does not close to reduce infiltration. The Generator Room in the POE Building has louvers for generator discharge and combustion air.
Treatment Building: The Pump Room in the Treatment Building has a ventilating unit that supplies outside air. It has a cooling coil that uses potable water to cool the air. The unit operates when the temperature exceeds the setpoint of 80°F. It rarely operates.
Analysis
The louvers are not insulated or thermally broken, which allows heat a direct conductive path to the outside. The cooling louvers should be sealed and insulated during winter months to minimize heat loss. The generator louvers should be permanently sealed and insulated until such time as the generator is returned to service.
Domestic Hot Water Heating
Description
POE Building: Two 50 gallon electric hot water heaters provide hot water for mixing soda ash.
Treatment Building: A 30 gallon electric water heater provides hot water for mixing hypochlorite solution. An instantaneous hot water heat supplies hot water to the lab.

Alaska Energy Engineering LLC
City and Borough of Juneau 37 Water System Energy Audit
Lighting
Description
Table 4-3: Lighting Fixtures and Lamps
Room Fixture No. / Type Lamp No. / Type Control Remarks
POE Building
Interior 11 / Surface 2 / T12 Switch -
Exterior 2 / Surface 1 / MH Photocell -
Treatment Building
Interior 19/ Surface 2 / T12 Switch -
Exterior 2 / Surface 1 / MH Photocell On during daylight
Analysis
The interior T12 lighting has a much lower efficacy than T8 lighting. However, the lighting is used a few hours each year and there is no economic incentive to upgrade the lighting.
The photocells are out of adjustment on one of exterior fixtures.
Transformers
Description
Each building is supplied with 480V power. A transformer is installed to step down the 480V building power to obtain 208V/120V power.
Table 4-4: Transformers
Pump Station Size Remarks
POE Building 24 kVA Less efficient
Treatment Building 75 kVA Less efficient
Analysis
The transformers are less efficient that current models.
Appliances
Description
The Treatment Building lab has a refrigerator and a freezer.
Analysis
The freezer is used to store ice but the ice is never used.

Alaska Energy Engineering LLC
City and Borough of Juneau 38 Water System Energy Audit
PROCESS
Description
The Salmon Creek Pump Station transfers water to the Salmon Creek Reservoir, which supplies the low elevation distribution system. There are three pumps that draw water from the wet well fed by AEL&P’s Lower Powerhouse tailrace.
Table 4-5: Pumps
Pump Flow, GPM Head, ft Motor HP
Pump 1 2,100 270 200
Pump 2 2,100 270 200
Pump 3 2,100 270 200
Sodium hypochlorite solution is produced on-site by dissolving salt in softened water, which results in a concentrated brine solution. The solution is electrolyzed and forms a sodium hypochlorite solution in water.
Soda ash is injected into the water to reduce its aggressiveness.
The water from the pumps is injected with chlorine and pumped to the Salmon Creek Reservoir which provides chlorine contact time. The water flows from the reservoir and is injected with soda ash prior to entering the low elevation system. The reservoir elevation over-pressurizes the low elevation system, so pressure reducing valves in the POE Building reduce to distribution pressure.
The SCADA system provides lead/lag/standby sequencing of the pumps to maintain the level in the reservoir. The SCADA maintains the flow from the reservoir to the distribution system at a manually set rate.
Analysis
Since the agreement with AEL&P essentially pays for the operation of the lead pump, there is no incentive to convert it to variable speed. However, if a substantial number lag pump operating hours occurs, there is incentive to convert one pump to variable speed so it can operate at slower flow rates for longer periods, saving energy.
Current operations are not taking full advantage of the 3,142 kWh per day that AEL&P must pay. If the Salmon Creek source is available 10 months of the year, this comes to 943,000 kWh per year. The pumps currently use 420,000 kWh per year, or approximately 45% of the “free” energy.

Alaska Energy Engineering LLC
City and Borough of Juneau 39 Water System Energy Audit
Motors
Description
Table 4-6: Motors
Service Horsepower Efficiency New Efficiency 1 Remarks
Pump 1 200 93.6% 96.2% Less efficient
Pump 2 200 93.6% 96.2% Less efficient
Pump 3 200 95.0% 96.2% Less efficient
Soda Ash Pump 1 75.5% 85.5% Less efficient
1. New motor efficiency is based on NEMA Premium® MG-1 efficiency motors.
Analysis
Since AEL&P pays for the majority of the pumping, there is little incentive to upgrade the pump motors.
Upgrading the motor on the soda ash injection pump, which operates a significant number of hours, will reduce energy costs.
ENERGY CONSERVATION OPPORTUNITIES
Behavioral or Operational Energy Conservation Opportunities
Top priority should be given to the following behavioral or operational ECOs that require minimal investment and offer immediate savings. The ECOs in this group are listed from highest to lowest priority.
Salmon Creek-1: Turn Off Freezer
Purpose: The freezer in the Treatment Building lab stores ice that has no purpose. Turning off the freezer will save energy.
Scope: Turn off the freezer in the Treatment Building lab.
Recommendation: This ECO is recommended without additional analysis.
Salmon Creek-2: Set and Monitor Heating Setpoints
Purpose: The heating setpoints exceed the temperature needed for freeze protection and humidity control. Establishing a consistent setpoint of 55°F will save energy and provide operating personnel a consistent standard to follow.
Scope: Reset all heating thermostats at 55°F. This ECO is applicable to all heating thermostats.
Recommendation: This ECO is recommended without additional analysis. All heating units should be controlled from a separate wall thermostat with a setpoint of 55°F.

Alaska Energy Engineering LLC
City and Borough of Juneau 40 Water System Energy Audit
Salmon Creek-3: Adjust Exterior Lighting Photocells
Purpose: Several exterior light fixtures remain on during daylight hours. Adjusting or replacing the internal photocell on each fixture so the light turns off during daytime will save lighting energy.
Scope: Adjust or replace faulty exterior lighting photocells so the lamps are off during the day. This ECO is applicable to all buildings.
Recommendation: This ECO is recommended without additional analysis.
Salmon Creek-4: Weather-strip Exterior Doors
Purpose: The weather-stripping on many of the doors is poor or does not exist. Adding weather-stripping will reduce heat loss and minimize infiltration of damp air into the building.
Scope: Replace or add door weather-stripping. This ECO is applicable to nearly all doors.
Recommendation: This ECO is recommended without additional analysis.
Salmon Creek-5: Replace Heating Thermostat
Purpose: The heating units are most efficiently controlled from wall thermostats with temperature setpoint markings.
Scope: Replace thermostats where applicable so all heating units are controlled from wall mounted thermostats with temperature setpoints. This ECO is applicable to the POE Tool Room.
Analysis: This ECO is recommended without additional analysis.
High Priority Energy Conservation Opportunities
High priority energy conservation opportunities provide a high life cycle savings for the relative investment. The ECOs in this group are listed from highest to lowest priority.
Salmon Creek-6: Seal Cooling and Emergency Generator Louvers
Purpose: The louvers offer a direct conductive path for heat to flow to the outdoors. Sealing the louver with insulated panels will reduce heating costs. The insulated panel on the cooling louver should be removable so the louver can function during warmer weather.
Scope: Install insulated panels in the louver openings. This is applicable to the POE Building.
Analysis: Sealing the louvers will save 2,600 kWh in heating energy annually and provide an annual cost savings of $300.
Energy Conservation Opportunity Construction Maintenance Energy Total LCC
Insulate Louvers $1,200 $0 ($5,700) ($4,500)
Note: Negative numbers, in parenthesis, represent savings.
Recommendation: This ECO is recommended.

Alaska Energy Engineering LLC
City and Borough of Juneau 41 Water System Energy Audit
Salmon Creek-7: Replace Soda Ash Motor
Purpose: Motor efficiencies have improved in recent years due to national standards such as NEMA Premium® MG-1. Replacing less efficient motors with NEMA Premium® motors will reduce energy costs.
Scope: Replace inefficient motors with NEMA Premium® MG-1compliant efficient motors. This ECO is applicable to the soda ash motor. There is no incentive to upgrade the pump motors because AEL&P pays the majority of the pumping costs.
Analysis: Replacing the soda ash motor will reduce energy consumption by 846 kWh for an annual savings of $100.
Energy Conservation Opportunity Construction Maintenance Energy Total LCC
Replace Soda Ash Motor $600 $0 ($1,900) ($1,300)
Note: Negative numbers, in parenthesis, represent savings.
Recommendation: This ECO is recommended.
Medium Priority Energy Conservation Opportunities
Medium priority energy conservation opportunities provide life cycle energy savings that exceed the investment cost required to implement the change. These ECOs have a lower priority because the cost of implementation is high or the savings is minimal.
Salmon Creek-8: Replace Older Transformers
Purpose: The transformers within the buildings have lower efficiencies than modern, energy efficient transformers. Replacing the transformers will save electricity.
Scope: Replace older dry-type transformers with newer energy efficient models.
• POE Building: Replace a 24 kVA transformer. • Pump Station: Replace a 75 kVA transformer.
Analysis: This ECO will reduce annual transformer losses by 19,400 kWh and 2 kW in demand and provide an annual cost savings of $2,300.
Energy Conservation Opportunity Construction Maintenance Energy Total LCC
Replace Older Transformers $15,700 $0 ($42,600) ($26,900)
Note: Negative numbers, in parenthesis, represent savings.
Recommendation: This ECO is recommended.

Alaska Energy Engineering LLC
City and Borough of Juneau 42 Water System Energy Audit
Low Priority Energy Conservation Opportunities
Low priority energy conservation opportunities do not offer a life cycle energy savings and are not recommended.
Salmon Creek-9: Maximize AEL&P Paid Pumping
Purpose: The CBJ is utilizing only 45% of the pumping energy that AEL&P is obligated to pay under their agreement (assuming the Salmon Creek source is available for 10 months of the year). Increasing water production from Salmon Creek will save energy costs.
Scope: Maximize the AEL&P benefit by operating the pumps for 24 pump-hours each day.
Analysis: Maximizing the AEL&P paid pumping will use an additional 523,000 kWh. This will displace production at Last Chance Basin with an annual cost savings of $33,000 and a life cycle energy savings of $153,000 until the agreement expires in 2014.
This ECO is not achievable due to systemic limitations on how much water can be supplied by Salmon Creek. An analysis to determine if Salmon Creek production can be increased is beyond the scope of this energy audit. However, there is financial incentive to evaluate if changes in the distribution system can be made to increase Salmon Creek production.
Recommendation: This ECO is not recommended because it is not feasible to increase Salmon Creek production. It is recommended that an evaluation be performed to determine if changes in the distribution system can be made to increase Salmon Creek production.

Alaska Energy Engineering LLC
City and Borough of Juneau 43 Water System Energy Audit
Section 5
Crow Hill Pump Station
INTRODUCTION
The Crow Hill Pump Station consists of two pumps that supply water from the low elevation distribution system to the Crow Hill Reservoir, which supplies the high elevation areas in Douglas.
Energy Data
The Pump Station is billed for electricity under AEL&P’s Rate 91, Off-Peak Service which has two different rate structures. During peak hours of 6:00 am to 10:00 pm, both electrical consumption (kWh) and peak electric demand (kW) are billed. During off-peak hours of 10:00 pm to 6:00 am, only electrical consumption (kWh) is charged. Electrical consumption is the amount of energy consumed and electric demand is the rate of consumption. AEL&P determines the electric demand by averaging demand over a continuously sliding fifteen-minute window. The highest fifteen-minute average during the billing period determines the peak demand. Table 5-1 lists the current electric charges:
Table 5-1: AEL&P Off Peak Service Rate
Charge 1 On-peak (Nov-May) Off-peak (June-Oct)
Service Charge per month $26.12 $26.12
Off-Peak (10:00 pm to 6:00 am)
Energy Charge per kWh 6.14¢ 6.14¢
On-Peak (6:00 am to 10:00 pm)
Energy Charge per kWh 4.93¢ 4.62¢
Demand Charge per kW $11.53 $7.35
1. Currently, a Power Cost Adjustment of 1.2¢ per kWh is added to pay for diesel supplementation due to low hydroelectric water levels. That charge will end in a few months.
The Off-peak Rate has higher energy costs, which are typically more than offset by the lack of demand charges. Thus, the off-peak rate can offer savings if most of the load is shifted to off-peak hours. Unfortunately, the pumps are being operated during on-peak hours causing the station to incur the same demand charges as the firm power rate. In addition, several vaults and the Crow Hill reservoir are also powered from the Pump Station. Heaters at these sites also increase the on-peak energy and demand charges. AEL&P billing records show an average of 5,000 kWh on-peak and 9,000 kWh off-peak.

Alaska Energy Engineering LLC
City and Borough of Juneau 44 Water System Energy Audit
When loads are operated during peak hours, regular demand charges are assessed, negating the primary benefit of the off-peak rate. This is causing the Off-peak Rate to cost more than the regular rate. The energy costs for the pump station under the different rates are:
• All Loads Shifted to Off-peak Rate: $10,300 • Regular Rates: $14,900 • Current Operating Strategy (On-peak and Off-peak Loads): $15,700 per year
Four years of electrical energy usage data was obtained from AEL&P. The data and usage graphs are provided in Appendix A
Energy consumption
• From 2005 to 2008, consumption averaged 148,500 kWh per year. • Consumption has decreased from 2005 to 2208, which indicates that less water is being
pumped. • Energy consumption is highest in the winter due to water use for freeze protection.
Electrical Demand
• From 2005 to 2008, demand averaged 48 kW per month. • The demand was very inconsistent. This is likely due to irregularities in pump testing and the
electric heating loads of the vaults and reservoir.
Costs
• During 2007-2008, annual energy costs averaged $15,700 per year. • The monthly electric bill has the following breakdown.
1. Energy consumption (kWh) = 55%
2. Electrical demand (kW) = 37%
3. Customer charges = 8%
• Electricity has an effective cost (sum of energy and demand charges) of 11.0¢ per kWh. • The pump station has an annual load factor 34%. This is the ratio of the average load (kW) to
the peak load (kW). This is a low load factor that indicates the pumps are not operated many hours, but they have a high load when they are operated. A low load factor causes demand charges to make up a disproportionately high portion of the electric bill.
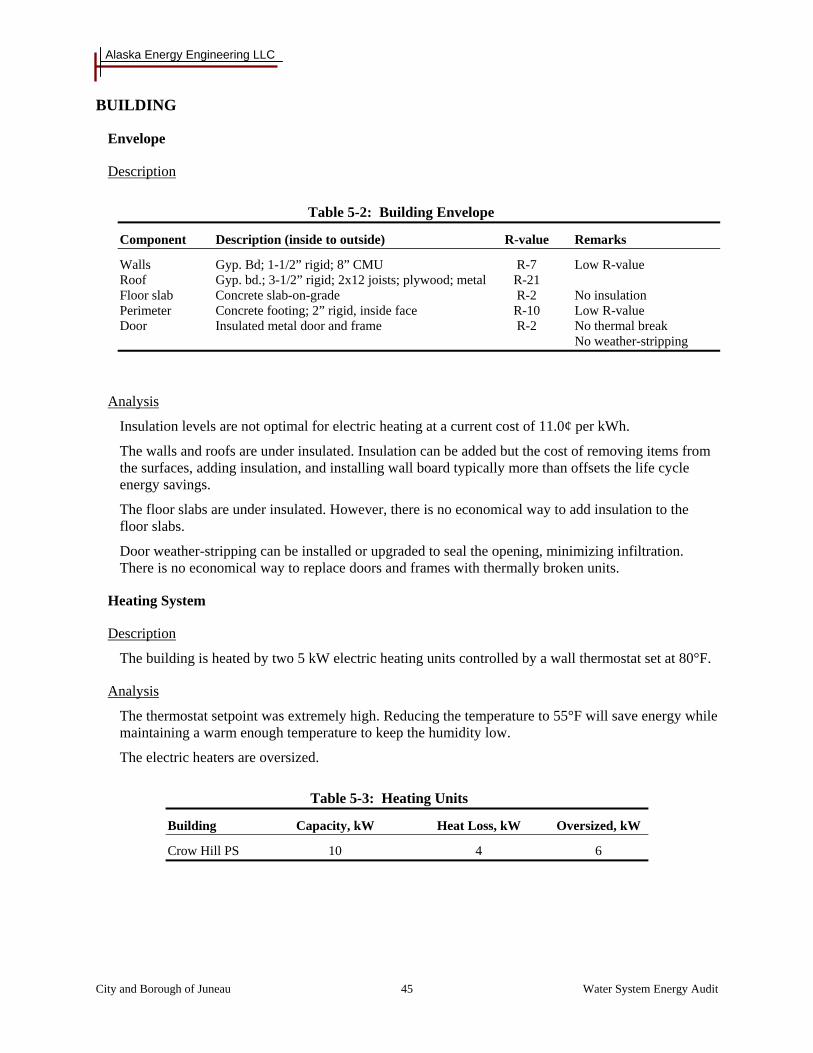
Alaska Energy Engineering LLC
City and Borough of Juneau 45 Water System Energy Audit
BUILDING
Envelope
Description
Table 5-2: Building Envelope
Component Description (inside to outside) R-value Remarks
Walls Gyp. Bd; 1-1/2” rigid; 8” CMU R-7 Low R-value Roof Gyp. bd.; 3-1/2” rigid; 2x12 joists; plywood; metal R-21 Floor slab Concrete slab-on-grade R-2 No insulation Perimeter Concrete footing; 2” rigid, inside face R-10 Low R-value Door Insulated metal door and frame R-2 No thermal break
No weather-stripping
Analysis
Insulation levels are not optimal for electric heating at a current cost of 11.0¢ per kWh.
The walls and roofs are under insulated. Insulation can be added but the cost of removing items from the surfaces, adding insulation, and installing wall board typically more than offsets the life cycle energy savings.
The floor slabs are under insulated. However, there is no economical way to add insulation to the floor slabs.
Door weather-stripping can be installed or upgraded to seal the opening, minimizing infiltration. There is no economical way to replace doors and frames with thermally broken units.
Heating System
Description
The building is heated by two 5 kW electric heating units controlled by a wall thermostat set at 80°F.
Analysis
The thermostat setpoint was extremely high. Reducing the temperature to 55°F will save energy while maintaining a warm enough temperature to keep the humidity low.
The electric heaters are oversized.
Table 5-3: Heating Units
Building Capacity, kW Heat Loss, kW Oversized, kW
Crow Hill PS 10 4 6

Alaska Energy Engineering LLC
City and Borough of Juneau 46 Water System Energy Audit
Cooling System
Description
The building has a natural cooling system consisting of a cabinet exhaust fan and a makeup air louver with automatic damper. The same thermostat that controls the heaters operates the exhaust fan and opens the damper when the temperature exceeds the setpoint.
Analysis
The relief air louver is not insulated or thermally broken, which allows heat a direct conductive path to the outside.
Lighting
Description
Table 5-4: Lighting Fixtures and Lamps
Room Fixture No. / Type Lamp No. / Type Control Remarks
Interior 9 / Surface 2 / T12 Switch Inefficient
Exterior 2 / Surface 1 / MH Photocell -
Analysis
The interior T12 lighting has a much lower efficacy than T8 lighting. However, the lighting is used only a few hours each year and there is no economic incentive to upgrade the lighting.
Transformer
Description
The building is supplied with 480V power for the pumps. A 7.5 kVA transformer is installed to step down the 480V building power to obtain 208V/120V power.

Alaska Energy Engineering LLC
City and Borough of Juneau 47 Water System Energy Audit
PROCESS
Description
The Crow Hill Pump Station supplies the Crow Hill Reservoir and the high elevation distribution system in Douglas. There are two pumps, operated in a lead/standby configuration.
Table 5-5: Pumps
Pump Flow, GPM Head, ft Motor HP
Pump 1 400 375 60
Pump 2 400 375 60
Each pump has a downstream pressure reducing valve that reduces the pump outlet pressure to system pressure. Typical pressure drop across each flow control valve is 15 psig.
The SCADA system sequences the pumps to fill the reservoir each night. This operating sequence was set up to take advantage of AEL&P’s off-peak rate.
Analysis
The reason for using PRVs to limit the pump output is not apparent. The valves essentially dissipate pumping energy that could be utilized to increase flow rate and fill the reservoir quicker.
If the PRVs are used to limit flow, the amount of lost energy can be reduced by optimally sizing the pumps so there is minimal excess head at the pump discharge. Another solution is to use variable frequency drives (VFDs) to control the speed of each pump to match the system pressure and flow requirements. This will allow the pumps to fill the reservoir over a longer period, reducing both pumping energy and demand charges.
Motors
Description
Table 5-6: Motor Table
Service Horsepower Efficiency New Efficiency 1 Remarks
Pump 1 60 91.0% 95.0% Less efficient
Pump 2 60 91.0% 95.0% Less efficient
1. New motor efficiency is based on NEMA Premium® MG-1 efficiency motors.
Analysis
The pump motors are not as efficient as current standards. Replacing the motors with NEMA Premium® efficient motors will reduce energy consumption and demand charges.

Alaska Energy Engineering LLC
City and Borough of Juneau 48 Water System Energy Audit
ENERGY CONSERVATION OPPORTUNITIES
Behavioral or Operational Energy Conservation Opportunities
Top priority should be given to the following behavioral or operational ECOs that require minimal investment and offer immediate savings. The ECOs in this group are listed from highest to lowest priority.
Crow Hill-1: Change the Electric Rate
Purpose: The Pump Station is on the Off-peak Rate but is not taking full advantage of the rate because there are significant on-peak loads and the pumps are tested on-peak. Both increase demand charges.
Scope: Change the electric rate to normal firm power.
Analysis: Electrical costs for the off-peak rate are $15,800 and per year. If the pump station was on normal firm rates, the costs would be $14,900 per year. Putting the pump station on normal firm power rates will save $900 per year.
Recommendation: Change the electric billing rate from off-peak to the normal firm power rate (Schedule 34 – Large Government).
Crow Hill-2: Set and Monitor Heating Setpoints
Purpose: The heating setpoint exceeds the temperature needed for freeze protection and humidity control. Establishing a consistent setpoint of 55°F will save energy and provide operating personnel a consistent standard to follow.
Scope: Reset the heating thermostat to 55°F.
Recommendation: This ECO is recommended without additional analysis.
Crow Hill-3: Weather-strip Exterior Doors
Purpose: The weather-stripping on the door is poor or does not exist. Adding weather-stripping will reduce heat loss and minimize infiltration of damp air into the building.
Scope: Replace or add door weather-stripping.
Recommendation: This ECO is recommended without additional analysis.

Alaska Energy Engineering LLC
City and Borough of Juneau 49 Water System Energy Audit
High Priority Energy Conservation Opportunities
High priority energy conservation opportunities provide a high life cycle savings for the relative investment. The ECOs in this group are listed from highest to lowest priority.
Crow Hill-4: Replace Oversize Heaters
Purpose: The electric heater is oversized, creating higher demand charges while delivering the same amount of heat as a properly sized heater. Demand charges will be reduced if properly sized heating units are installed. Demand charges can be further reduced by installing two heaters, each sized for 50% of the heating load. The heaters will have separate thermostats so only one heater comes on most of the year.
Scope: Replace the oversized heating unit with two 50% heaters, each controlled from a separate thermostat. Set the heater setpoints at 58°F and 52°F to reduce demand charges during warmer months.
Analysis: Replacing the heating units will reduce annual demand by 82 kW and annual costs by $800.
Energy Conservation Opportunity Construction Maintenance Energy Total LCC
Replace Oversized Heating Unit $1,100 $0 ($14,900) ($13,800)
Note: Negative numbers, in parenthesis, represent savings.
Recommendation: This ECO is recommended.
Crow Hill-5: Seal Cooling Louvers During Winter Months
Purpose: The cooling louver provides a direct conductive path for heat to flow to the outdoors. Installing removable, insulated panels during the winter months when cooling is not needed will reduce heating costs.
Scope: Install removable, insulated panels in the louver openings.
Analysis: Insulating the louvers will reduce annual heating energy by 647 kWh and annual energy costs by $40.
Energy Conservation Opportunity Construction Maintenance Energy Total LCC
Seal Cooling Louvers During Winter Months $100 $0 ($800) ($700)
Note: Negative numbers, in parenthesis, represent savings.
Recommendation: This ECO is recommended.

Alaska Energy Engineering LLC
City and Borough of Juneau 50 Water System Energy Audit
Medium Priority Energy Conservation Opportunities
Medium priority energy conservation opportunities provide life cycle energy savings that exceed the investment cost required to implement the change. These ECOs have a lower priority because the cost of implementation is high or the savings is minimal.
The ECOs in this group are listed from highest to lowest priority.
Crow Hill-6: Install VFDs and Replace Motors on Pumps
Purpose: The pump motors are less efficient than NEMA Premium motors. The pumps operate at constant speed with a PRV on the pump discharge to supply water at the distribution pressure. Variable speed pumping will eliminate the loss of pump energy through the PRV and allow for longer reservoir fill times, decreasing piping friction and demand charges.
Scope: Upgrade the pump motors to NEMA Premium and install a VFD on each pump to allow variable speed operation.
Analysis: The pumps are operating at 400 gpm to fill the reservoir. A VFD will allow slower reservoir filling, which will reduce pipe friction and demand charges. The analysis is based on filling the reservoir at 200 gpm. The VFD and efficient motors will reduce annual energy use by 8,610 kWh, demand by 216 kW, and costs by $2,700.
Energy Conservation Opportunity Construction Maintenance Energy Total LCC
Install VFD and Replace Motors on Pumps $33,400 $2,300 ($49,300) ($13,600)
Note: Negative numbers, in parenthesis, represent savings.
Recommendation: This ECO is recommended.
Low Priority Energy Conservation Opportunities
Low priority energy conservation opportunities do not offer a life cycle energy savings and are not recommended.
Crow Hill-7: Replace Pump Motors
Purpose: Motor efficiencies have improved in recent years due to standards such as NEMA Premium MG-1. Replacing less efficient motors with NEMA Premium motor will reduce energy and demand costs.
Scope: Replace the pump motors with energy efficient motors.
Recommendation: This ECO is not recommended. ECO Crow Hill – 5 is recommended in its place.

Alaska Energy Engineering LLC
City and Borough of Juneau 51 Water System Energy Audit
Section 6
Cedar Park Pump Station
INTRODUCTION
The Cedar Park Pump Station consists of two pumps that supply water from the low elevation distribution system to the West Juneau Reservoir and the high elevation system in West Juneau.
Energy Data
Electricity is billed under AEL&P’s Rate 34, Large Government, which charges for both electrical consumption (kWh) and peak electric demand (kW). Electrical consumption is the amount of energy consumed and electric demand is the rate of consumption. AEL&P determines the electric demand by averaging demand over a continuously sliding fifteen-minute window. The highest fifteen-minute average during the billing period determines the peak demand.
Table 6-1: AEL&P Large Government Rate
Charge 1 On-peak (Nov-May) Off-peak (June-Oct)
Energy Charge per kWh 4.93¢ 4.62¢
Demand Charge per kW $11.53 $7.35
Service Charge per month $99.24 $99.24
1. Currently, a Power Cost Adjustment of 1.2¢ per kWh is added to pay for diesel supplementation due to low hydroelectric water levels. That charge will end in a few months.
Four years of electrical energy usage data was obtained from AEL&P. The data and usage graphs are provided in Appendix A
Energy consumption
• From 2005 to 2007, consumption averaged 57,400 kWh per year. • Consumption increased in 2008 to 74,000 kWh because a new area was added to the high
elevation system. • Usage is highest in the winter due to water use for freeze protection.
Electrical Demand
• From 2005 to 2008, demand has averaged 57 kW per month. • The demand is very consistent. • The monthly demand is 10 kW above the demand created by the pumps and other loads
within the building. The site investigation failed to turn up the source of this load.
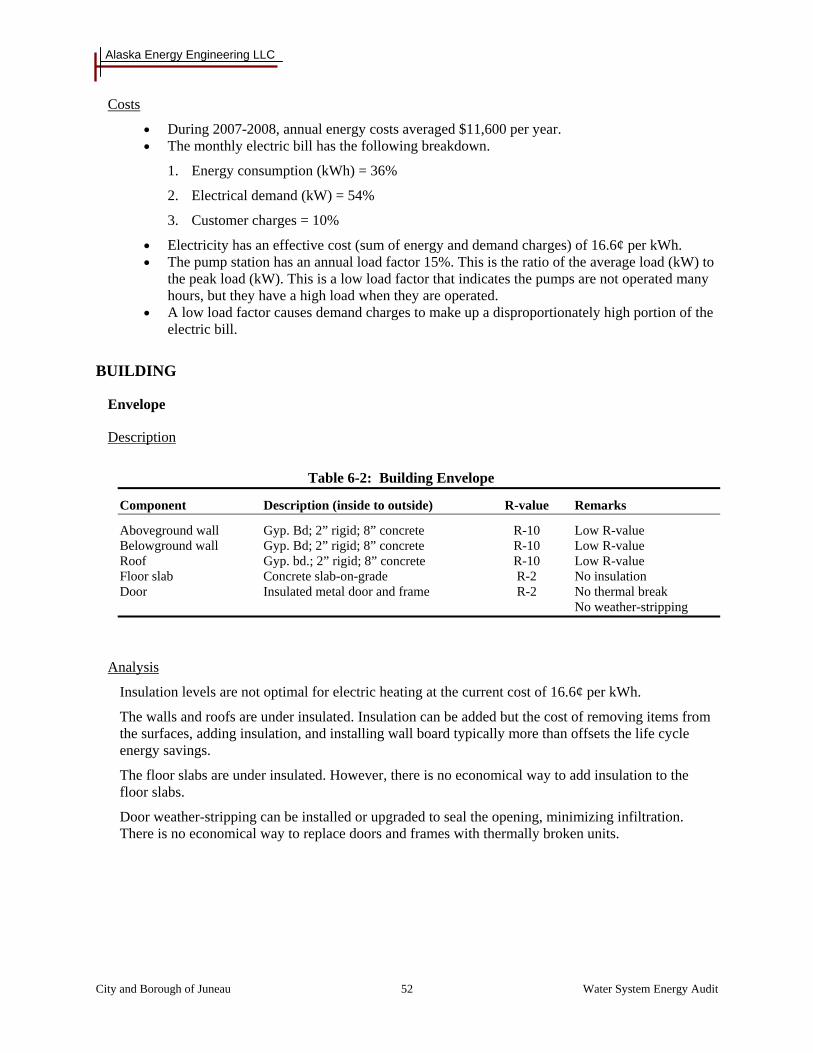
Alaska Energy Engineering LLC
City and Borough of Juneau 52 Water System Energy Audit
Costs
• During 2007-2008, annual energy costs averaged $11,600 per year. • The monthly electric bill has the following breakdown.
1. Energy consumption (kWh) = 36%
2. Electrical demand (kW) = 54%
3. Customer charges = 10%
• Electricity has an effective cost (sum of energy and demand charges) of 16.6¢ per kWh. • The pump station has an annual load factor 15%. This is the ratio of the average load (kW) to
the peak load (kW). This is a low load factor that indicates the pumps are not operated many hours, but they have a high load when they are operated.
• A low load factor causes demand charges to make up a disproportionately high portion of the electric bill.
BUILDING
Envelope
Description
Table 6-2: Building Envelope
Component Description (inside to outside) R-value Remarks
Aboveground wall Gyp. Bd; 2” rigid; 8” concrete R-10 Low R-value Belowground wall Gyp. Bd; 2” rigid; 8” concrete R-10 Low R-value Roof Gyp. bd.; 2” rigid; 8” concrete R-10 Low R-value Floor slab Concrete slab-on-grade R-2 No insulation Door Insulated metal door and frame R-2 No thermal break
No weather-stripping
Analysis
Insulation levels are not optimal for electric heating at the current cost of 16.6¢ per kWh.
The walls and roofs are under insulated. Insulation can be added but the cost of removing items from the surfaces, adding insulation, and installing wall board typically more than offsets the life cycle energy savings.
The floor slabs are under insulated. However, there is no economical way to add insulation to the floor slabs.
Door weather-stripping can be installed or upgraded to seal the opening, minimizing infiltration. There is no economical way to replace doors and frames with thermally broken units.
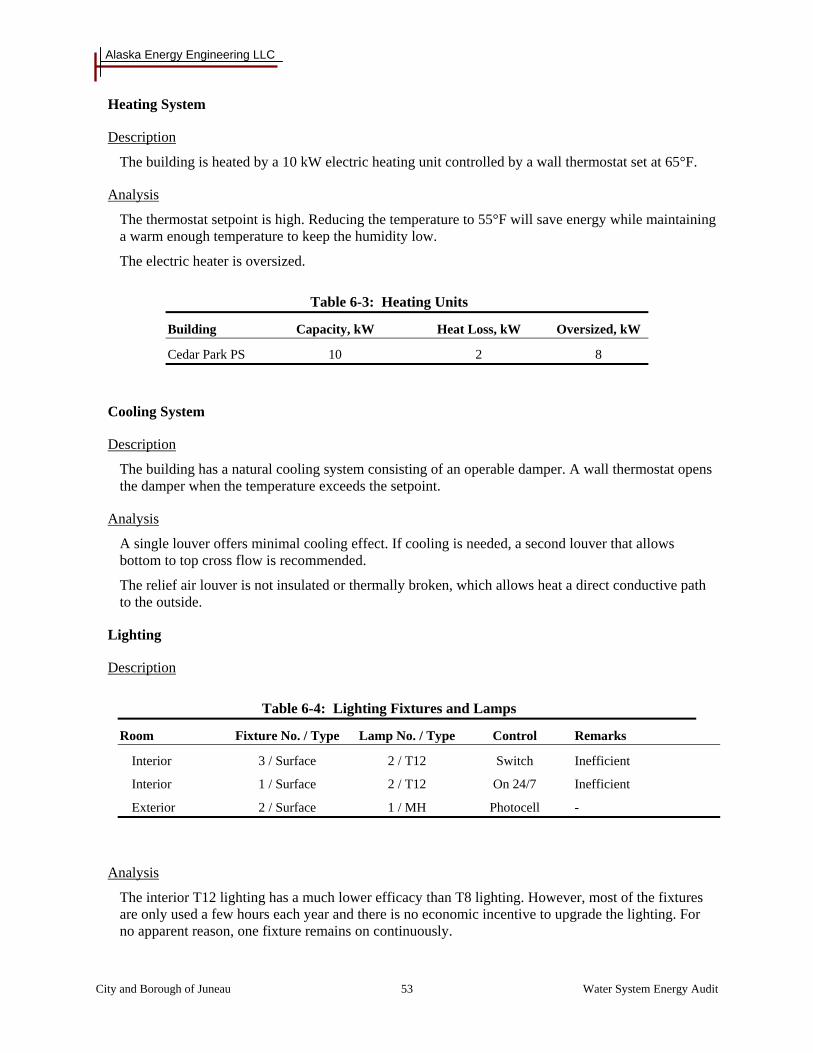
Alaska Energy Engineering LLC
City and Borough of Juneau 53 Water System Energy Audit
Heating System
Description
The building is heated by a 10 kW electric heating unit controlled by a wall thermostat set at 65°F.
Analysis
The thermostat setpoint is high. Reducing the temperature to 55°F will save energy while maintaining a warm enough temperature to keep the humidity low.
The electric heater is oversized.
Table 6-3: Heating Units
Building Capacity, kW Heat Loss, kW Oversized, kW
Cedar Park PS 10 2 8
Cooling System
Description
The building has a natural cooling system consisting of an operable damper. A wall thermostat opens the damper when the temperature exceeds the setpoint.
Analysis
A single louver offers minimal cooling effect. If cooling is needed, a second louver that allows bottom to top cross flow is recommended.
The relief air louver is not insulated or thermally broken, which allows heat a direct conductive path to the outside.
Lighting
Description
Table 6-4: Lighting Fixtures and Lamps
Room Fixture No. / Type Lamp No. / Type Control Remarks
Interior 3 / Surface 2 / T12 Switch Inefficient
Interior 1 / Surface 2 / T12 On 24/7 Inefficient
Exterior 2 / Surface 1 / MH Photocell -
Analysis
The interior T12 lighting has a much lower efficacy than T8 lighting. However, most of the fixtures are only used a few hours each year and there is no economic incentive to upgrade the lighting. For no apparent reason, one fixture remains on continuously.

Alaska Energy Engineering LLC
City and Borough of Juneau 54 Water System Energy Audit
Transformer
Description
The building is supplied with 480V power for the pumps. A 10 kVA transformer is installed to step down the 480V building power to obtain 208V/120V power.
PROCESS
Description
The Cedar Park Pump Station supplies the West Juneau Reservoir and a high elevation distribution system in Douglas. There are two pumps, operated in a lead/standby configuration.
Table 6-5: Pumps
Pump Flow, GPM Head, ft Motor HP
Pump 1 275 420 50
Pump 1 275 420 50
Each pump has a downstream PRV that reduces the pump outlet pressure to maintain the rated flow. Typical pressure drops across each flow control valve are 15 psig.
The SCADA system sequences the pumps in a lead/standby configuration to fill the reservoir each night.
Analysis
The reason for using PRVs to limit the pump output is not apparent. The valves essentially dissipate pumping energy that could be utilized to increase flow rate and fill the reservoir quicker.
If it is necessary to limit the flow rate, the amount of lost energy can be reduced by optimally sizing the pumps so there is minimal excess head at the pump discharge. Another solution is to use variable frequency drives (VFDs) to control the speed of each pump to match the system pressure and flow requirements. This will allow the pumps to fill the reservoir over a longer period, reducing both pumping energy and demand charges.
Motors
Description
Table 6-6: Motors
Service Horsepower Efficiency New Efficiency 1 Remarks
Pump 1 50 89.5% 94.5% Less efficient
Pump 2 50 89.5% 94.5% Less efficient
1. New motor efficiency is based on NEMA Premium® MG-1 efficiency motors.

Alaska Energy Engineering LLC
City and Borough of Juneau 55 Water System Energy Audit
Analysis
The pump motors are not as efficient as current standards. Replacing the motors with NEMA Premium® efficient motors will reduce energy consumption and demand charges.
ENERGY CONSERVATION OPPORTUNITIES
Behavioral or Operational Energy Conservation Opportunities
Top priority should be given to the following behavioral or operational ECOs that require minimal investment and offer immediate savings. The ECOs in this group are listed from highest to lowest priority.
Cedar Park-1: Set and Monitor Heating Setpoints
Purpose: The heating setpoint exceeds the temperature needed for freeze protection and humidity control. Establishing a consistent setpoint of 55°F will save energy and provide operating personnel a consistent standard to follow.
Scope: Reset the heating thermostat to 55°F.
Recommendation: This ECO is recommended without additional analysis.
Cedar Park-2: Weather-strip Exterior Doors
Purpose: The weather-stripping on the door is poor or does not exist. Adding weather-stripping will reduce heat loss and minimize infiltration of damp air into the building.
Scope: Replace or add door weather-stripping.
Recommendation: This ECO is recommended without additional analysis.
High Priority Energy Conservation Opportunities
High priority energy conservation opportunities provide a high life cycle savings for the relative investment. The ECOs in this group are listed from highest to lowest priority.
Cedar Park-3: Replace Oversize Heaters
Purpose: The electric heating unit is oversized, creating higher demand charges while delivering the same amount of heat as a properly sized heater. The demand charges will be lower if a properly sized heater is installed.
Scope: Replace a 10 kW heater with a 2 kW heater.
Analysis: Replacing the heater will reduce annual demand charges by 96 kW and costs by $900.
Energy Conservation Opportunity Construction Maintenance Energy Total LCC
Replace Oversize Heaters $500 $0 ($17,400) ($16,900)
Note: Negative numbers, in parenthesis, represent savings.
Recommendation: This ECO is recommended.

Alaska Energy Engineering LLC
City and Borough of Juneau 56 Water System Energy Audit
Cedar Park-4: Change Lighting Control
Purpose: One light fixture is on continuously for no apparent reason. Putting the fixture on the circuit controlled by the wall switch will save energy.
Scope: Place a light fixture on the circuit controlled by the wall switch.
Analysis: Turning off the fixture will reduce annual energy use by 828 kWh and cost by $50.
Energy Conservation Opportunity Construction Maintenance Energy Total LCC
Control Light Fixture $200 $0 ($1,000) ($800)
Note: Negative numbers, in parenthesis, represent savings.
Recommendation: This ECO is recommended.
Cedar Park-5: Seal Cooling Louver During Winter Months
Purpose: The cooling louver provides a direct conductive path for heat to flow to the outdoors. Installing removable, insulated panels during the winter months when cooling is not needed will reduce heating costs.
Scope: Install removable, insulated panels in the louver openings.
Analysis: Insulating the louver will reduce annual energy use by 216 kWh and cost by $15.
Energy Conservation Opportunity Construction Maintenance Energy Total LCC
Insulate Louvers $100 $0 ($300) ($200)
Note: Negative numbers, in parenthesis, represent savings.
Recommendation: This ECO is recommended.

Alaska Energy Engineering LLC
City and Borough of Juneau 57 Water System Energy Audit
Medium Priority Energy Conservation Opportunities
Medium priority energy conservation opportunities provide life cycle energy savings that exceed the investment cost required to implement the change. These ECOs have a lower priority because the cost of implementation is high or the savings is minimal.
The ECOs in this group are listed from highest to lowest priority.
Cedar Park-6: Install VFD and Replace Motors on Pumps
Purpose: The pumps are constant speed pumps with less efficient motors that drop pressure through a PRV to deliver water at the distribution pressure. Replacing the motors and installing VFDs to convert to variable flow will reduce pumping energy and demand costs.
Scope: Replace the motors with NEMA Premium motors, install a VFD for each pump, and convert to variable speed pumping.
Analysis: The pumps are operating at 275 gpm to fill the reservoir. A VFD will allow slower reservoir filling, which will reduce pipe friction and demand charges. The analysis is based on filling the reservoir at 150 gpm. The VFD and efficient motors will reduce annual energy use by 6,700 kWh, demand by 216 kW, and cost by $2,500.
Energy Conservation Opportunity Construction Maintenance Energy Total LCC
Install VFD/Replace Motor on Pumps $31,000 $2,300 ($47,000) ($13,700)
Note: Negative numbers, in parenthesis, represent savings.
Recommendation: This ECO is recommended.
Low Priority Energy Conservation Opportunities
Low priority energy conservation opportunities do not offer a life cycle energy savings and are not recommended.
Cedar Park-7: Replace Pump Motors
Purpose: Motor efficiencies have improved in recent years due to standards such as NEMA Premium MG-1. Replacing less efficient motors with NEMA Premium motor will reduce energy and demand costs.
Scope: Replace the pump motors with energy efficient motors.
Recommendation: This ECO is not recommended. ECO Cedar Park – 4 is recommended in its place.

Alaska Energy Engineering LLC
City and Borough of Juneau 58 Water System Energy Audit
This page intentionally left blank

Alaska Energy Engineering LLC
City and Borough of Juneau 59 Water System Energy Audit
Section 7
Bonnie Brae Pump Station
INTRODUCTION
The Bonnie Brae Pump Station consists of two pumps that supply water from the low elevation distribution system to the higher elevation system in Bonnie Brae Subdivision.
Energy Data
The Pump Station is billed for electricity under AEL&P’s Rate 31, Small Government which charges for electrical consumption (kWh). Table 7-1 lists the current electric charges:
Table 7-1: AEL&P Small Government Rate
Charge 1 On-peak (Nov-May) Off-peak (June-Oct)
Energy Charge per kWh 9.33¢ 7.42¢
Service Charge per month $18.80 $18.80
1. Currently, a Power Cost Adjustment of 1.2¢ per kWh is added to pay for diesel supplementation due to low hydroelectric water levels. That charge will end in a few months.
Four years of electrical energy usage data was obtained from AEL&P. The data and usage graphs are provided in Appendix A
Energy consumption
• From 2005 to 2007, consumption averaged 14,600 kWh per year. • Consumption was lower in 2005 but has been consistent from 2006 to 2008. • Usage is highest in the winter due to water use for freeze protection.
Costs
• During 2007-2008, annual energy costs averaged $1,800 per year. • Electricity has an effective cost of 11.5¢ per kWh.

Alaska Energy Engineering LLC
City and Borough of Juneau 60 Water System Energy Audit
BUILDING
Envelope
Description
Table 7-2: Building Envelope
Component Description (inside to outside) R-value Remarks
Wall Gyp. Bd; 3/12” batt, wood cladding R-14 Low R-value Roof Gyp. bd.; 7-1/2” batt, ¾” plywood roof R-22 Low R-value Floor slab Concrete slab-on-grade R-2 No insulation Door Insulated metal door and frame R-2 No thermal break
No weather-stripping
Analysis
Insulation levels are not optimal for electric heating at the current cost of 11.5¢ per kWh.
The walls and roofs are under insulated. Insulation can be added but the cost of removing items from the surfaces, adding insulation, and installing wall board is prohibitive to obtaining a life cycle savings.
The floor slabs are under insulated. However, there is no economical way to add insulation to the floor slabs.
There is no economical way to replace doors and frames with thermally broken units. Door weather-stripping should be installed or upgraded to seal the opening, minimizing infiltration.
Heating System
Description
The building is heated by a 6 kW electric heating unit controlled by an integral thermostat set at 62°F.
Analysis
The thermostat setpoint is high. Reducing the temperature to 55°F will save energy while maintaining a warm enough temperature to keep the humidity low.
Integral thermostats offer poor control of the heater because they do not have temperature graduations and are influenced by the heat output of the heater. Wall thermostats are recommended.
The electric heater is oversized. It is not creating excessive demand charges because the Pump Station is not on the demand rate.

Alaska Energy Engineering LLC
City and Borough of Juneau 61 Water System Energy Audit
Lighting
Description
Table 7-3: Lighting Fixtures and Lamps
Room Fixture No. / Type Lamp No. / Type Control Remarks
Interior 4 / Surface 1 / 60W incandescent Switch Inefficient
Exterior 1 / Surface 1 / 60W incandescent Photocell Inefficient
Analysis
The interior incandescent lighting has a much lower efficacy than fluorescent T8 lighting. However, most of the fixtures are only used a few hours each year and there is no economic incentive to upgrade the lighting.
Transformer
Description
The building is supplied with 480V power for the pumps. A 15 kVA transformer is installed to step down the 480V building power to obtain 208V/120V power.
Analysis
The transformer is less efficient than current models.
PROCESS
Description
The Bonnie Brae Pump Station supplies the higher elevation areas of Bonnie Brae. There is no data available on the pumps and their capacity. System pressure is maintained by two hydro pneumatic tanks located within the Pump Station. Local controls sequence the pumps in a lead/lag configuration to maintain system pressure.
Analysis
The pumps typically operate for only 2 to 5 minutes each cycle. Since the station is not on the demand rate, this low load factor does not create excessive demand charges.

Alaska Energy Engineering LLC
City and Borough of Juneau 62 Water System Energy Audit
Motors
Description
Table 7-4: Motors
Service Horsepower Efficiency New Efficiency 1 Remarks
Pump 1 5 84.0% 89.5% Less efficient
Pump 2 5 84.0% 89.5% Less efficient
1. New motor efficiency is based on NEMA Premium® MG-1 efficiency motors.
Analysis
The pump motors are not as efficient as current standards. Replacing the motors with NEMA Premium® efficient motors will reduce energy consumption and demand charges.
ENERGY CONSERVATION OPPORTUNITIES
Behavioral or Operational Energy Conservation Opportunities
Top priority should be given to the following behavioral or operational ECOs that require minimal investment and offer immediate savings. The ECOs in this group are listed from highest to lowest priority.
Bonnie Brae-1: Set and Monitor Heating Setpoints
Purpose: The heating setpoint exceeds the temperature needed for freeze protection and humidity control. Establishing a consistent setpoint of 55°F will save energy and provide operating personnel a consistent standard to follow.
Scope: Reset the heating thermostat to 55°F.
Recommendation: This ECO is recommended without additional analysis.
Bonnie Brae-2: Weather-strip Exterior Doors
Purpose: The weather-stripping on the door is poor or does not exist. Adding weather-stripping will reduce heat loss and minimize infiltration of damp air into the building.
Scope: Replace or add door weather-stripping.
Recommendation: This ECO is recommended without additional analysis.

Alaska Energy Engineering LLC
City and Borough of Juneau 63 Water System Energy Audit
Medium Priority Energy Conservation Opportunities
Medium priority energy conservation opportunities provide life cycle energy savings that exceed the investment cost required to implement the change. These ECOs have a lower priority because the cost of implementation is high or the savings is minimal.
The ECOs in this group are listed from highest to lowest priority.
Bonnie Brae-3: Replace Older Transformer
Purpose: The transformer has a lower efficiency than modern, energy efficient transformers. Replacing the transformer will save electricity.
Scope: Replace older dry-type transformer with a newer energy efficient model.
Analysis: Replacing the transformer will reduce annual energy consumption by 3,900 kWh and cost by $400.
Energy Conservation Opportunity Construction Maintenance Energy Total LCC
Replace 15 kW Transformer $5,800 $0 ($7,300) ($1,500)
Note: Negative numbers, in parenthesis, represent savings.
Recommendation: This ECO is recommended.
Low Priority Energy Conservation Opportunities
Low priority energy conservation opportunities do not offer a life cycle energy savings and are not recommended.
Bonnie Brae-4: Replace Pump Motors
Purpose: Motor efficiencies have improved in recent years due to standards such as NEMA Premium MG-1. Replacing less efficient motors with NEMA Premium motor will reduce energy and demand costs.
Scope: Replace the pump motors with energy efficient motors.
Analysis: Replacing the moots will reduce annual energy use by 286 kWh and cost by $40. This is not sufficient savings to offset the cost of replacement.
Energy Conservation Opportunity Construction Maintenance Energy Total LCC
Upgrade Pump Motors $1,600 $0 ($500) $1,100
Note: Negative numbers, in parenthesis, represent savings.
Recommendation: This ECO is not recommended.

Alaska Energy Engineering LLC
City and Borough of Juneau 64 Water System Energy Audit
This page intentionally left blank

Alaska Energy Engineering LLC
City and Borough of Juneau 65 Water System Energy Audit
Section 8
Mountain Side Pump Station
INTRODUCTION
The Mountain Side Pump Station consists of two pumps that supply water from the low elevation distribution system to the high elevation areas of Mountain Side Estates.
Energy Data
The Pump Station is billed for electricity under AEL&P’s Rate 34, Large Government which charges for both electrical consumption (kWh) and peak electric demand (kW). Electrical consumption is the amount of energy consumed and electric demand is the rate of consumption. AEL&P determines the electric demand by averaging demand over a continuously sliding fifteen-minute window. The highest fifteen-minute average during the billing period determines the peak demand. Table 8-1 lists the current electric charges:
Table 8-1: AEL&P Large Government Rate
Charge 1 On-peak (Nov-May) Off-peak (June-Oct)
Energy Charge per kWh 4.93¢ 4.62¢
Demand Charge per kW $11.53 $7.35
Service Charge per month $99.24 $99.24
Four years of electrical energy usage data was obtained from AEL&P. The data and usage graphs are provided in Appendix A
Energy consumption
• From 2006 to 2008, consumption averaged 46,400 kWh per year. • Consumption was consistent during this period. • Usage is slightly higher in the winter due to water use for freeze protection.
Electrical Demand
• From 2005 to 2008, demand has averaged 10 kW per month. • The demand is mostly consistent. There are a few months each year where it spikes, due to
simultaneous operation of two or three pumps. This likely occurs during flushing of the water mains.

Alaska Energy Engineering LLC
City and Borough of Juneau 66 Water System Energy Audit
Costs
• During 2007-2008, annual energy costs averaged $5,200 per year. • The monthly electric bill has the following breakdown.
1. Energy consumption (kWh) = 57%
2. Electrical demand (kW) = 20%
3. Customer charges = 23%
• Electricity has an effective cost (sum of energy and demand charges) of 10.6¢ per kWh. • The pump station has an annual load factor of 62%. This is the ratio of the average load (kW)
to the peak load (kW). This is a high load factor that indicates the pumps are operating for long periods.
• This service could be changed to AEL&P Rate 31, Small Commercial with demand charges. This will reduce the effective cost to 9.0 ¢/kWh, saving $800 per year.
BUILDING
Envelope
Description
Table 8-2: Building Envelope
Component Description (inside to outside) R-value Remarks
Walls Gyp. Bd; 1-1/2” rigid; 8” CMU R-7 Low R-value Roof Gyp. bd.; 3-1/2” rigid; 2x12 joists; plywood; metal R-21 Floor slab Concrete slab-on-grade R-2 No insulation Perimeter Concrete footing; 2” rigid, inside face R-10 Low R-value Door Insulated metal door and frame R-2 No thermal break
No weather-stripping
Analysis
Insulation levels are not optimal for electric heating at the current cost of 10.6¢ per kWh.
The walls and roofs are under insulated. Insulation can be added but the cost of removing items from the surfaces, adding insulation, and installing wall board is prohibitive to obtaining a life cycle savings.
The floor slabs are under insulated. However, there is no economical way to add insulation to the floor slabs.
There is no economical way to replace doors and frames with thermally broken units. Door weather-stripping should be installed or upgraded to seal the opening, minimizing infiltration.

Alaska Energy Engineering LLC
City and Borough of Juneau 67 Water System Energy Audit
Heating Systems
Description
The building is heated by two 3 kW electric heating units controlled by a wall thermostat set at 60°F.
Analysis
The thermostat setpoint is high. Reducing the temperature to 55°F will save energy while maintaining a warm enough temperature to keep the humidity low.
The electric heaters are oversized.
Table 8-3: Heating Units
Building Capacity, kW Heat Loss, kW Oversized, kW
Mountain Side PS 6 4 2
Cooling Systems
Description
The building has a natural cooling system consisting of a cabinet exhaust fan and a makeup air louver with automatic damper. A wall thermostat operates the exhaust fan and opens the makeup damper when the temperature exceeds the setpoint.
Analysis
The relief air louver is not insulated or thermally broken, which allows heat a direct conductive path to the outside.
Lighting
Description
Table 8-4: Lighting Fixtures and Lamps
Room Fixture No. / Type Lamp No. / Type Control Remarks
Interior 5 / Surface 2 / T8 Switch -
Exterior 2 / Surface 1 / MH Photocell -

Alaska Energy Engineering LLC
City and Borough of Juneau 68 Water System Energy Audit
Transformer
Description
The building is supplied with 480V power for the pumps. A 15 kVA transformer is installed to step down the 480V building power to obtain 208V/120V power.
Analysis
The transformer is less efficient than current models.
PROCESS
Description
The Mountain Side Pump Station supplies the high elevation distribution system in Mountain Side Estates. There are three pumps, operated in a lead/lag/standby configuration.
Table 8-5: Pumps
Pump Flow, GPM Head, ft Motor HP
Pump 1 200 125 10
Pump 2 200 125 10
Pump 3 200 125 10
System pressure and flow is maintained by continuous pump operation. Pumps 1 and 2 are variable speed pumps controlled by VFDs. Pump 3 is a constant speed pump.
The SCADA system operates the pumps in a lead/lag/standby configuration to maintain distribution pressure. Pumps 1 and 2 alternate lead/lag positions, with their speed controlled to maintain pressure. Pump 3 is always the standby pump and operates only during fire flows.
Analysis
Distribution flow rates are often less than the minimum capacity of the pumps, especially during nighttime. The VFDs turn down to minimum speed during these periods.
Motors
Description
Table 8-6: Motor Table
Service Horsepower Efficiency New Efficiency 1 Remarks
Pump 1 10 85.7% 91.7% Less efficient
Pump 2 10 85.7% 91.7% Less efficient
Pump 3 10 85.7% 91.7% Less efficient
1. New motor efficiency is based on NEMA Premium® MG-1 efficiency motors.

Alaska Energy Engineering LLC
City and Borough of Juneau 69 Water System Energy Audit
Analysis
The pump motors are not as efficient as current standards. Replacing the motors with NEMA Premium® efficient motors will reduce energy consumption and demand charges.
ENERGY CONSERVATION OPPORTUNITIES
Behavioral or Operational Energy Conservation Opportunities
Top priority should be given to the following behavioral or operational ECOs that require minimal investment and offer immediate savings. The ECOs in this group are listed from highest to lowest priority.
Mountain Side-1: Change the Electric Rate
Purpose: The pump station is currently on the Large Government Rate (Rate 34). It is eligible to be on Small Government Rate 31, which would result in a lower cost per kWh.
Scope: Change the electric service to AEL&P Rate 31, Small Government.
Analysis: Changing the electric rate will reduce annual costs by $800.
Recommendation: This ECO is recommended.
Mountain Side-2: Set and Monitor Heating Setpoints
Purpose: The heating setpoint exceeds the temperature needed for freeze protection and humidity control. Establishing a consistent setpoint of 55°F will save energy and provide operating personnel a consistent standard to follow.
Scope: Reset the heating thermostat to 55°F.
Recommendation: This ECO is recommended without additional analysis.
Mountain Side-3: Weather-strip Exterior Doors
Purpose: The weather-stripping on the door is poor or does not exist. Adding weather-stripping will reduce heat loss and minimize infiltration of damp air into the building.
Scope: Replace or add door weather-stripping.
Recommendation: This ECO is recommended without additional analysis.

Alaska Energy Engineering LLC
City and Borough of Juneau 70 Water System Energy Audit
High Priority Energy Conservation Opportunities
High priority energy conservation opportunities provide a high life cycle savings for the relative investment. The ECOs in this group are listed from highest to lowest priority.
Mountain Side-4: Replace Oversized Heaters
Purpose: The electric heating units are oversized, creating higher demand charges while delivering the same amount of heat as a properly sized heater. Reduce demand charges by replacing the oversized heaters with two properly sized heaters, each with separate thermostat.
Scope: Replace the oversized heating unit with a 2 kW heater. Install a second 2 kW heater with separate thermostat. Set the heater setpoints at 58°F and 52°F to reduce demand charges during warmer months.
Analysis: Replacing the heaters will reduce annual energy demand by 34 kW and cost by $300.
Energy Conservation Opportunity Construction Maintenance Energy Total LCC
Replace Oversized Heaters $1,100 $0 ($5,600) ($4,500)
Note: Negative numbers, in parenthesis, represent savings.
Recommendation: This ECO is recommended.
Medium Priority Energy Conservation Opportunities
Medium priority energy conservation opportunities provide life cycle energy savings that exceed the investment cost required to implement the change. These ECOs have a lower priority because the cost of implementation is high or the savings is minimal.
The ECOs in this group are listed from highest to lowest priority.
Mountain Side-5: Seal Cooling Louvers During Winter Months
Purpose: The cooling louver provides a direct conductive path for heat to flow to the outdoors. Installing removable, insulated panels during the winter months when cooling is not needed will reduce heating costs.
Scope: Install removable, insulated panels in the louver openings.
Analysis: Insulating the louvers will reduce annual energy use by 359 kWh and cost by $20.
Energy Conservation Opportunity Construction Maintenance Energy Total LCC
Seal Cooling Louver During Winter Months $200 $0 ($400) ($200)
Note: Negative numbers, in parenthesis, represent savings.
Recommendation: This ECO is recommended.

Alaska Energy Engineering LLC
City and Borough of Juneau 71 Water System Energy Audit
Low Priority Energy Conservation Opportunities
Low priority energy conservation opportunities do not offer a life cycle energy savings and are not recommended.
Mountain Side-6: Replace Older Transformer
Purpose: The transformer has a lower efficiency than modern, energy efficient transformers. Replacing the transformers will save electricity.
Scope: Replace a less efficient 15 kW transformer.
Analysis: Replacing the transformer will reduce annual energy use by 3,900 kWh, demand by 5.4 kW, and cost by $300. The energy cost savings is insufficient to offset the cost of replacement.
Energy Conservation Opportunity Construction Maintenance Energy Total LCC
Replace Transformer $5,800 $0 ($5,600) $200
Note: Negative numbers, in parenthesis, represent savings.
Recommendation: This ECO is not recommended.
Mountain Side-7: Replace Pump Motors
Purpose: Motor efficiencies have improved in recent years due to standards such as NEMA Premium MG-1. Replacing less efficient motors with NEMA Premium motor will reduce energy and demand costs.
Scope: Replace the pump motors with energy efficient motors.
Analysis: Replacing the pump motors will reduce annual energy use by 376 kWh and cost by $24. The energy cost savings is insufficient to offset the cost of replacement.
Energy Conservation Opportunity Construction Maintenance Energy Total LCC
Replace Pump Motors $2,300 $0 ($500) $1,800
Note: Negative numbers, in parenthesis, represent savings.
Recommendation: This ECO is not recommended.

Alaska Energy Engineering LLC
City and Borough of Juneau 72 Water System Energy Audit
This page intentionally left blank

Alaska Energy Engineering LLC
City and Borough of Juneau 73 Water System Energy Audit
Section 9
Lena Loop Pump Station
INTRODUCTION
The Lena Loop Pump Station consists of two pumps that supply water to the Lena Loop Reservoir which distributes water to areas at the end of the distribution system.
Energy Data
The Pump Station is billed for electricity under AEL&P’s Rate 31, Small Government which charges for both electrical consumption (kWh) and peak electric demand (kW). Electrical consumption is the amount of energy consumed and electric demand is the rate of consumption. AEL&P determines the electric demand by averaging demand over a continuously sliding fifteen-minute window. The highest fifteen-minute average during the billing period determines the peak demand. The following table lists the current electric charges:
Table 9-1: AEL&P Small Government Rate
Charge 1 On-peak (Nov-May) Off-peak (June-Oct)
Energy Charge per kWh 5.36¢ 4.75¢
Demand Charge per kW $10.27 $6.87
Service Charge per month $27.16 $27.16
Four years of electrical energy usage data was obtained from AEL&P. The data and usage graphs are provided in Appendix A
Energy consumption
• Consumption was 34,400 kWh in 2008. • Consumption has decreased significantly the past two years. There is no explanation for the
drop. • Usage is highest in the winter due to water use for freeze protection.
Electrical Demand
• From 2005 to 2008, demand has averaged 15 kW per month. • The demand is very inconsistent. This is due to operation of the two electric heaters, which
have a combined load that is greater than the lead pump.

Alaska Energy Engineering LLC
City and Borough of Juneau 74 Water System Energy Audit
Costs
• During 2007-2008, annual energy costs averaged $4,300 per year. • The monthly electric bill has the following breakdown:
1. Energy consumption (kWh) = 53%
2. Electrical demand (kW) = 39%
3. Customer charges = 8%
• Electricity has an effective cost (sum of energy and demand charges) of 12.1¢ per kWh. • The pump station has an annual load factor 37%. This is the ratio of the average load (kW) to
the peak load (kW). This is a low load factor that indicates the pumps are not operated many hours, but they have a high load when they are operated. A low load factor causes demand charges to make up a disproportionately high portion of the electric bill.
BUILDING
Envelope
Description
Table 9-2: Building Envelope
Component Description (inside to outside) R-value Remarks
Walls Gyp. Bd; 1-1/2” rigid; 8” CMU R-7 Low R-value Roof Gyp. bd.; 12 batt in attic R-30 Low R-value Floor slab Concrete slab-on-grade R-2 No insulation Perimeter Concrete footing; 2” rigid, inside face R-10 Low R-value Door Insulated metal door and frame R-2 No frame thermal break
No weather-stripping
Analysis
Insulation levels are not optimal for electric heating at the current cost of 12.1¢ per kWh.
The walls and roofs are under insulated. Insulation can be added but the cost of removing items from the surfaces, adding insulation, and installing wall board is prohibitive to obtaining a life cycle savings.
The floor slabs are under insulated. However, there is no economical way to add insulation to the floor slabs.
There is no economical way to replace doors and frames with thermally broken units. Door weather-stripping should be installed or upgraded to seal the opening, minimizing infiltration.

Alaska Energy Engineering LLC
City and Borough of Juneau 75 Water System Energy Audit
Heating Systems
Description
The building is heated by two 7.5 kW electric heating units with integral thermostats set at 70°F.
Analysis
The thermostat setpoint is extremely high. Reducing the temperature to 55°F will save energy while maintaining a warm enough temperature to keep the humidity low.
The electric heaters are oversized.
Table 9-3: Heating Units
Building Capacity, kW Heat Loss, kW Oversized, kW
Lena Loop PS 15 7 8
Cooling Systems
Description
The building has a natural cooling system consisting of an exhaust fan that discharges through an exhaust louver and automatic damper. There is no makeup air louver. A wall thermostat, set at 80°F, operates the fan and opens the damper.
Analysis
The relief air louver is not insulated or thermally broken, which allows heat a direct conductive path to the outside. The automatic damper hangs open. The lack of a makeup air louver causes the fan to draw humid makeup air through cracks in the envelope.
Lighting
Description
Table 9-4: Lighting Fixtures and Lamps
Room Fixture No. / Type Lamp No. / Type Control Remarks
Interior 12 / Surface 2 / T8 Switch -
Exterior 2 / Surface 1 / MH Photocell -

Alaska Energy Engineering LLC
City and Borough of Juneau 76 Water System Energy Audit
Transformer
Description
The building is supplied with 480V power for the pumps. A 30 kVA transformer is installed to step down the 480V building power to obtain 208V/120V power.
Analysis
The transformer meets the energy efficiency requirements of NEMA Standard TP 1-2001.
PROCESS
Description
The Lena Loop Pump Station supplies the Lena Loop Reservoir, which serves areas at the end of the distribution system. There are two pumps operate in a lead/standby configuration.
Table 9-5: Pumps
Pump Flow, GPM Head, ft Motor HP
Pump 1 250 68 10
Pump 2 250 68 10
The pumps are variable speed with VFD controllers. The SCADA system sequences the pumps in a lead/lag configuration to maintain the reservoir elevation. Speed controls have been disabled.
Analysis
The system is not making optimal use of the VFDs to fill the reservoir slowly, saving energy and demand charges.
Motors
Description
Table 9-6: Motor Table
Service Horsepower Efficiency New Efficiency 1 Remarks
Pump 1 10 91.7% 91.7% Efficient motor
Pump 2 10 91.7% 91.7% Efficient motor
1. New motor efficiency is based on NEMA Premium® MG-1 efficiency motors.
Analysis
The pump motors are energy efficient.
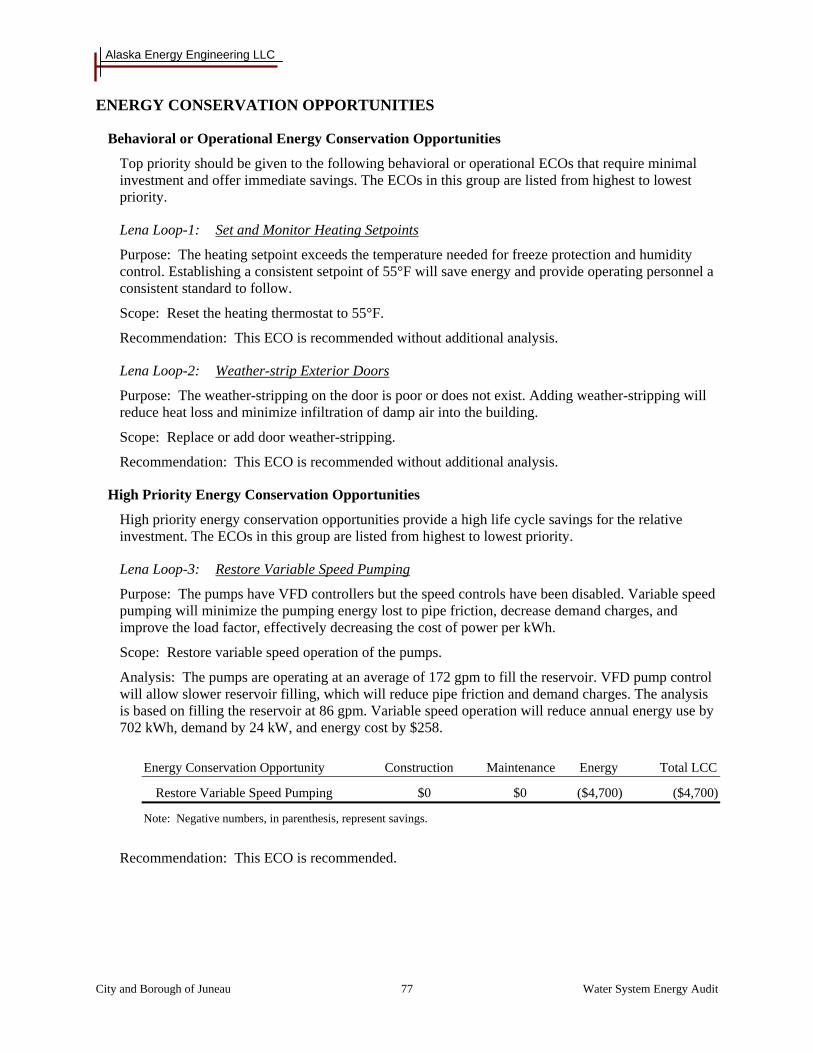
Alaska Energy Engineering LLC
City and Borough of Juneau 77 Water System Energy Audit
ENERGY CONSERVATION OPPORTUNITIES
Behavioral or Operational Energy Conservation Opportunities
Top priority should be given to the following behavioral or operational ECOs that require minimal investment and offer immediate savings. The ECOs in this group are listed from highest to lowest priority.
Lena Loop-1: Set and Monitor Heating Setpoints
Purpose: The heating setpoint exceeds the temperature needed for freeze protection and humidity control. Establishing a consistent setpoint of 55°F will save energy and provide operating personnel a consistent standard to follow.
Scope: Reset the heating thermostat to 55°F.
Recommendation: This ECO is recommended without additional analysis.
Lena Loop-2: Weather-strip Exterior Doors
Purpose: The weather-stripping on the door is poor or does not exist. Adding weather-stripping will reduce heat loss and minimize infiltration of damp air into the building.
Scope: Replace or add door weather-stripping.
Recommendation: This ECO is recommended without additional analysis.
High Priority Energy Conservation Opportunities
High priority energy conservation opportunities provide a high life cycle savings for the relative investment. The ECOs in this group are listed from highest to lowest priority.
Lena Loop-3: Restore Variable Speed Pumping
Purpose: The pumps have VFD controllers but the speed controls have been disabled. Variable speed pumping will minimize the pumping energy lost to pipe friction, decrease demand charges, and improve the load factor, effectively decreasing the cost of power per kWh.
Scope: Restore variable speed operation of the pumps.
Analysis: The pumps are operating at an average of 172 gpm to fill the reservoir. VFD pump control will allow slower reservoir filling, which will reduce pipe friction and demand charges. The analysis is based on filling the reservoir at 86 gpm. Variable speed operation will reduce annual energy use by 702 kWh, demand by 24 kW, and energy cost by $258.
Energy Conservation Opportunity Construction Maintenance Energy Total LCC
Restore Variable Speed Pumping $0 $0 ($4,700) ($4,700)
Note: Negative numbers, in parenthesis, represent savings.
Recommendation: This ECO is recommended.

Alaska Energy Engineering LLC
City and Borough of Juneau 78 Water System Energy Audit
Lena Loop-4: Replace Oversize Heaters
Purpose: The electric heating units are oversized, creating higher demand charges while delivering the same amount of heat as a properly sized heater. Reduce demand charges by replacing the oversized heaters with two properly sized heaters, each with separate thermostat.
Scope: Replace the two oversized heating units with two 2 kW heater. Install a third 3 kW heater with separate thermostat. Set the two 2 kW heater setpoints at 58°F and 55°F and set the 3 kW heater setpoint at 52°F to reduce demand charges during warmer months.
Analysis: Replacing the heaters will reduce annual demand charges by 128 kW and energy cost by $1,250.
Energy Conservation Opportunity Construction Maintenance Energy Total LCC
Replace Oversize Heaters $1,600 $0 ($21,000) ($19,400)
Note: Negative numbers, in parenthesis, represent savings.
Recommendation: This ECO is recommended.
Medium Priority Energy Conservation Opportunities
Medium priority energy conservation opportunities provide life cycle energy savings that exceed the investment cost required to implement the change. These ECOs have a lower priority because the cost of implementation is high or the savings is minimal.
The ECOs in this group are listed from highest to lowest priority.
Lena Loop-5: Seal Cooling Louvers During Winter Months
Purpose: The cooling louver provides a direct conductive path for heat to flow to the outdoors. Installing removable, insulated panels during the winter months when cooling is not needed will reduce heating costs.
Scope: Install removable, insulated panels in the louver openings.
Analysis: Insulating the louvers will reduce annual energy use by 108 kW and energy costs by $30.
Energy Conservation Opportunity Construction Maintenance Energy Total LCC
Seal Cooling Louver During Winter Months $100 $0 ($100) ($0)
Note: Negative numbers, in parenthesis, represent savings.
Recommendation: This ECO is recommended.

Alaska Energy Engineering LLC
City and Borough of Juneau Water System Energy Audit
Appendix A
Energy Use Data

Alaska Energy Engineering LLC
City and Borough of Juneau Water System Energy Audit
This page intentionally left blank
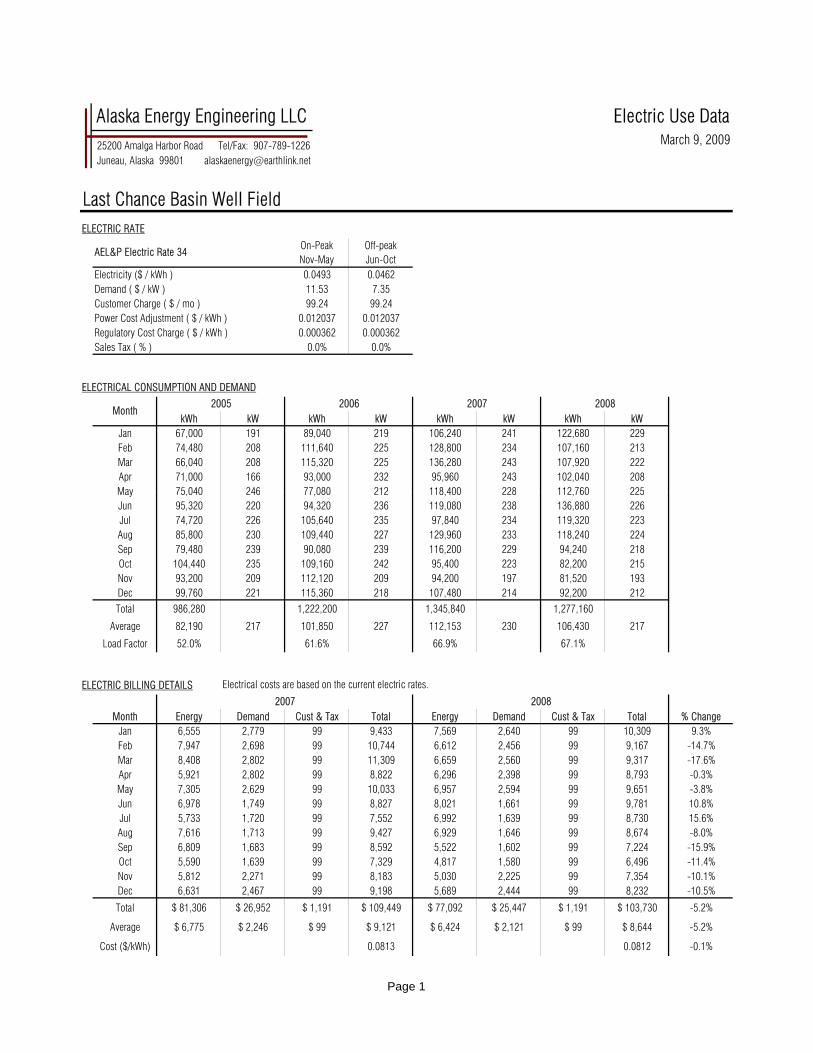
Alaska Energy Engineering LLC Electric Use Data 25200 Amalga Harbor Road Tel/Fax: 907-789-1226 Juneau, Alaska 99801 [email protected]
Last Chance Basin Well FieldELECTRIC RATE
Electricity ($ / kWh ) 0.0493 0.0462Demand ( $ / kW ) 11.53 7.35Customer Charge ( $ / mo ) 99.24 99.24Power Cost Adjustment ( $ / kWh ) 0.012037 0.012037Regulatory Cost Charge ( $ / kWh ) 0.000362 0.000362Sales Tax ( % ) 0.0% 0.0%
ELECTRICAL CONSUMPTION AND DEMAND
kWh kW kWh kW kWh kW kWh kWJan 67,000 191 89,040 219 106,240 241 122,680 229Feb 74,480 208 111,640 225 128,800 234 107,160 213Mar 66,040 208 115,320 225 136,280 243 107,920 222Apr 71,000 166 93,000 232 95,960 243 102,040 208May 75 040 246 77 080 212 118 400 228 112 760 225
March 9, 2009
2008
AEL&P Electric Rate 34On-PeakNov-May
Off-peakJun-Oct
Month2005 2006 2007
May 75,040 246 77,080 212 118,400 228 112,760 225Jun 95,320 220 94,320 236 119,080 238 136,880 226Jul 74,720 226 105,640 235 97,840 234 119,320 223Aug 85,800 230 109,440 227 129,960 233 118,240 224Sep 79,480 239 90,080 239 116,200 229 94,240 218Oct 104,440 235 109,160 242 95,400 223 82,200 215Nov 93,200 209 112,120 209 94,200 197 81,520 193Dec 99,760 221 115,360 218 107,480 214 92,200 212Total 986,280 1,222,200 1,345,840 1,277,160
Average 82,190 217 101,850 227 112,153 230 106,430 217
Load Factor 52.0% 61.6% 66.9% 67.1%
ELECTRIC BILLING DETAILS
Month Energy Demand Cust & Tax Total Energy Demand Cust & Tax Total % ChangeJan 6,555 2,779 99 9,433 7,569 2,640 99 10,309 9.3%Feb 7,947 2,698 99 10,744 6,612 2,456 99 9,167 -14.7%Mar 8,408 2,802 99 11,309 6,659 2,560 99 9,317 -17.6%Apr 5,921 2,802 99 8,822 6,296 2,398 99 8,793 -0.3%May 7,305 2,629 99 10,033 6,957 2,594 99 9,651 -3.8%Jun 6,978 1,749 99 8,827 8,021 1,661 99 9,781 10.8%Jul 5,733 1,720 99 7,552 6,992 1,639 99 8,730 15.6%Aug 7,616 1,713 99 9,427 6,929 1,646 99 8,674 -8.0%Sep 6,809 1,683 99 8,592 5,522 1,602 99 7,224 -15.9%Oct 5,590 1,639 99 7,329 4,817 1,580 99 6,496 -11.4%
Nov 5,812 2,271 99 8,183 5,030 2,225 99 7,354 -10.1%Dec 6,631 2,467 99 9,198 5,689 2,444 99 8,232 -10.5%
Total $ 81,306 $ 26,952 $ 1,191 $ 109,449 $ 77,092 $ 25,447 $ 1,191 $ 103,730 -5.2%
Average $ 6,775 $ 2,246 $ 99 $ 9,121 $ 6,424 $ 2,121 $ 99 $ 8,644 -5.2%
Cost ($/kWh) 0.0813 0.0812 -0.1%
Electrical costs are based on the current electric rates.
2007 2008
Page 1

Alaska Energy Engineering LLC Yearly Comparison 25200 Amalga Harbor Road Tel/Fax: 907-789-1226 Juneau, Alaska 99801 [email protected]
Last Chance Basin Well Field
March 9, 2009
40,000
60,000
80,000
100,000
120,000
140,000
160,000
kWh
Energy Use Comparison
#DIV/0! #DIV/0! #DIV/0! #DIV/0! #DIV/0! #DIV/0! #DIV/0! #DIV/0!
0
20,000
Jan Feb Mar Apr May Jun Jul Aug Sep Oct Nov Dec
2005 2006 2007 2008
0
50
100
150
200
250
300
Jan Feb Mar Apr May Jun Jul Aug Sep Oct Nov Dec
kW
Energy Demand Comparison
2005 2006 2007 2008
Page 2

Alaska Energy Engineering LLC Annual Comparison 25200 Amalga Harbor Road Tel/Fax: 907-789-1226 Juneau, Alaska 99801 [email protected]
Last Chance Basin Well Field
March 9, 2009
$ 2,000
$ 4,000
$ 6,000
$ 8,000
$ 10,000
$ 12,000
Energy Cost Breakdown
#DIV/0! #DIV/0! #DIV/0! #DIV/0! #DIV/0! #DIV/0! #DIV/0! #DIV/0!
$ 0Jan Feb Mar Apr May Jun Jul Aug Sep Oct Nov Dec
Energy (kWh) Costs Demand (kW) Costs Customer Charge and Taxes
170
180
190
200
210
220
230
240
0
20,000
40,000
60,000
80,000
100,000
120,000
140,000
160,000
Jan Feb Mar Apr May Jun Jul Aug Sep Oct Nov Dec
Dem
and (kW)
Ener
gy U
se (k
Wh)
Energy and Demand Comparison
Energy Demand
Page 3

Alaska Energy Engineering LLC Electric Use Data 25200 Amalga Harbor Road Tel/Fax: 907-789-1226 Juneau, Alaska 99801 [email protected]
Salmon Creek Pump StationELECTRIC RATE
Electricity ($ / kWh ) 0.0493 0.0462Demand ( $ / kW ) 11.53 7.35Customer Charge ( $ / mo ) 99.24 99.24Power Cost Adjustment ( $ / kWh ) 0.012037 0.012037Regulatory Cost Charge ( $ / kWh ) 0.000362 0.000362Sales Tax ( % ) 0.0% 0.0%
ELECTRICAL CONSUMPTION AND DEMAND
kWh kW kWh kW kWh kW kWh kWJan 0 10,720 30 67,520 331 36,480 323Feb 80,960 200 13,280 32 18,400 189 60,960 466Mar 77,600 192 14,240 304 25,280 331 69,760 194Apr 71,520 187 70,080 317 69,760 325 56,480 186May 70 720 307 57 120 314 56 800 454 28 800 314
March 10, 2009
2008
AEL&P Electric Rate 34On-PeakNov-May
Off-peakJun-Oct
Month2005 2006 2007
May 70,720 307 57,120 314 56,800 454 28,800 314Jun 63,680 317 51,840 325 55,200 320 3,360 22Jul 69,280 298 67,200 318 79,200 443 2,080 8Aug 58,400 301 64,800 315 37,120 443 49,440 312Sep 67,680 314 68,160 310 61,600 437 73,760 171Oct 6,240 173 15,840 293 44,640 440 54,400 171Nov 21,440 310 8,160 29 46,720 269 37,120 304Dec 40,960 299 56,480 454 34,560 451 30,080 318Total 628,480 497,920 596,800 502,720
Average 52,373 263 41,493 253 49,733 369 41,893 232
Load Factor 27.2% 22.4% 18.4% 24.7%
ELECTRIC BILLING DETAILS
Month Energy Demand Cust & Tax Total Energy Demand Cust & Tax Total % ChangeJan 4,166 3,816 99 8,082 2,251 3,724 99 6,074 -24.8%Feb 1,135 2,179 99 3,414 3,761 5,373 99 9,233 170.5%Mar 1,560 3,816 99 5,475 4,304 2,237 99 6,640 21.3%Apr 4,304 3,747 99 8,151 3,485 2,145 99 5,729 -29.7%May 3,505 5,235 99 8,838 1,777 3,620 99 5,497 -37.8%Jun 3,235 2,352 99 5,686 197 162 99 458 -91.9%Jul 4,641 3,256 99 7,996 122 59 99 280 -96.5%Aug 2,175 3,256 99 5,530 2,897 2,293 99 5,290 -4.4%Sep 3,610 3,212 99 6,921 4,322 1,257 99 5,678 -18.0%Oct 2,616 3,234 99 5,949 3,188 1,257 99 4,544 -23.6%
Nov 2,883 3,102 99 6,083 2,290 3,505 99 5,895 -3.1%Dec 2,132 5,200 99 7,432 1,856 3,667 99 5,622 -24.4%
Total $ 35,961 $ 42,406 $ 1,191 $ 79,557 $ 30,450 $ 29,298 $ 1,191 $ 60,939 -23.4%
Average $ 2,997 $ 3,534 $ 99 $ 6,630 $ 2,537 $ 2,442 $ 99 $ 5,078 -23.4%
Cost ($/kWh) 0.1333 0.1212 -9.1%
Electrical costs are based on the current electric rates.
2007 2008
Page 1

Alaska Energy Engineering LLC Yearly Comparison 25200 Amalga Harbor Road Tel/Fax: 907-789-1226 Juneau, Alaska 99801 [email protected]
Salmon Creek Pump Station
March 10, 2009
20,000
30,000
40,000
50,000
60,000
70,000
80,000
90,000
kWh
Energy Use Comparison
2005 2006 2007 2008
0
10,000
Jan Feb Mar Apr May Jun Jul Aug Sep Oct Nov Dec
0
50
100
150
200
250
300
350
400
450
500
Jan Feb Mar Apr May Jun Jul Aug Sep Oct Nov Dec
kW
Energy Demand Comparison2005 2006 2007 2008
Page 2
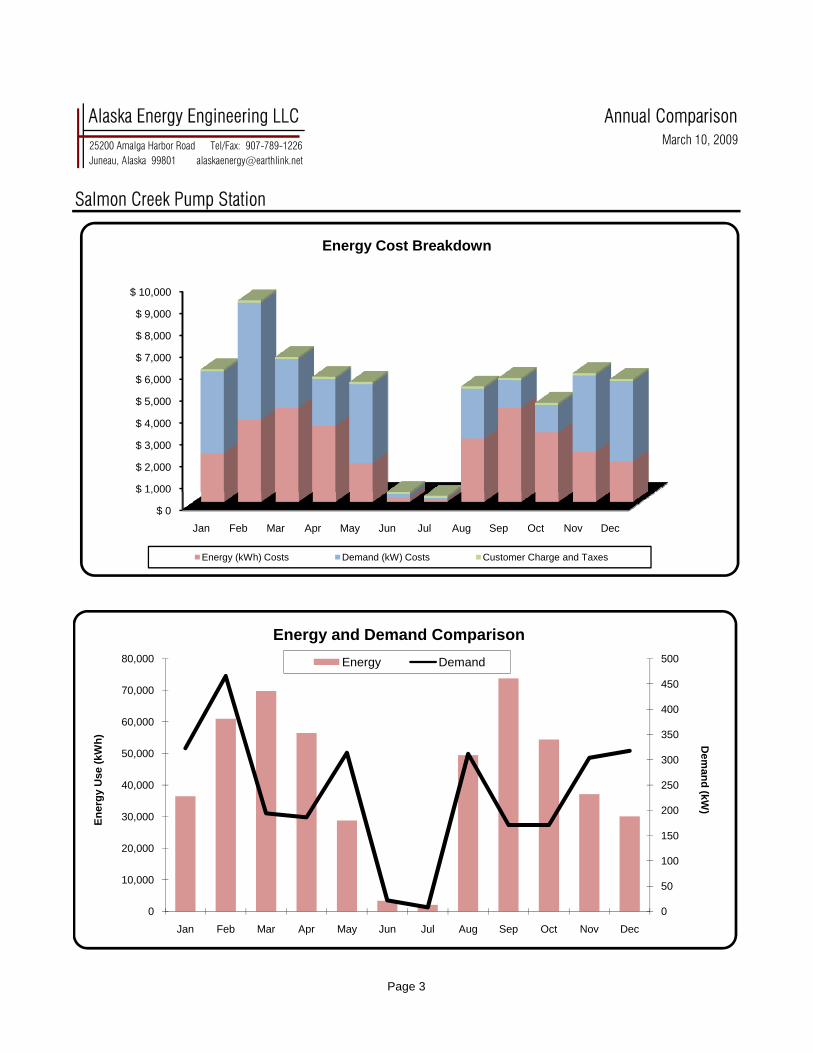
Alaska Energy Engineering LLC Annual Comparison 25200 Amalga Harbor Road Tel/Fax: 907-789-1226 Juneau, Alaska 99801 [email protected]
Salmon Creek Pump Station
March 10, 2009
$ 1,000
$ 2,000
$ 3,000
$ 4,000
$ 5,000
$ 6,000
$ 7,000
$ 8,000
$ 9,000
$ 10,000
Energy Cost Breakdown
$ 0
$ 1,000
Jan Feb Mar Apr May Jun Jul Aug Sep Oct Nov Dec
Energy (kWh) Costs Demand (kW) Costs Customer Charge and Taxes
0
50
100
150
200
250
300
350
400
450
500
0
10,000
20,000
30,000
40,000
50,000
60,000
70,000
80,000
Jan Feb Mar Apr May Jun Jul Aug Sep Oct Nov Dec
Dem
and (kW)
Ener
gy U
se (k
Wh)
Energy and Demand ComparisonEnergy Demand
Page 3

Alaska Energy Engineering LLC Electric Use Data 25200 Amalga Harbor Road Tel/Fax: 907-789-1226 Juneau, Alaska 99801 [email protected]
Salmon Creek Pump Station - CBJ AccountELECTRIC RATE
Electricity ($ / kWh ) 0.0933 0.0742Customer Charge ( $ / mo ) 18.80 18.80Power Cost Adjustment ( $ / kWh ) 0.012037 0.012037Regulatory Cost Charge ( $ / kWh ) 0.000362 0.000362Sales Tax ( % ) 0.0% 0.0%
ELECTRICAL CONSUMPTION
2005 2006 2007 2008kWh kWh kWh kWh
Jan 0 10,720 18,160 16,320Feb 19,880 13,280 13,920 20,480Mar 19,120 11,520 13,160 19,880Apr 16,040 16,720 17,440 16,720May 14,400 14,000 14,600 10,920Jun 8 520 11 600 11 800 3 360
March 9, 2009
AEL&P Electric Rate 20On-PeakNov-May
Off-peakJun-Oct
Month
Jun 8,520 11,600 11,800 3,360Jul 8,000 10,360 11,040 2,080Aug 7,560 8,800 7,520 6,200Sep 8,760 7,640 5,880 8,800Oct 4,240 4,760 8,560 8,160Nov 7,840 8,160 12,600 10,600Dec 13,040 17,240 13,160 12,160Total 127,400 134,800 147,840 135,680
Average 10,617 11,233 12,320 11,307
ELECTRIC BILLING DETAILS
Month Energy Cust & Tax Total Energy Cust & Tax Total % ChangeJan 1,919 19 1,938 1,725 19 1,744 -10.0%Feb 1,471 19 1,490 2,165 19 2,184 46.5%Mar 1,391 19 1,410 2,101 19 2,120 50.4%Apr 1,843 19 1,862 1,767 19 1,786 -4.1%May 1,543 19 1,562 1,154 19 1,173 -24.9%Jun 1,022 19 1,041 291 19 310 -70.2%Jul 956 19 975 180 19 199 -79.6%Aug 651 19 670 537 19 556 -17.1%Sep 509 19 528 762 19 781 47.9%Oct 741 19 760 707 19 725 -4.6%
Nov 1,332 19 1,351 1,120 19 1,139 -15.7%Dec 1,391 19 1,410 1,285 19 1,304 -7.5%
Total $ 14,771 $ 226 $ 14,996 $ 13,795 $ 226 $ 14,021 -6.5%
Average $ 1,231 $ 19 $ 1,250 $ 1,150 $ 19 $ 1,168 -6.5%
Cost ($/kWh) $0.1014 $0.1033 1.9%
2007 2008
Electrical costs are based on the current electric rates.
Page 1

Alaska Energy Engineering LLC Yearly Comparison 25200 Amalga Harbor Road Tel/Fax: 907-789-1226 Juneau, Alaska 99801 [email protected]
Salmon Creek Pump Station - CBJ Account
March 9, 2009
5,000
10,000
15,000
20,000
25,000
kWh
Energy Use Comparison
2005 2006 2007 2008
0
#DIV/0!
0Jan Feb Mar Apr May Jun Jul Aug Sep Oct Nov Dec
$ 0
$ 500
$ 1,000
$ 1,500
$ 2,000
$ 2,500
Jan Feb Mar Apr May Jun Jul Aug Sep Oct Nov Dec
Energy Cost Breakdown
Energy (kWh) Costs Customer Charge and Taxes
Page 2

Alaska Energy Engineering LLC Electric Use Data 25200 Amalga Harbor Road Tel/Fax: 907-789-1226 Juneau, Alaska 99801 [email protected]
Crow Hill Pump StationELECTRIC RATE
Electricity ($ / kWh ) 0.0614 0.0614Demand ( $ / kW ) 11.53 7.35Customer Charge ( $ / mo ) 26.12 26.12Power Cost Adjustment ( $ / kWh ) 0.012037 0.012037Regulatory Cost Charge ( $ / kWh ) 0.000362 0.000362Sales Tax ( % ) 0.0% 0.0%
ELECTRICAL CONSUMPTION AND DEMAND
kWh kW kWh kW kWh kW kWh kWJan 16,960 70 15,360 64 14,120 61 13,280 66Feb 14,440 63 14,400 45 15,040 63 15,760 40Mar 14,000 65 14,840 14 14,840 65 12,840 59Apr 14,680 70 13,360 69 12,640 60 11,960 56May 12 000 62 11 600 62 12 080 58 9 560 23
March 10, 2009
2008
AEL&P Electric Rate 91On-PeakNov-May
Off-peakJun-Oct
Month2005 2006 2007
May 12,000 62 11,600 62 12,080 58 9,560 23Jun 11,680 61 10,240 55 11,360 57 9,280 25Jul 12,080 60 10,560 57 10,520 43 8,600 21Aug 10,640 6 9,840 10 9,960 43 8,920 56Sep 10,880 58 11,600 34 10,320 24 7,880 58Oct 12,480 52 11,680 12 10,520 42 9,240 44Nov 12,600 59 14,960 66 12,120 59 13,680 64Dec 13,880 13 15,320 13 14,640 59 14,800 34Total 156,320 153,760 148,160 135,800
Average 13,027 53 12,813 42 12,347 53 11,317 46
Load Factor 33.5% 42.0% 32.0% 34.1%
ELECTRIC BILLING DETAILS
Month Energy Demand Cust & Tax Total Energy Demand Cust & Tax Total % ChangeJan 1,042 703 26 1,771 980 761 26 1,767 -0.2%Feb 1,110 726 26 1,862 1,163 461 26 1,650 -11.4%Mar 1,095 749 26 1,871 948 680 26 1,654 -11.6%Apr 933 692 26 1,651 883 646 26 1,554 -5.8%May 891 669 26 1,586 706 265 26 997 -37.2%Jun 838 419 26 1,283 685 184 26 895 -30.3%Jul 776 316 26 1,119 635 154 26 815 -27.1%Aug 735 316 26 1,077 658 412 26 1,096 1.7%Sep 762 176 26 964 582 426 26 1,034 7.2%Oct 776 309 26 1,111 682 323 26 1,031 -7.2%
Nov 894 680 26 1,601 1,010 738 26 1,774 10.8%Dec 1,080 680 26 1,787 1,092 392 26 1,510 -15.5%
Total $ 10,934 $ 6,436 $ 313 $ 17,684 $ 10,022 $ 5,443 $ 313 $ 15,778 -10.8%
Average $ 911 $ 536 $ 26 $ 1,474 $ 835 $ 454 $ 26 $ 1,315 -10.8%
Cost ($/kWh) 0.1194 64% 34% 2% 0.1162 -2.7%
Electrical costs are based on the current electric rates.
2007 2008
Page 1

Alaska Energy Engineering LLC Yearly Comparison 25200 Amalga Harbor Road Tel/Fax: 907-789-1226 Juneau, Alaska 99801 [email protected]
Crow Hill Pump Station
March 10, 2009
4,000
6,000
8,000
10,000
12,000
14,000
16,000
18,000
kWh
Energy Use Comparison
#DIV/0! #DIV/0! #DIV/0!
0
2,000
Jan Feb Mar Apr May Jun Jul Aug Sep Oct Nov Dec
2005 2006 2007 2008
0
10
20
30
40
50
60
70
80
Jan Feb Mar Apr May Jun Jul Aug Sep Oct Nov Dec
kW
Energy Demand Comparison
2005 2006 2007 2008
Page 2

Alaska Energy Engineering LLC Annual Comparison 25200 Amalga Harbor Road Tel/Fax: 907-789-1226 Juneau, Alaska 99801 [email protected]
Crow Hill Pump Station
March 10, 2009
$ 200
$ 400
$ 600
$ 800
$ 1,000
$ 1,200
$ 1,400
$ 1,600
$ 1,800
Energy Cost Breakdown
#DIV/0! #DIV/0! #DIV/0!
$ 0Jan Feb Mar Apr May Jun Jul Aug Sep Oct Nov Dec
Energy (kWh) Costs Demand (kW) Costs Customer Charge and Taxes
0
10
20
30
40
50
60
70
0
2,000
4,000
6,000
8,000
10,000
12,000
14,000
16,000
18,000
Jan Feb Mar Apr May Jun Jul Aug Sep Oct Nov Dec
Dem
and (kW)
Ener
gy U
se (k
Wh)
Energy and Demand Comparison
Energy Demand
Page 3

Alaska Energy Engineering LLC Electric Use Data 25200 Amalga Harbor Road Tel/Fax: 907-789-1226 Juneau, Alaska 99801 [email protected]
Crow Hill Pump StationELECTRIC RATE
Electricity ($ / kWh ) 0.0493 0.0462Demand ( $ / kW ) 11.53 7.35Customer Charge ( $ / mo ) 99.24 99.24Power Cost Adjustment ( $ / kWh ) 0.012037 0.012037Regulatory Cost Charge ( $ / kWh ) 0.000362 0.000362Sales Tax ( % ) 0.0% 0.0%
ELECTRICAL CONSUMPTION AND DEMAND
kWh kW kWh kW kWh kW kWh kWJan 16,960 70 15,360 64 14,120 61 13,280 66Feb 14,440 63 14,400 45 15,040 63 15,760 40Mar 14,000 65 14,840 14 14,840 65 12,840 59Apr 14,680 70 13,360 69 12,640 60 11,960 56May 12 000 62 11 600 62 12 080 58 9 560 23
March 9, 2009
2008
AEL&P Electric Rate 34On-PeakNov-May
Off-peakJun-Oct
Month2005 2006 2007
May 12,000 62 11,600 62 12,080 58 9,560 23Jun 11,680 61 10,240 55 11,360 57 9,280 25Jul 12,080 60 10,560 57 10,520 43 8,600 21Aug 10,640 6 9,840 10 9,960 43 8,920 56Sep 10,880 58 11,600 34 10,320 24 7,880 58Oct 12,480 52 11,680 12 10,520 42 9,240 44Nov 12,600 59 14,960 66 12,120 59 13,680 64Dec 13,880 13 15,320 13 14,640 59 14,800 34Total 156,320 153,760 148,160 135,800
Average 13,027 53 12,813 42 12,347 53 11,317 46
Load Factor 33.5% 42.0% 32.0% 34.1%
ELECTRIC BILLING DETAILS
Month Energy Demand Cust & Tax Total Energy Demand Cust & Tax Total % ChangeJan 871 703 99 1,674 819 761 99 1,680 0.3%Feb 928 726 99 1,754 972 461 99 1,533 -12.6%Mar 916 749 99 1,764 792 680 99 1,572 -10.9%Apr 780 692 99 1,571 738 646 99 1,483 -5.6%May 745 669 99 1,513 590 265 99 954 -36.9%Jun 666 419 99 1,184 544 184 99 827 -30.2%Jul 616 316 99 1,032 504 154 99 758 -26.6%Aug 584 316 99 999 523 412 99 1,034 3.5%Sep 605 176 99 880 462 426 99 987 12.1%Oct 616 309 99 1,024 541 323 99 964 -5.9%
Nov 748 680 99 1,527 844 738 99 1,681 10.1%Dec 903 680 99 1,683 913 392 99 1,404 -16.5%
Total $ 8,978 $ 6,436 $ 1,191 $ 16,605 $ 8,243 $ 5,443 $ 1,191 $ 14,876 -10.4%
Average $ 748 $ 536 $ 99 $ 1,384 $ 687 $ 454 $ 99 $ 1,240 -10.4%
Cost ($/kWh) 0.1121 0.1095 -2.3%
Electrical costs are based on the current electric rates.
2007 2008
Page 1
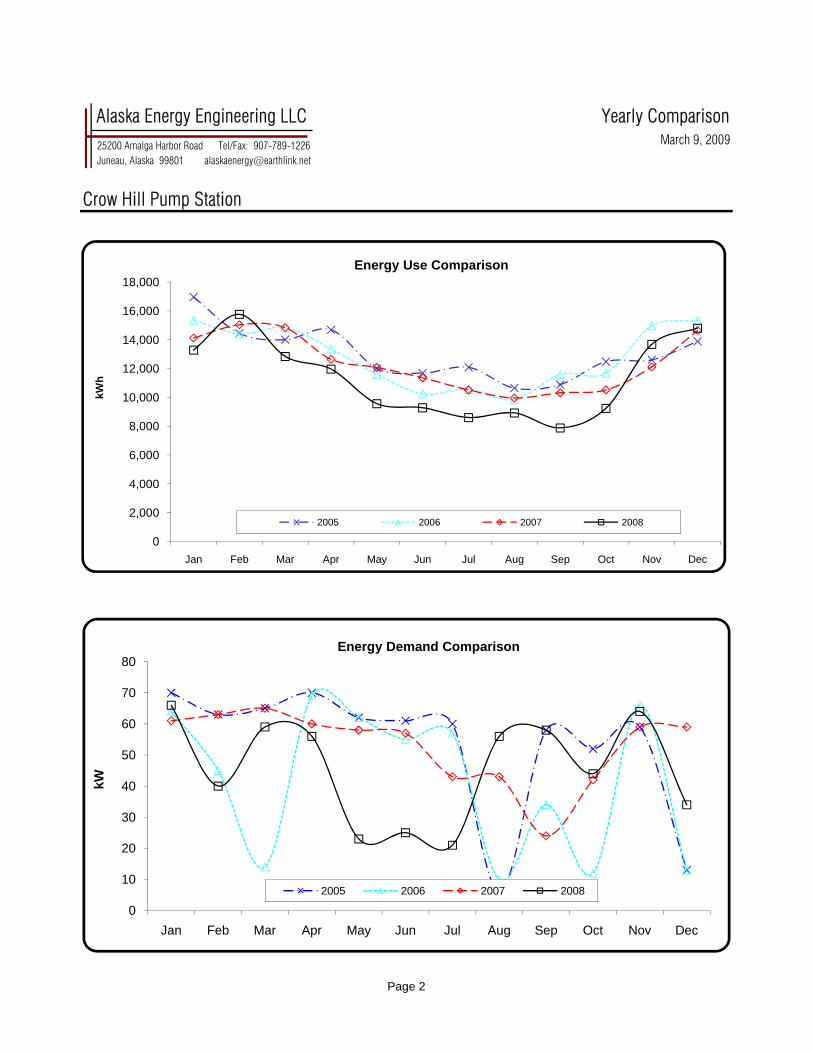
Alaska Energy Engineering LLC Yearly Comparison 25200 Amalga Harbor Road Tel/Fax: 907-789-1226 Juneau, Alaska 99801 [email protected]
Crow Hill Pump Station
March 9, 2009
4,000
6,000
8,000
10,000
12,000
14,000
16,000
18,000
kWh
Energy Use Comparison
0
2,000
Jan Feb Mar Apr May Jun Jul Aug Sep Oct Nov Dec
2005 2006 2007 2008
0
10
20
30
40
50
60
70
80
Jan Feb Mar Apr May Jun Jul Aug Sep Oct Nov Dec
kW
Energy Demand Comparison
2005 2006 2007 2008
Page 2

Alaska Energy Engineering LLC Annual Comparison 25200 Amalga Harbor Road Tel/Fax: 907-789-1226 Juneau, Alaska 99801 [email protected]
Crow Hill Pump Station
March 9, 2009
$ 200
$ 400
$ 600
$ 800
$ 1,000
$ 1,200
$ 1,400
$ 1,600
$ 1,800
Energy Cost Breakdown
$ 0Jan Feb Mar Apr May Jun Jul Aug Sep Oct Nov Dec
Energy (kWh) Costs Demand (kW) Costs Customer Charge and Taxes
0
10
20
30
40
50
60
70
0
2,000
4,000
6,000
8,000
10,000
12,000
14,000
16,000
18,000
Jan Feb Mar Apr May Jun Jul Aug Sep Oct Nov Dec
Dem
and (kW)
Ener
gy U
se (k
Wh)
Energy and Demand Comparison
Energy Demand
Page 3
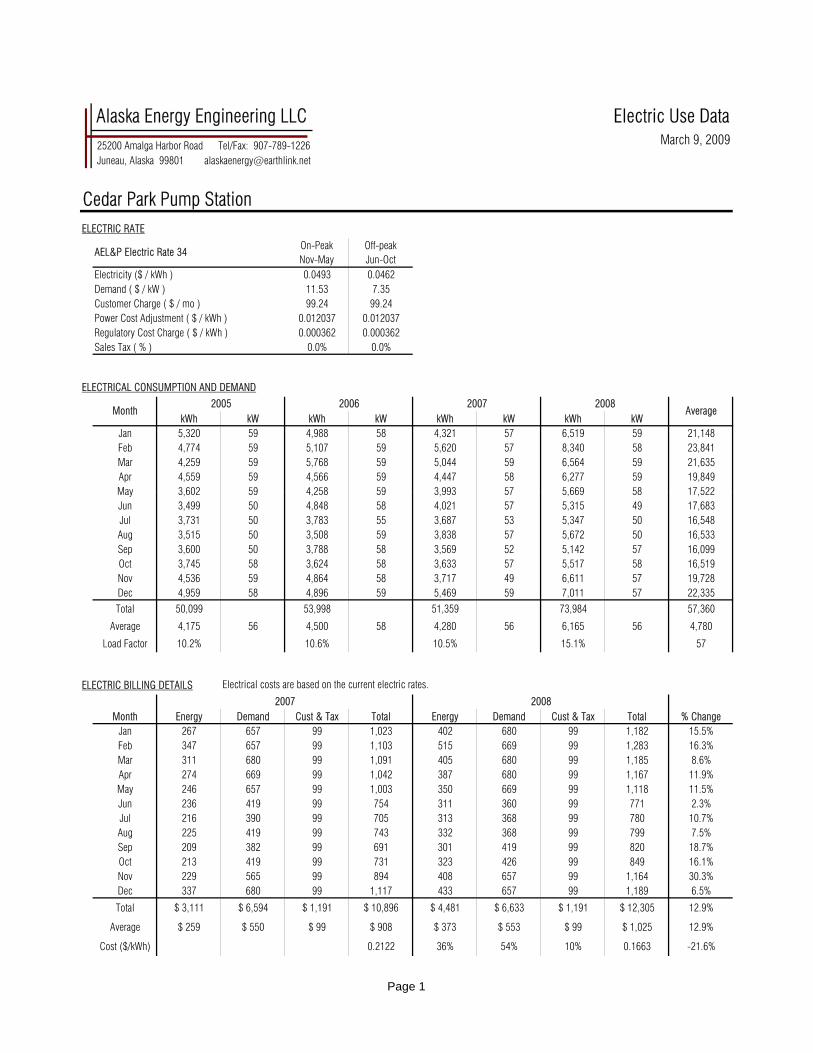
Alaska Energy Engineering LLC Electric Use Data 25200 Amalga Harbor Road Tel/Fax: 907-789-1226 Juneau, Alaska 99801 [email protected]
Cedar Park Pump StationELECTRIC RATE
Electricity ($ / kWh ) 0.0493 0.0462Demand ( $ / kW ) 11.53 7.35Customer Charge ( $ / mo ) 99.24 99.24Power Cost Adjustment ( $ / kWh ) 0.012037 0.012037Regulatory Cost Charge ( $ / kWh ) 0.000362 0.000362Sales Tax ( % ) 0.0% 0.0%
ELECTRICAL CONSUMPTION AND DEMAND
kWh kW kWh kW kWh kW kWh kWJan 5,320 59 4,988 58 4,321 57 6,519 59 21,148Feb 4,774 59 5,107 59 5,620 57 8,340 58 23,841Mar 4,259 59 5,768 59 5,044 59 6,564 59 21,635Apr 4,559 59 4,566 59 4,447 58 6,277 59 19,849May 3 602 59 4 258 59 3 993 57 5 669 58 17 522
March 9, 2009
2008
AEL&P Electric Rate 34On-PeakNov-May
Off-peakJun-Oct
Month2005 2006 2007
Average
May 3,602 59 4,258 59 3,993 57 5,669 58 17,522Jun 3,499 50 4,848 58 4,021 57 5,315 49 17,683Jul 3,731 50 3,783 55 3,687 53 5,347 50 16,548Aug 3,515 50 3,508 59 3,838 57 5,672 50 16,533Sep 3,600 50 3,788 58 3,569 52 5,142 57 16,099Oct 3,745 58 3,624 58 3,633 57 5,517 58 16,519Nov 4,536 59 4,864 58 3,717 49 6,611 57 19,728Dec 4,959 58 4,896 59 5,469 59 7,011 57 22,335Total 50,099 53,998 51,359 73,984 57,360
Average 4,175 56 4,500 58 4,280 56 6,165 56 4,780
Load Factor 10.2% 10.6% 10.5% 15.1% 57
ELECTRIC BILLING DETAILS
Month Energy Demand Cust & Tax Total Energy Demand Cust & Tax Total % ChangeJan 267 657 99 1,023 402 680 99 1,182 15.5%Feb 347 657 99 1,103 515 669 99 1,283 16.3%Mar 311 680 99 1,091 405 680 99 1,185 8.6%Apr 274 669 99 1,042 387 680 99 1,167 11.9%May 246 657 99 1,003 350 669 99 1,118 11.5%Jun 236 419 99 754 311 360 99 771 2.3%Jul 216 390 99 705 313 368 99 780 10.7%Aug 225 419 99 743 332 368 99 799 7.5%Sep 209 382 99 691 301 419 99 820 18.7%Oct 213 419 99 731 323 426 99 849 16.1%
Nov 229 565 99 894 408 657 99 1,164 30.3%Dec 337 680 99 1,117 433 657 99 1,189 6.5%
Total $ 3,111 $ 6,594 $ 1,191 $ 10,896 $ 4,481 $ 6,633 $ 1,191 $ 12,305 12.9%
Average $ 259 $ 550 $ 99 $ 908 $ 373 $ 553 $ 99 $ 1,025 12.9%
Cost ($/kWh) 0.2122 36% 54% 10% 0.1663 -21.6%
Electrical costs are based on the current electric rates.
2007 2008
Page 1

Alaska Energy Engineering LLC Yearly Comparison 25200 Amalga Harbor Road Tel/Fax: 907-789-1226 Juneau, Alaska 99801 [email protected]
Cedar Park Pump Station
March 9, 2009
2,000
3,000
4,000
5,000
6,000
7,000
8,000
9,000
kWh
Energy Use Comparison
0
1,000
Jan Feb Mar Apr May Jun Jul Aug Sep Oct Nov Dec
2005 2006 2007 2008
0
10
20
30
40
50
60
70
Jan Feb Mar Apr May Jun Jul Aug Sep Oct Nov Dec
kW
Energy Demand Comparison
2005 2006 2007 2008
Page 2

Alaska Energy Engineering LLC Annual Comparison 25200 Amalga Harbor Road Tel/Fax: 907-789-1226 Juneau, Alaska 99801 [email protected]
Cedar Park Pump Station
March 9, 2009
$ 200
$ 400
$ 600
$ 800
$ 1,000
$ 1,200
$ 1,400
Energy Cost Breakdown
$ 0Jan Feb Mar Apr May Jun Jul Aug Sep Oct Nov Dec
Energy (kWh) Costs Demand (kW) Costs Customer Charge and Taxes
0
10
20
30
40
50
60
70
0
1,000
2,000
3,000
4,000
5,000
6,000
7,000
8,000
9,000
Jan Feb Mar Apr May Jun Jul Aug Sep Oct Nov Dec
Dem
and (kW)
Ener
gy U
se (k
Wh)
Energy and Demand Comparison
Energy Demand
Page 3

Alaska Energy Engineering LLC Electric Use Data 25200 Amalga Harbor Road Tel/Fax: 907-789-1226 Juneau, Alaska 99801 [email protected]
Bonnie Brae Pump StationELECTRIC RATE
Electricity ($ / kWh ) 0.0933 0.0742Customer Charge ( $ / mo ) 18.80 18.80Power Cost Adjustment ( $ / kWh ) 0.012037 0.012037Regulatory Cost Charge ( $ / kWh ) 0.000362 0.000362Sales Tax ( % ) 0.0% 0.0%
ELECTRICAL CONSUMPTION
2005 2006 2007 2008kWh kWh kWh kWh
Jan 1,411 1,926 1,997 1,613Feb 1,360 1,763 1,754 1,537Mar 1,220 1,925 1,735 1,863Apr 1,029 1,493 1,619 1,121May 857 1,333 1,110 1,028Jun 666 727 878 939
March 9, 2009
AEL&P Electric Rate 20On-PeakNov-May
Off-peakJun-Oct
Month
Jun 666 727 878 939Jul 628 540 887 824Aug 798 682 714 757Sep 664 579 786 996Oct 868 1,125 1,088 1,132Nov 1,143 1,537 1,268 1,343Dec 1,682 1,505 1,633 2,183Total 12,326 15,135 15,469 15,336
Average 1,027 1,261 1,289 1,278
ELECTRIC BILLING DETAILS
Month Energy Cust & Tax Total Energy Cust & Tax Total % ChangeJan 211 19 230 170 19 189 -17.7%Feb 185 19 204 162 19 181 -11.2%Mar 183 19 202 197 19 216 6.7%Apr 171 19 190 118 19 137 -27.7%May 117 19 136 109 19 127 -6.4%Jun 76 19 95 81 19 100 5.6%Jul 77 19 96 71 19 90 -5.7%Aug 62 19 81 66 19 84 4.6%Sep 68 19 87 86 19 105 20.9%Oct 94 19 113 98 19 117 3.4%
Nov 134 19 153 142 19 161 5.2%Dec 173 19 191 231 19 250 30.4%
Total $ 1,552 $ 226 $ 1,778 $ 1,532 $ 226 $ 1,758 -1.1%
Average $ 129 $ 19 $ 148 $ 128 $ 19 $ 146 -1.1%
Cost ($/kWh) 0.114908238 0.114620701 -0.3%
2007 2008
Electrical costs are based on the current electric rates.
Page 1

Alaska Energy Engineering LLC Yearly Comparison 25200 Amalga Harbor Road Tel/Fax: 907-789-1226 Juneau, Alaska 99801 [email protected]
Bonnie Brae Pump Station
March 9, 2009
500
1,000
1,500
2,000
2,500
kWh
Energy Use Comparison
0Jan Feb Mar Apr May Jun Jul Aug Sep Oct Nov Dec
2005 2006 2007 2008
$ 0
$ 50
$ 100
$ 150
$ 200
$ 250
Jan Feb Mar Apr May Jun Jul Aug Sep Oct Nov Dec
Energy Cost Breakdown
Energy (kWh) Costs Customer Charge and Taxes
Page 2

Alaska Energy Engineering LLC Electric Use Data 25200 Amalga Harbor Road Tel/Fax: 907-789-1226 Juneau, Alaska 99801 [email protected]
Mountain Side Pump StationELECTRIC RATE
Electricity ($ / kWh ) 0.0493 0.0462Demand ( $ / kW ) 11.53 7.35Customer Charge ( $ / mo ) 99.24 99.24Power Cost Adjustment ( $ / kWh ) 0.012037 0.012037Regulatory Cost Charge ( $ / kWh ) 0.000362 0.000362Sales Tax ( % ) 0.0% 0.0%
ELECTRICAL CONSUMPTION AND DEMAND
kWh kW kWh kW kWh kW kWh kWJan 4,240 11 4,418 9 4,271 8 4,676 9 17,605Feb 4,344 9 4,022 9 4,154 9 4,624 9 17,144Mar 3,862 9 3,963 9 4,181 12 4,305 10 16,311Apr 3,784 9 3,921 9 3,909 8 4,361 9 15,975May 3 394 9 3 621 8 3 888 9 4 005 9 14 908
March 9, 2009
2008
AEL&P Electric Rate 34On-PeakNov-May
Off-peakJun-Oct
Month2005 2006 2007
Average
May 3,394 9 3,621 8 3,888 9 4,005 9 14,908Jun 3,963 21 3,092 8 3,498 28 3,793 7 14,346Jul 3,546 8 3,112 9 3,539 6 4,119 9 14,316Aug 3,801 6 3,213 5 3,627 6 3,637 8 14,278Sep 3,559 6 3,240 6 3,442 10 3,723 10 13,964Oct 3,781 6 3,213 24 3,707 12 3,831 12 14,532Nov 3,924 9 3,858 14 3,832 9 3,949 8 15,563Dec 4,172 9 4,098 8 4,295 9 4,266 9 16,831Total 46,370 43,771 46,343 49,289 46,443
Average 3,864 9 3,648 10 3,862 11 4,107 9 3,870
Load Factor 56.7% 50.8% 50.4% 61.9% 10
ELECTRIC BILLING DETAILS
Month Energy Demand Cust & Tax Total Energy Demand Cust & Tax Total % ChangeJan 264 92 99 455 289 104 99 492 8.0%Feb 256 104 99 459 285 104 99 488 6.3%Mar 258 138 99 496 266 115 99 480 -3.1%Apr 241 92 99 433 269 104 99 472 9.1%May 240 104 99 443 247 104 99 450 1.6%Jun 205 206 99 510 222 51 99 373 -26.9%Jul 207 44 99 351 241 66 99 407 16.0%Aug 213 44 99 356 213 59 99 371 4.3%Sep 202 74 99 374 218 74 99 391 4.4%Oct 217 88 99 405 224 88 99 412 1.8%
Nov 236 104 99 439 244 92 99 435 -1.0%Dec 265 104 99 468 263 104 99 466 -0.4%
Total $ 2,804 $ 1,194 $ 1,191 $ 5,189 $ 2,982 $ 1,064 $ 1,191 $ 5,237 0.9%
Average $ 234 $ 99 $ 99 $ 432 $ 248 $ 89 $ 99 $ 436 0.9%
Cost ($/kWh) 0.1120 57% 20% 23% 0.1063 -5.1%
Electrical costs are based on the current electric rates.
2007 2008
Page 1
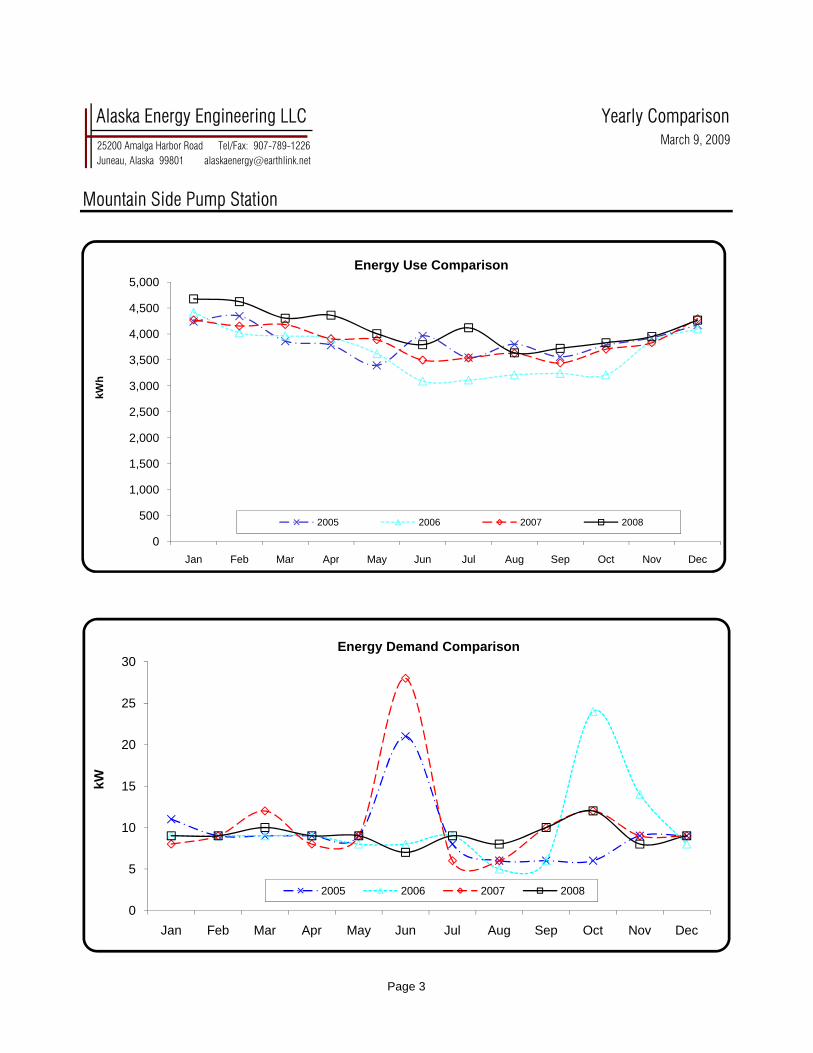
Alaska Energy Engineering LLC Yearly Comparison 25200 Amalga Harbor Road Tel/Fax: 907-789-1226 Juneau, Alaska 99801 [email protected]
Mountain Side Pump Station
March 9, 2009
1 000
1,500
2,000
2,500
3,000
3,500
4,000
4,500
5,000
kWh
Energy Use Comparison
0
500
1,000
Jan Feb Mar Apr May Jun Jul Aug Sep Oct Nov Dec
2005 2006 2007 2008
0
5
10
15
20
25
30
Jan Feb Mar Apr May Jun Jul Aug Sep Oct Nov Dec
kW
Energy Demand Comparison
2005 2006 2007 2008
Page 3

Alaska Energy Engineering LLC Annual Comparison 25200 Amalga Harbor Road Tel/Fax: 907-789-1226 Juneau, Alaska 99801 [email protected]
Mountain Side Pump Station
March 9, 2009
$ 50
$ 100
$ 150
$ 200
$ 250
$ 300
$ 350
$ 400
$ 450
$ 500
Energy Cost Breakdown
$ 0
$ 50
Jan Feb Mar Apr May Jun Jul Aug Sep Oct Nov Dec
Energy (kWh) Costs Demand (kW) Costs Customer Charge and Taxes
0
2
4
6
8
10
12
14
0
500
1,000
1,500
2,000
2,500
3,000
3,500
4,000
4,500
5,000
Jan Feb Mar Apr May Jun Jul Aug Sep Oct Nov Dec
Dem
and (kW)
Ener
gy U
se (k
Wh)
Energy and Demand Comparison
Energy Demand
Page 4

Alaska Energy Engineering LLC Electric Use Data 25200 Amalga Harbor Road Tel/Fax: 907-789-1226 Juneau, Alaska 99801 [email protected]
Lena Loop Pump StationELECTRIC RATE
Electricity ($ / kWh ) 0.0536 0.0475Demand ( $ / kW ) 10.27 6.87Customer Charge ( $ / mo ) 27.16 27.16Power Cost Adjustment ( $ / kWh ) 0.012037 0.012037Regulatory Cost Charge ( $ / kWh ) 0.000362 0.000362Sales Tax ( % ) 0.0% 0.0%
ELECTRICAL CONSUMPTION AND DEMAND
kWh kW kWh kW kWh kW kWh kWJan 4,920 14 5,400 19 4,720 18 3,400 17 18,440Feb 5,120 20 6,240 14 5,040 18 3,760 22 20,160Mar 5,520 13 5,760 22 5,040 18 3,440 18 19,760Apr 4,640 15 5,560 21 5,000 18 3,080 12 18,280May 4 200 14 4 560 12 4 480 17 2 320 11 15 560
March 9, 2009
2008
AEL&P Electric Rate 31On-PeakNov-May
Off-peakJun-Oct
Month2005 2006 2007
Average
May 4,200 14 4,560 12 4,480 17 2,320 11 15,560Jun 4,280 10 4,520 10 2,280 11 1,720 8 12,800Jul 3,120 7 3,840 11 2,080 14 1,960 15 11,000Aug 3,480 15 3,520 17 2,080 11 1,760 14 10,840Sep 3,440 15 3,520 15 1,880 10 1,760 6 10,600Oct 3,160 11 3,560 16 2,160 16 2,800 15 11,680Nov 3,600 14 4,680 18 2,520 11 4,320 19 15,120Dec 5,760 18 5,040 18 2,960 17 4,080 19 17,840Total 51,240 56,200 40,240 34,400 45,520
Average 4,270 14 4,683 16 3,353 15 2,867 15 3,793
Load Factor 42.3% 39.9% 30.8% 26.8% 15
ELECTRIC BILLING DETAILS
Month Energy Demand Cust & Tax Total Energy Demand Cust & Tax Total % ChangeJan 312 185 27 524 224 175 27 426 -18.6%Feb 333 185 27 545 248 226 27 501 -8.0%Mar 333 185 27 545 227 185 27 439 -19.4%Apr 330 185 27 542 203 123 27 354 -34.7%May 296 175 27 497 153 113 27 293 -41.0%Jun 137 76 27 239 103 55 27 185 -22.6%Jul 125 96 27 248 117 103 27 248 -0.1%Aug 125 76 27 227 105 96 27 229 0.6%Sep 113 69 27 208 105 41 27 174 -16.6%Oct 129 110 27 266 168 103 27 298 11.8%
Nov 166 113 27 306 285 195 27 507 65.6%Dec 195 175 27 397 269 195 27 492 23.8%
Total $ 2,592 $ 1,628 $ 326 $ 4,545 $ 2,209 $ 1,610 $ 326 $ 4,146 -8.8%
Average $ 216 $ 136 $ 27 $ 379 $ 184 $ 134 $ 27 $ 345 -8.8%
Cost ($/kWh) 0.1130 53% 39% 8% 0.1205 6.7%
Electrical costs are based on the current electric rates.
2007 2008
Page 1

Alaska Energy Engineering LLC Yearly Comparison 25200 Amalga Harbor Road Tel/Fax: 907-789-1226 Juneau, Alaska 99801 [email protected]
Lena Loop Pump Station
March 9, 2009
2,000
3,000
4,000
5,000
6,000
7,000
kWh
Energy Use Comparison
0
1,000
Jan Feb Mar Apr May Jun Jul Aug Sep Oct Nov Dec
2005 2006 2007 2008
0
5
10
15
20
25
Jan Feb Mar Apr May Jun Jul Aug Sep Oct Nov Dec
kW
Energy Demand Comparison
2005 2006 2007 2008
Page 2

Alaska Energy Engineering LLC Annual Comparison 25200 Amalga Harbor Road Tel/Fax: 907-789-1226 Juneau, Alaska 99801 [email protected]
Lena Loop Pump Station
March 9, 2009
$ 100
$ 200
$ 300
$ 400
$ 500
$ 600
Energy Cost Breakdown
$ 0Jan Feb Mar Apr May Jun Jul Aug Sep Oct Nov Dec
Energy (kWh) Costs Demand (kW) Costs Customer Charge and Taxes
0
5
10
15
20
25
0
500
1,000
1,500
2,000
2,500
3,000
3,500
4,000
4,500
5,000
Jan Feb Mar Apr May Jun Jul Aug Sep Oct Nov Dec
Dem
and (kW)
Ener
gy U
se (k
Wh)
Energy and Demand Comparison
Energy Demand
Page 3

This page intentionally left blank

Alaska Energy Engineering LLC
City and Borough of Juneau Water System Energy Audit
Appendix B
Calculations

Alaska Energy Engineering LLC
City and Borough of Juneau Water System Energy Audit
This page intentionally left blank

Alaska Energy Engineering LLC Energy Analysis 25200 Amalga Harbor Road Tel/Fax: 907.789.1226 Juneau, Alaska 99801 [email protected]
CBJ Water System Energy Audit
Last Chance Basin Well FieldLAST CHANCE BASIN
Heating Load CalculationsWells 1 and 2 Wells 4 and 5
R-value Area ∆T kW R-value Area ∆T kWWall 7.0 720 59 1.7 Wall 7.0 520 59 1.2Window 2.0 0 59 0.0 Window 2.0 0 59 0.0Door 2.0 21 59 0.2 Door 2.0 21 59 0.2Roof 21.0 275 59 0.2 Roof 18.0 160 59 0.2Floor 7.0 275 18 0.2 Floor 7.0 160 18 0.1
F-value ln ft ∆T F-value ln ft ∆TPerimeter 0.4 72 59 0.5 Perimeter 0.4 52 59 0.4Totals 2.9 Totals 2.1
BTUH/sqft 36 BTUH/sqft 44Installed Capacity, kW 5.0 Installed Capacity, kW 5.0
Oversizing, kW 2.1 Oversizing, kW 2.9
Well 3 Treatment Building
May 7, 2009
Well 3 Treatment BuildingR-value Area ∆T kW
No Data: Assume Wall 7.0 1,824 59 4.2Area, sqft 575 Window 2.0 0 59 0.0BTUH/sqft 50 Door 2.0 126 59 1.1Heating Load, kW 8.4 Roof 32.0 1,188 59 0.6Installed Capacity, kW 12.0 Floor 7.0 1,188 18 0.9Oversizing, kW 3.6 F-value ln ft ∆T
Perimeter 0.4 152 59 1.1Totals 7.9
BTUH/sqft 23Installed Capacity, kW 8.0
Oversizing, kW 0.1
Low Elevation Flow RatesWell kGal/yr hours Ave GPMWell 1 144,329 4,538 530Well 2 241,560 8,360 482Well 4 243,030 7,236 560Well 5 147,577 5,960 413
776,496 8,760 1,477
Well Flow RatesWell kGal/yr hours gpm Ave GPMWell 3 251,042 3,899 1,073 478
Page 1

Alaska Energy Engineering LLC Energy Analysis 25200 Amalga Harbor Road Tel/Fax: 907.789.1226 Juneau, Alaska 99801 [email protected]
CBJ Water System Energy Audit
Last Chance Basin Well Field
May 7, 2009
Low Elevation System: FCV and PRV LossesGPM Head.ft ηp ηm HP kW Hours $/kWh $/kW Annual $
Well 1 FCV 530 39 80.1% 94.5% 7 5 4,538 $0.06 $9.79 $2,021Well 2 FCV (LE) 482 192 82.7% 94.5% 30 22 8,360 $0.06 $9.79 $13,805Well 4 FCV 560 18 82.2% 90.2% 4 3 7,236 $0.06 $9.79 $1,452Well 5 FCV 413 39 78.4% 90.2% 6 4 5,960 $0.06 $9.79 $2,054
26,094 $19,332
PRV's 1,477 69 81.1% 92.3% 35 26 8,760 $0.06 $10.00 $16,636Total $35,968
High Elevation SystemGPM Head.ft ηp ηm HP kW Hours $/kWh $/kW Annual $
Pump 3 FCV 1,073 14 78.0% 93.0% 5 4 3,899 $0.06 $10.00 $1,3688th St PRV 228 69 78.0% 93.0% 5 4 8,760 $0.06 $10.00 $2,647S. Franklin PRV 250 199 78.0% 93.0% 17 13 8,760 $0.06 $10.00 $8,335
$12,351
Mill Tunnel Change RateCap, Mgals GPM Change/wk
3.2 250 0.8
Well 1 VFDPump GPM Head.ft ηp ηm HP kW Hours kgals MWhNo VFD 530 150 75.0% 94.5% 28 21 4,538 144,308 96With VFD 650 45 75.0% 94.5% 10 8 3,700 144,308 29Savings 13 67
Well 2 VFDPump GPM Head.ft ηp ηm HP kW Hours kgals MWhNo VFD 482 305 75.0% 95.4% 52 39 8,360 241,771 324With VFD 800 45 75.0% 95.4% 13 9 5,037 241,771 47Savings 29 277
Well 3 VFD and MotorPump GPM Head.ft ηp ηm HP kW Hours kgals MWhNo VFD 1,073 209 78.0% 91.0% 80 59 3,899 251,018 232With VFD 800 183 78.0% 95.0% 50 37 5,230 251,018 195Savings 22 37
Well 4 VFD and MotorPump GPM Head.ft ηp ηm HP kW Hours kgals MWhNo VFD 560 84 81.0% 90.2% 16 12 7,236 243,130 88With VFD 1,000 45 81.0% 94.5% 15 11 4,052 243,130 45Savings 1 43
Page 2

Alaska Energy Engineering LLC Energy Analysis 25200 Amalga Harbor Road Tel/Fax: 907.789.1226 Juneau, Alaska 99801 [email protected]
CBJ Water System Energy Audit
Last Chance Basin Well Field
May 7, 2009
Well 5 VFD and MotorPump GPM Head.ft ηp ηm HP kW Hours kgals MWhNo VFD 413 100 81.0% 90.2% 14 11 5,960 147,689 64With VFD 900 45 81.0% 94.5% 13 10 2,735 147,689 27Savings 1 37
Properly Sized Heaters Well Exist kW New kW Months Savings kW1 5 3 12 242 5 3 12 243 7.5 3 12 54
0 3 9 -270 2 4 -8
4 5 3 12 245 5 3 12 24
115
I l t L R l A dT BTUH kWhInsulate Louvers R-value Area dT BTUH kWhDecreased heat loss 0.5 14.6 14 409 1,049
Replace Well 3 Hot Water HeaterWell Exist kW New kW Months Savings kW Losses
3 4.5 1.5 12 36
T,room T,tank Gallons Area, cuft Rtank Loss, kBTU Loss, KWH55 120 30 14 16 503 147
Replace Transformers KW ηold ηnew KW kWhReplace transformer 30 95.0% 97.5% 0.75 6,570Replace transformer 45 95.4% 97.7% 1.04 9,067
Page 3

Alaska Energy Engineering LLC Energy Analysis 25200 Amalga Harbor Road Tel/Fax: 907.789.1226 Juneau, Alaska 99801 [email protected]
CBJ Water System Energy Audit
Salmon Creek Pump StationHeating Load Calculations
Point of Entry Building Treatment BuildingR-value Area ∆T kW R-value Area ∆T kW
Wall 7.0 1,120 59 2.4 Wall 7.0 1,120 59 2.5Window 2.0 0 59 0.0 Window 2.0 0 59 0.0Door 2.0 147 59 1.3 Door 2.0 105 59 0.9Roof 40.0 640 59 0.3 Roof 18.0 640 59 0.6Floor 7.0 640 18 0.5 Floor 7.0 640 18 0.5
F-value ln ft ∆T F-value ln ft ∆TPerimeter 0.4 112 59 0.8 Perimeter 0.4 112 59 0.8Totals 5.2 Totals 5.3
BTUH/sqft 28 BTUH/sqft 28Installed Capacity, kW 23.0 Installed Capacity, kW 28.0
Oversizing, kW 17.8 Oversizing, kW 22.7
Wells 1 and 2R-value Area ∆T kW
Wall 7 0 720 59 1 7
May 7, 2009
Wall 7.0 720 59 1.7Window 2.0 0 59 0.0
Door 2.0 21 59 0.2Roof 21.0 275 59 0.2Floor 7.0 275 18 0.2
F-value ln ft ∆TPerimeter 0.4 72 59 0.5Totals 2.9
Replace Transformers KW ηold ηnew KW kWhReplace transformer 24 94.0% 97% 0.72 6,307
75 96.0% 98.0% 1.50 13,1402.2 19,447
Insulate Louvers R-value Area dT BTUH kWhDecreased heat loss 0.5 36.0 14 1,008 2,587
AEL&P PumpingGPM Head.ft ηp ηm HP kW Hours KWH
Maximum 2,322 275 83% 95% 205 153 7,320 1,117,859Actual 2008 2,100 275 83% 95% 185 138 2,062 284,788
20 15 28% 833,071
Replace Less Efficient MotorsMotor HP ηold ηnew Hours ΔKW ΔKWH
Soda Ash 1 75.5% 85.5% 7,320 0.1 846
Page 4

Alaska Energy Engineering LLC Energy Analysis 25200 Amalga Harbor Road Tel/Fax: 907.789.1226 Juneau, Alaska 99801 [email protected]
CBJ Water System Energy Audit
Crow Hill Pump StationTwo Properly Sized Electric Heaters
R-value Area ∆T kWWall 7.0 840 59 2.0Window 2.0 0 59 0.0 kW Months Demand, kWDoor 2.0 21 59 0.2 Exist 10 12 120Roof 40.0 392 59 0.2 Heater 1 2 12 24Floor 7.0 392 18 0.3 Heater 2 2 7 14
F-value ln ft ∆T Savings 82Perimeter 0.4 84 59 0.6Totals 3.3
BTUH/sqft 29
Installed Capacity, kW 10.0Oversizing, kW 6.7
Insulate Louvers R-value Area dT BTUH kWhDecreased heat loss 0.5 9.0 14 252 647
May 7, 2009
Upgrade Motors and Convert to Variable Speed Pumping
GPM Static, ft Friction, ft ηp ηm HP kW Hours kWHExisting 400 325 45 69.0% 91.0% 60 44 1,496 66,494New 200 325 11 69.0% 95.0% 26 19 2,992 57,885
25 8,610Assume 18 kW savings
Upgrade Motors
GPM Static, ft Friction, ft ηp ηm HP kW Hours kWHExisting 400 325 45 69.0% 91.0% 60 44 1,496 66,494New 400 325 45 69.0% 95.0% 57 43 1,496 63,695
2 2,800
Page 5

Alaska Energy Engineering LLC Energy Analysis 25200 Amalga Harbor Road Tel/Fax: 907.789.1226 Juneau, Alaska 99801 [email protected]
CBJ Water System Energy Audit
Cedar Park Pump StationProperly Sized Electric Heater
R-value Area ∆T kWAbove wall 10.0 200 59 0.3Window 2.0 0 59 0.0Door 2.0 21 59 0.2Below wall 10.0 580 20 0.3Roof 10.0 380 59 0.7Floor 7.0 380 15 0.2Totals 1.7
BTUH/sqft 16
Installed Capacity, kW 10.0Oversizing, kW 8.3
Insulate Louvers R-value Area dT BTUH kWhDecreased heat loss 0.5 3.0 14 84 216
Control Light Fixture
May 7, 2009
Control Light FixtureWatts Hours saved kWH
96 8,604 826
Upgrade Motors and Convert to Variable Speed PumpingGPM Static, ft Friction, ft ηp ηm HP kW Hours kWH
Existing 275 356 52 67.0% 91.0% 47 35 1,496 51,915New 150 356 15 67.0% 95.0% 22 16 2,743 45,219
18 6,696
Upgrade MotorsGPM Static, ft Friction, ft ηp ηm HP kW Hours kWH
Existing 275 356 52 67.0% 91.0% 47 35 1,496 51,915New 275 356 52 67.0% 95.0% 45 33 1,496 49,729
1 2,186
Page 6

Alaska Energy Engineering LLC Energy Analysis 25200 Amalga Harbor Road Tel/Fax: 907.789.1226 Juneau, Alaska 99801 [email protected]
CBJ Water System Energy Audit
Bonnie Brae Pump StationProperly Sized Electric Heater
R-value Area ∆T kWWall 7.0 352 59 0.8Window 2.0 0 59 0.0Door 2.0 21 59 0.2Roof 40.0 120 59 0.1Floor 7.0 120 18 0.1
F-value ln ft ∆TPerimeter 0.4 44 59 0.3Totals 1.5
BTUH/sqft 42
Installed Capacity, kW 6.0Oversizing, kW 4.5
Replace TransformerKW ηold ηnew KW kWh15 94 0% 97% 0 45 3 942
May 7, 2009
15 94.0% 97% 0.45 3,942
Upgrade MotorsGPM Static, ft Friction, ft ηp ηm HP kW Hours kWH
Existing 125 60 12 65.0% 84.0% 4.2 3.1 1,496 4,650New 125 60 12 65.0% 89.5% 3.9 2.9 1,496 4,364
0 286
Page 7

Alaska Energy Engineering LLC Energy Analysis 25200 Amalga Harbor Road Tel/Fax: 907.789.1226 Juneau, Alaska 99801 [email protected]
CBJ Water System Energy Audit
Mountain Side Pump StationReplace Oversize Heaters
R-value Area ∆T kWWall 7.0 816 59 2.0Window 2.0 0 59 0.0 kW Months Demand, kWDoor 2.0 21 59 0.2 Exist 6 12 72Roof 21.0 220 59 0.2 Heater 1 2 12 24Floor 2.0 220 18 0.6 Heater 2 2 7 14
F-value ln ft ∆T Savings 34Perimeter 0.4 68 59 0.5Totals 3.4
BTUH/sqft 53
Installed Capacity, kW 6.0Oversizing, kW 2.6
Insulate Louvers R-value Area dT BTUH kWhDecreased heat loss 0.5 5.0 14 140 359
May 7, 2009
Replace TransformerKW ηold ηnew KW kWh15 94.0% 97% 0.45 3,942
Upgrade MotorsAverage Water Demand
gpy hrs gpm7,336,000 8,760 14.0
GPM Static, ft Friction, ft ηp ηm HP kW Hours kWHExisting 14 105 12 55.0% 85.7% 0.9 0.7 8,760 5,741New 14 105 12 55.0% 91.7% 0.8 0.6 8,760 5,365
0.0 376
Page 8

Alaska Energy Engineering LLC Energy Analysis 25200 Amalga Harbor Road Tel/Fax: 907.789.1226 Juneau, Alaska 99801 [email protected]
CBJ Water System Energy Audit
Lena Loop Pump StationProperly Sized Heating Units
R-value Area ∆T kWWall 7.0 1,120 59 2.7Window 2.0 0 59 0.0 kW Months Demand, kWDoor 2.0 21 59 0.2 Exist 15 12 180Roof 30.0 775 59 0.4 Heater 1 2 12 24Floor 2.0 775 18 2.0 Heater 2 2 8 16
F-value ln ft ∆T Heater 3 3 4 12Perimeter 0.4 112 59 0.8 Savings 128Totals 6.2
BTUH/sqft 27
Installed Capacity, kW 15.0Oversizing, kW 8.8
Insulate Louvers R-value Area dT BTUH kWhDecreased heat loss 0.5 1.5 14 42 108
May 7, 2009
Convert to Variable Speed PumpingExisting Water Demand
gpy hrs gpm23,699,000 2,303 171.5
GPM Static, ft Friction, ft ηp ηm HP kW Hours kWHExisting 172 58 7 58.0% 91.7% 5 4 2,303 9,129New 86 58 2 58.0% 91.7% 2 2 4,606 8,427
2 702
Page 9

This page intentionally left blank

Alaska Energy Engineering LLC
City and Borough of Juneau Water System Energy Audit
Appendix C
Life Cycle Cost Analysis

Alaska Energy Engineering LLC
City and Borough of Juneau Water System Energy Audit
This page intentionally left blank

Alaska Energy Engineering LLC Life Cycle Cost Analysis25200 Amalga Harbor Road Tel/Fax: 907.789.1226Juneau, Alaska 99801 [email protected]
Last Chance Basin Well FieldBasis
25 Study Period (years) 3.0% General Inflation5.00% Nominal Discount Rate 6.0% Fuel Inflation1.94% Real Discount Rate 2.5% Electricity Inflation
LCB-7: Install VFD on Well 2 Pump Qty Unit Base Cost Year 0 Cost
Construction CostsVFD + integration 1 ea $16,700.00 $17,000
Annual CostsVFD maintenance 1 - 25 2 hr $60.00 $2,000
Energy CostsElectric Energy 1 - 25 -277,000 kWh $0.063 ($324,000)Electric Demand 1 - 25 -348 kW $9.79 ($63,000)
Net Present Worth ($368,000)
LCB-8: Install VFD and Replace Motor on Well 3 Pump Qty Unit Base Cost Year 0 Cost
Construction CostsVFD + integration 1 ea $16,700.00 $0Replace motor 1 ea $6,900.00 $7,000
Annual CostsVFD maintenance 1 - 25 2 hr $60.00 $2,000
Energy CostsElectric Energy 1 - 25 -37,000 kWh $0.063 ($43,000)Electric Demand 1 - 25 -264 kW $9.79 ($48,000)
Net Present Worth ($82,000)
August 17, 2009
Year
0
Year
00
Net Present Worth ($82,000)
LCB-9: Install VFD on Well 1 Pump Qty Unit Base Cost Year 0 Cost
Construction CostsVFD + integration 1 ea $10,200.00 $10,000
Annual CostsVFD maintenance 1 - 25 2 hr $60.00 $2,000
Energy CostsElectric Energy 1 - 25 -67,000 kWh $0.063 ($78,000)Electric Demand 1 - 25 -156 kW $9.79 ($28,000)
Net Present Worth ($94,000)
LCB-10: Replace Treatment Building HW Heater Qty Unit Base Cost Year 0 Cost
Construction CostsReplace hot water heater 1 ea $700 $700
Energy CostsElectric Energy 1 - 25 -147 kWh $0.063 ($170)Electric Demand 1 - 25 -36 kW $9.79 ($6,540)
Net Present Worth ($6,010)
Year
0
Year
0
Page 1

Alaska Energy Engineering LLC Life Cycle Cost Analysis25200 Amalga Harbor Road Tel/Fax: 907.789.1226Juneau, Alaska 99801 [email protected]
Last Chance Basin Well Field
August 17, 2009
LCB-11: Replace Oversize Heaters Qty Unit Base Cost Year 0 Cost
Construction CostsWell 1: Replace 5 kW heater with 3 kW heater 1 ea $500.00 $500Well 2: Replace 5 kW heater with 3 kW heater 1 ea $500.00 $500Well 3: Replace 7.5 kW heater with 3 kW heater 1 ea $500.00 $500Well 3: Install 3 kW heater, power, and wall thermostat 1 ea $610.00 $610Well 3: Install 2 kW heater, power, and wall thermostat 1 ea $590.00 $590Well 4: Replace 5 kW heater with 3 kW heater 1 ea $500.00 $500Well 5: Replace 5 kW heater with 3 kW heater 1 ea $500.00 $500
Energy CostsElectric Demand 1 - 25 -115 kW $9.79 ($20,890)
Net Present Worth ($17,190)
LCB-12: Install VFD and Replace Motor on Well 4 Pump Qty Unit Base Cost Year 0 Cost
Construction CostsVFD + integration 1 ea $11,600.00 $12,000Replace motor 1 ea $4,680.00 $5,000
Annual CostsVFD maintenance 1 - 25 2 hr $60.00 $2,000
Energy CostsElectric Energy 1 - 25 -43,000 kWh $0.063 ($50,000)Electric Demand 1 - 25 -12 kW $9.79 ($2,000)
Net Present Worth ($33,000)
LCB-13: Install VFD and Replace Motor on Well 5 Pump Qty Unit Base Cost Year 0 Cost
C i C
0
00
000
Year
0
00
Year
Year
Construction CostsVFD + integration 1 ea $11,600.00 $12,000Replace motor 1 ea $4,680.00 $5,000
Annual CostsVFD maintenance 1 - 25 2 hr $60.00 $2,000
Energy CostsElectric Energy 1 - 25 -37,000 kWh $0.063 ($43,000)Electric Demand 1 - 25 -12 kW $9.79 ($2,000)
Net Present Worth ($26,000)
LCB-14: Replace Older Transformers Qty Unit Base Cost Year 0 Cost
Construction CostsReplace 30 kW transformer 1 ea $7,500 $7,500Replace 45 kW transformer 1 ea $9,000 $9,000
Energy CostsElectric Energy 1 - 25 -15,635 kWh $0.063 ($18,300)Electric Demand 1 - 25 -21.5 kW $9.79 ($3,900)
Net Present Worth ($5,700)
LCB-15: Seal Louvers During Winter Months Qty Unit Base Cost Year 0 Cost
Construction CostsInstall insulated panel 8 ea $80.00 $600
Energy CostsElectric Energy 1 - 25 -1,049 kWh $0.063 ($1,200)
Net Present Worth ($600)
Year
0
0
Year
0
0
0
Page 2

Alaska Energy Engineering LLC Life Cycle Cost Analysis25200 Amalga Harbor Road Tel/Fax: 907.789.1226Juneau, Alaska 99801 [email protected]
Salmon Creek Pump StationBasis
25 Study Period (years) 3.0% General Inflation5.00% Nominal Discount Rate 6.0% Fuel Inflation1.94% Real Discount Rate 2.5% Electricity Inflation
SC-6: Seal Louvers During Winter Months Qty Unit Base Cost Year 0 Cost
Construction CostsInstall insulated panels 3 ea $400.00 $1,200
Energy CostsElectric Energy 1 - 25 -2,587 kWh $0.118 ($5,700)
Net Present Worth ($4,500)
SC-7: Replace Soda Ash Motor Qty Unit Base Cost Year 0 CostConstruction Costs
Replace 1 HP motor 1 ea $640 $600Energy Costs
Electric Energy 1 - 25 -846 kWh $0.118 ($1,900)Electric Demand 1 - 25 0 kW $9.79 $0
Net Present Worth ($1,300)
SC-8: Replace Older Transformers Qty Unit Base Cost Year 0 Cost
Construction CostsReplace 24 kVA transformer 1 ea $6,700 $6,700Replace 45 KVA transformer 1 ea $9,000 $9,000
Energy Costs
Year
Year
0
0
August 17, 2009
0
Year
0
Electric Energy 1 - 25 -19,447 kWh $0.118 ($42,600)Net Present Worth ($26,900)
SC-9: Maximize AEL&P Pumping Energy Qty Unit Base Cost Year 0 Cost
Construction Costs$0
Energy CostsElectric Energy 1 - 5 -523,000 kWh $0.063 ($153,000)Electric Demand 1 - 5 0 kW $9.79 $0
Net Present Worth ($153,000)
Year
0
Page 3
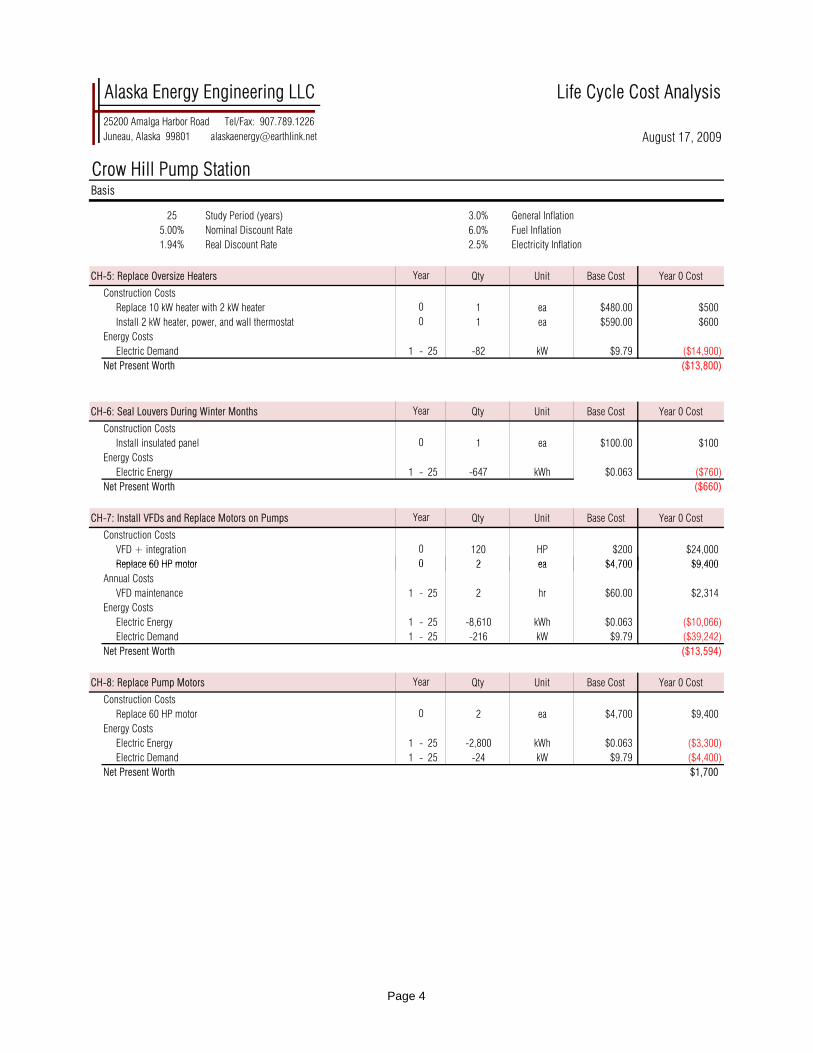
Alaska Energy Engineering LLC Life Cycle Cost Analysis25200 Amalga Harbor Road Tel/Fax: 907.789.1226Juneau, Alaska 99801 [email protected]
Crow Hill Pump StationBasis
25 Study Period (years) 3.0% General Inflation5.00% Nominal Discount Rate 6.0% Fuel Inflation1.94% Real Discount Rate 2.5% Electricity Inflation
CH-5: Replace Oversize Heaters Qty Unit Base Cost Year 0 Cost
Construction CostsReplace 10 kW heater with 2 kW heater 1 ea $480.00 $500Install 2 kW heater, power, and wall thermostat 1 ea $590.00 $600
Energy CostsElectric Demand 1 - 25 -82 kW $9.79 ($14,900)
Net Present Worth ($13,800)
CH-6: Seal Louvers During Winter Months Qty Unit Base Cost Year 0 Cost
Construction CostsInstall insulated panel 1 ea $100.00 $100
Energy CostsElectric Energy 1 - 25 -647 kWh $0.063 ($760)
Net Present Worth ($660)
CH-7: Install VFDs and Replace Motors on Pumps Qty Unit Base Cost Year 0 Cost
Construction CostsVFD + integration 120 HP $200 $24,000Replace 60 HP motor 2 ea $4 700 $9 400
0
Year
Year
00
0
0
August 17, 2009
Year
Replace 60 HP motor 2 ea $4,700 $9,400Annual Costs
VFD maintenance 1 - 25 2 hr $60.00 $2,314Energy Costs
Electric Energy 1 - 25 -8,610 kWh $0.063 ($10,066)Electric Demand 1 - 25 -216 kW $9.79 ($39,242)
Net Present Worth ($13,594)
CH-8: Replace Pump Motors Qty Unit Base Cost Year 0 Cost
Construction CostsReplace 60 HP motor 2 ea $4,700 $9,400
Energy CostsElectric Energy 1 - 25 -2,800 kWh $0.063 ($3,300)Electric Demand 1 - 25 -24 kW $9.79 ($4,400)
Net Present Worth $1,700
0
Year
0
Page 4

Alaska Energy Engineering LLC Life Cycle Cost Analysis25200 Amalga Harbor Road Tel/Fax: 907.789.1226Juneau, Alaska 99801 [email protected]
Cedar Park Pump StationBasis
25 Study Period (years) 3.0% General Inflation5.00% Nominal Discount Rate 6.0% Fuel Inflation1.94% Real Discount Rate 2.5% Electricity Inflation
CP-3: Replace Oversize Heater Year Qty Unit Base Cost Year 0 Cost
Construction CostsReplace 10 kW heater with 2 kW heater 1 ea $480.00 $500
Energy CostsElectric Demand 1 - 25 -96 kW $9.79 ($17,400)
Net Present Worth ($16,900)
CP-4: Change Lighting Control Qty Unit Base Cost Year 0 Cost
Construction CostsConnect fixture to the light switch 1 ea $175.00 $200
Energy CostsElectric Energy 1 - 25 -826 kWh $0.063 ($1,000)
Net Present Worth ($800)
CP-5: Seal Cooling Louvers During Winter Months Qty Unit Base Cost Year 0 Cost
Construction CostsInstall insulated panel 1 ea $100.00 $100
Energy CostsElectric Energy 1 - 25 -216 kWh $0.063 ($300)
Net Present Worth ($200)
August 17, 2009
0
Year
0
Year
0
Net Present Worth ($200)
CP-6: Install VFDs and Replace Motors on Pumps Qty Unit Base Cost Year 0 Cost
Construction CostsVFD + integration 2 ea $11,600 $23,200Replace 50 HP motor 2 ea $3,900 $7,800
Annual CostsVFD maintenance 1 - 25 2 hr $60.00 $2,300
Energy CostsElectric Energy 1 - 25 -6,696 kWh $0.063 ($7,800)Electric Demand 1 - 25 -216 kW $9.79 ($39,200)
Net Present Worth ($13,700)
CP-7: Replace Pump Motors Qty Unit Base Cost Year 0 Cost
Construction CostsReplace 50 HP motor 2 ea $3,900 $7,800
Energy CostsElectric Energy 1 - 25 -2,186 kWh $0.063 ($2,600)Electric Demand 1 - 25 -12 kW $9.79 ($2,200)
Net Present Worth $3,000
Year
Year
0
00
Page 5

Alaska Energy Engineering LLC Life Cycle Cost Analysis25200 Amalga Harbor Road Tel/Fax: 907.789.1226Juneau, Alaska 99801 [email protected]
Bonnie Brae Pump StationBasis
25 Study Period (years) 3.0% General Inflation5.00% Nominal Discount Rate 6.0% Fuel Inflation1.94% Real Discount Rate 2.5% Electricity Inflation
BB-3: Replace Older Transformer Qty Unit Base Cost Year 0 Cost
Construction CostsReplace transformer 1 ea $4,400 $5,800
Energy CostsElectric Energy 1 - 25 -3,942 kWh $0.100 ($7,320)
Net Present Worth ($1,520)
Upgrade Pump Motors Qty Unit Base Cost Year 0 Cost
Construction CostsReplace 5 HP motor 2 ea $820 $1,640
Energy CostsElectric Energy 1 - 25 -286 kWh $0.100 ($531)
Net Present Worth $1,109
Year
Year
0
August 17, 2009
0
Page 6
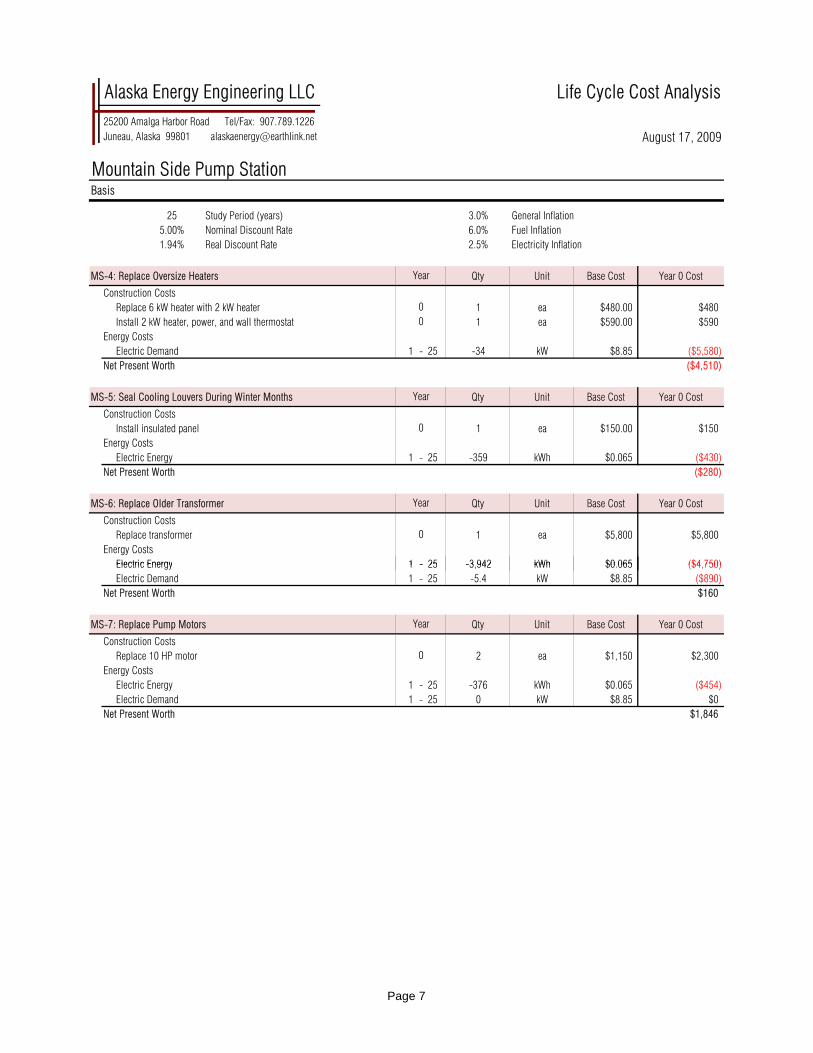
Alaska Energy Engineering LLC Life Cycle Cost Analysis25200 Amalga Harbor Road Tel/Fax: 907.789.1226Juneau, Alaska 99801 [email protected]
Mountain Side Pump StationBasis
25 Study Period (years) 3.0% General Inflation5.00% Nominal Discount Rate 6.0% Fuel Inflation1.94% Real Discount Rate 2.5% Electricity Inflation
MS-4: Replace Oversize Heaters Qty Unit Base Cost Year 0 Cost
Construction CostsReplace 6 kW heater with 2 kW heater 1 ea $480.00 $480Install 2 kW heater, power, and wall thermostat 1 ea $590.00 $590
Energy CostsElectric Demand 1 - 25 -34 kW $8.85 ($5,580)
Net Present Worth ($4,510)
MS-5: Seal Cooling Louvers During Winter Months Qty Unit Base Cost Year 0 Cost
Construction CostsInstall insulated panel 1 ea $150.00 $150
Energy CostsElectric Energy 1 - 25 -359 kWh $0.065 ($430)
Net Present Worth ($280)
MS-6: Replace Older Transformer Qty Unit Base Cost Year 0 Cost
Construction CostsReplace transformer 1 ea $5,800 $5,800
Energy CostsElectric Energy 1 - 25 -3 942 kWh $0 065 ($4 750)
0
0
0
Year
0
Year
August 17, 2009
Year
Electric Energy 1 - 25 -3,942 kWh $0.065 ($4,750)Electric Demand 1 - 25 -5.4 kW $8.85 ($890)
Net Present Worth $160
MS-7: Replace Pump Motors Qty Unit Base Cost Year 0 Cost
Construction CostsReplace 10 HP motor 2 ea $1,150 $2,300
Energy CostsElectric Energy 1 - 25 -376 kWh $0.065 ($454)Electric Demand 1 - 25 0 kW $8.85 $0
Net Present Worth $1,846
0
Year
Page 7

Alaska Energy Engineering LLC Life Cycle Cost Analysis25200 Amalga Harbor Road Tel/Fax: 907.789.1226Juneau, Alaska 99801 [email protected]
Lena Loop Pump StationBasis
25 Study Period (years) 3.0% General Inflation5.00% Nominal Discount Rate 6.0% Fuel Inflation1.94% Real Discount Rate 2.5% Electricity Inflation
LL-3: Restore Variable Speed Pumping Qty Unit Base Cost Year 0 Cost
Construction Costs1 ea $200 $200
Energy CostsElectric Energy 1 - 25 -702 kWh $0.065 ($800)Electric Demand 1 - 25 -24 kW $8.85 ($3,900)
Net Present Worth ($4,500)
LL-4: Replace Oversize Heaters Qty Unit Base Cost Year 0 Cost
Construction CostsReplace 7.5 kW heater with 2 kW heater 2 ea $480.00 $1,000Install 3 kW heater, power, and wall thermostat 1 ea $610.00 $600
Energy CostsElectric Demand 1 - 25 -128 kW $8.85 ($21,000)
Net Present Worth ($19,400)
LL-5: Seal Cooling Louvers During Winter Months Qty Unit Base Cost Year 0 Cost
Construction CostsInstall insulated panel 1 ea $100.00 $100
Energy Costs
0
Year
August 17, 2009
Year
0
0
Year
0Energy Costs
Electric Energy 1 - 25 -108 kWh $0.065 ($130)Net Present Worth ($30)
Page 8