1 business intelligence 2.0
TRANSCRIPT
C H A P T E R 1
■ ■ ■
1
Business Intelligence 2.0 Defined
What is business intelligence 2.0? This is the question this chapter aims to answer definitively. Before you dive into implementing the different concepts associated with business intelligence (BI), you need to understand it. This chapter is dedicated to demystifying what constitutes BI. As you will soon see, the term BI is very loose in that it can be attributed to a series of technologies, data, and practices, which makes its raw definition very ambiguous. Therefore, the sections of this chapter are designed to build on each other, fluidly progressing with details about BI. After you complete this chapter, the components of BI will become clear and you will have enough knowledge to understand what we will be implementing in the following chapters.
This chapter will cover the following:
• How the need to make better decisions led to the birth of decision support systems
• How the success and innovation of decision support systems in large enterprise deployments laid the foundation for BI
• The four BI architecture tiers
• Examples of BI applications
• Definitions of business intelligence 1.0 (BI 1.0) and business intelligence 2.0 (BI 2.0)
• How the challenges of BI implementations helped evolve into BI 2.0
• How to identify the differences between BI 1.0 and BI 2.0
• How BI 2.0 is transforming the intelligence landscape beyond the enterprise
• A comparison of BI 1.0 and BI 2.0
The Need to Make Better Decisions If only one term had to be used to describe the competitive business environment, it would be cutthroat. No matter what the industry or its size, every company is constantly trying to get a competitive advantage over its adversaries. Companies have been trying to one-up each other for hundreds of years,
CHAPTER 1 ■ BUSINESS INTELLIGENCE 2.0 DEFINED
2
and this is nothing new, even in current times. One way an organization can attain an edge over its competition is by making decisions that have an increased positive impact and contain less risk.
Making the proper decision on any difficult task can be hard. This is amplified in business when any decision could lead to a great success or a massive failure. Not having nor being able to understand a key piece of information could easily affect the case for selecting one decision path. Not too long ago, tough business decisions were made by long-time industry experts who had intimate knowledge of the business. These decisions were largely made on past historical or financial situations and rarely took into account data models. This led to high levels of failure, and some successful decisions could be attributed more to luck than effective decision-making techniques.
Processes for making decisions started to involve computers in the ’60s and ’70s. As the computer revolution started making its way from academia and government projects to mainstream businesses, people started leveraging computers to do continuous number crunching. Computers could process more data, and this eliminated some of the human error factors involved with complex statistics. This is where computers have an empirical advantage over humans, as they are tailored for mathematical computations and can be harnessed to run almost 24 hours per day. However, even enterprise-level computers in those days were not even close to the power of what we are used to today. Most of them couldn’t do much more than today’s programmable scientific calculator. The early horsepower of computer systems had to be specifically tailored for basic mathematical computations on data, as anything complex as artificial intelligence (AI) was completely out of the question.
Organizations quickly saw the benefit of having computer systems aid them in their everyday business processes. Even though the early computers weren’t that powerful, they could be used to garner vast amounts of data and perform complex business algorithms on it. The resultant data could then be used in the boardroom to shape corporate strategies via actionable decisions from executive information systems (EISs), group decision support systems (GDSSs), organizational decision support systems (ODSSs), and so on.
Decision Support Systems The need for company executives to make better decisions and the rapid evolution of computing power led to the birth of decision support systems (DSSs). A DSS is a type of computer information system whose purpose is to support decision-making processes. A well-designed DSS is an interactive software system that helps decision makers aggregate useful information from raw data, documents, and business models to solve problems and make decisions.
While these systems were first implemented in executive circles, they have quickly grown to be used by trained professionals as well. Various remnants of DSS software implementations can be found everywhere from the Internet to your local bank branch. For example, when you go to a bank and apply for a loan, complex DSS software is used to determine the risk to the bank based on your financial history. The result of this information will aid the loan officer as to whether the bank should make the decision to loan you money.
■ Note One of the first large-scale implementations of a DSS was the Gate Assignment Display System (GADS). This DSS was implemented at Chicago’s O’Hare Airport in 1987 in order to reduce travel delays significantly. Hundreds of computers and servers were used in order to synchronize relevant information from airplane reservations to displaying flight information to travelers.
CHAPTER 1 ■ BUSINESS INTELLIGENCE 2.0 DEFINED
3
DSSs gained tremendous popularity in the late ’80s and early ’90s. The first systems that were deployed targeted large-scale organizations that needed help with large amounts of data which included the government, and the automobile and health care industries. These systems were very successful and delivered tremendous return on investment.
Early DSS projects, while largely successful, did have some challenges however:
• Customizability: DSS software did not exist in the way it does today. A vendor couldn’t simply download a tool or customize a preexisting system. Usually, these tools had to be designed and programmed from scratch.
• Multiple vendors: Implementations of early DSSs were a mix of software, hardware, servers, networking, and back-end services. In the ’80s and early ’90s, there wasn’t a single company that could provide all of the necessary components of complex systems at once. Multiple vendors usually worked on a single project together on a single DSS implementation.
• Uniqueness: Early DSS software was unique and often the first of its kind. This usually meant that a great deal of planning had to be done to get concepts moved from theory into a working information system. Architects and programmers in the early days of DSS couldn’t rely on how-to guides to implement a unique custom system.
• Long deployments: Projects that included custom software and hardware from multiple vendors obviously led to implementations that took a long time to complete.
• Expensiveness: DSS systems in the ’80s and ’90s were very expensive and easily carried budgets of tens of millions of dollars.
DSSs allowed for entire organizations to function more effectively, as the underlying software powering those organizations provided insights from large amounts of data. This aided human decision makers to apply data models into their own decision-making processes.
DSS software at its start was considered a luxury, as only the largest of organizations could afford its power. Since the software was custom and worked with the cooperation of multiple vendors, it was hard to apply these systems as reusable and resalable deployments. Tens of thousands of hours were invested in making these systems come to life. In the process of designing these complex systems, many innovations and great strides were made in the young software industry. These innovations were screaming to be let out into the wild and used in conjunction with other pieces of software.
The demand for DSS software was ripe and the vendors were beginning to taste the huge amounts of potential profits. If only they could make the software a little more generic and resalable, they could start selling smaller DSS implementations to a much larger audience. This idea led to applying the core innovations of complex DSS software into many smaller principles like data mining, data aggregation, enterprise reporting, and dimensional analysis. Enterprise software vendors started delivering pieces of DSS as separate application packages, and the early seeds of BI were sown.
Business Intelligence Is Born In the early ’90s, software vendors were offering many types of decision-making systems to enterprise clients. These applications leveraged a lot of what was learned in building complex monolithic DSS systems over the past decade, but on a smaller scale. Concepts were made more generic, and this
CHAPTER 1 ■ BUSINESS INTELLIGENCE 2.0 DEFINED
4
allowed these algorithms to be packaged into configurable software packages. In addition, implementations could be customized further with custom programming.
The new “DSS extension” software ranged from mainframe computers that performed analysis on large numerical data sets to software that created visual reports. Even though the software was provided by a variety of vendors implemented on different hardware and provided various functionalities, it still was being used for the single purpose in aiding business processes.
All of these pieces of software that shared the common goal of what they provided did not have a collective name. Each vendor described its software differently, and this added to the confusion. In 1996, the Gartner Group stamped a label on the collective technology that was being used, calling it business intelligence. Here is the exact quote from the report: “Data analysis, reporting, and query tools can help business users wade through a sea of data to synthesize valuable information from it—today these tools collectively fall into a category called ‘Business Intelligence.’”
■ Note As of 2001, the Gartner Group is now known as Gartner, Inc. (www.gartner.com). It is a publicly traded company that specializes in research of technology concepts. Its specialty areas lie with large companies as well as the government. Gartner’s research services are used by many executives to gain insight on upcoming industry trends and in what technologies those executives should be investing.
Business Intelligence Defined BI defines a category of applications, practices, and presentations that help users make sense of a mountain of data. In my opinion, Gartner’s definition of BI is correct; however, to someone unfamiliar with BI, it still leaves many questions unanswered. BI does not have an explicit definition, and this gives many people a little trouble when trying to comprehend it initially.
In a nutshell, the term business intelligence is an umbrella term for not just applications, but also for intangible practices and skills that are constantly evolving. Therefore, it is hard to grasp the term properly unless the whole context can be evaluated. Trouble with comprehending BI fully can also be amplified when business users use the term improperly.
■ Note The definition of Internet is similar to the term business intelligence, as it is not simple to define. If you had to describe to someone what the Internet was, what would you say? You might have been using the Internet for over a decade and still not be able to properly articulate it in layman’s terms. For example, in 2006, senator Ted Stevens (Alaska) referred to the Internet as a “series of tubes,” and this led many people to label him as someone who did not understand technology. In my opinion, his definition is a pretty good one of what the Internet is at its core. But as you can see with ambiguous or umbrella terms, it is very hard to be correct without the purist community pointing out a flaw.
CHAPTER 1 ■ BUSINESS INTELLIGENCE 2.0 DEFINED
5
BI Terms In the preceding sections, I have provided some background information about BI. We are at a point where I want to define the BI terms that are used in this book. Usually in technical books, you’ll find this section in the Introduction. However, since this book is targeting several audiences that may not have a good grasp of what BI is, I wanted to do it after the intro.
• Business intelligence (BI) in this book refers to the industry concept as a whole, similar to the way Gartner defined it. The scope of the term business intelligence includes the software, best practices, data algorithms, and so on that can be used in aiding business users in their work.
• Business intelligence 1.0 (BI 1.0) in this book refers to BI applications, practices, and so on that have been implemented using a specific feature set (which I will define later in this chapter). Similarly to the way we define software versions, it applies a version of 1.0 to define the feature scope explicitly. BI 1.0 applications have been around since 1996.
• Business intelligence 2.0 (BI 2.0) in this book refers to BI applications, practices, and so on that have been implemented using a specific feature set (which I will define later in this chapter) leveraging newer software design practices. BI 2.0 is an extension of BI 1.0 and aims to evolve the feature set of BI. Similarly to the way we define software versions, it applies a version of 2.0 to define the feature scope explicitly. Unlike BI 1.0, BI 2.0 applications have just started making their way into the mainstream.
■ Note Business intelligence 1.0 is also referred to as classic business intelligence, as some of its core implementation concepts are becoming obsolete. Furthermore, BI 1.0 is being substituted by BI 2.0, and this is another reason for the “classic” reference.
■ Note Business intelligence 2.0 is also referred to as next-generation business intelligence, as some of its principles and tenets are still being refined. Once formally defined, these concepts will be driving next-generation BI software. This book and the examples and concepts it covers in the chapters ahead will be applying BI 2.0 concepts.
The distinction between the BI terms is very important to understand. Right now, what you should understand is that the term business intelligence refers to the technology of aiding business users in their respective organizations. When the term business intelligence is used, it encompasses both BI 1.0 and BI 2.0 implementations. BI 1.0 and BI 2.0, on the other hand, are implementations of business intelligence ideas using software methodologies. The reason why most people agree to assign these “fake software versions” to them is because BI 1.0 applications share distinct similarities in how they are designed across different vendors. Furthermore, BI 2.0 aims to extend BI 1.0 further, and those applications have
CHAPTER 1 ■ BUSINESS INTELLIGENCE 2.0 DEFINED
6
evolved different implementations that warrant the “2.0” label. Later on in this chapter, I will break down the distinct differences of what the two versions of BI encompass.
■ Note The term BI 2.0 has its roots in the popularity of the semantic term Web 2.0. Web 2.0 is discussed in the “How BI 2.0 Came to Be” section later in this chapter.
Architecture of a Business Intelligence System At this point, you should understand the core definition of BI and the theory behind the technology. However, understanding a definition of a technology that you may not be familiar with does not mean much. You can only claim to truly understand a technology concept when you start thinking about implementation scenarios. When you start thinking about how you could use it to aid you in your everyday work or how it can improve a business process, then you have grasped more than just the theory behind it.
A fully implemented BI system has a lot of moving data, modules, processes, and components. BI systems tend to be some of the most complex pieces of software implemented in an organization because of the involvement of many disconnected systems. Therefore, an important concept to understand is that a BI implementation is a lot more than just the software that surfaces the BI data to the user.
In order to make this clearer, we will take a look at a mock BI system a consulting company may use. By laying out the high-level architecture, I will show the pieces that go into a complete BI implementation. Furthermore, you will be able to clearly see how the BI system comes together and why it is fairly complex to implement properly.
Component Overview of a BI Architecture In this section, we will look at the major components of the BI architecture. The four main tiers of a BI implementation are the data feeds, the extract-transform-load process, the data warehouse, and the presentation layer. The example I decided to use while describing these components is a high-level implementation at some fictitious consulting company.
The consulting industry deals with lots of information on a daily basis. A large consulting company (over 100 consultants) needs to keep track of a great deal of information in order to be efficient and maximize profits. It is hard to attain key insights from different systems with large amounts of data that changes rapidly. This example will show how a consulting company can leverage BI into improving the health of its business.
A typical consulting company deals with projects on an hourly basis or fixed-fee projects. Hourly projects usually require consultants to enter their time into a time entry system so that invoices can be delivered to their respective clients. A fixed-fee project may also require time entry to ensure that the project remains on track and is profitable. Time entry and revenue information are enough to do some interesting analysis on the health and profitability of a business. However, BI is all about bringing information from different systems and making sense of that data. If we add human resources (HR) information into our data feeds, then we can consume interesting information like payroll and costs associated with having the consultant as an employee. Having data sourced from different systems will allow us to create interesting data aggregates that will deliver information from both systems at once on a single screen or UI module.
CHAPTER 1 ■ BUSINESS INTELLIGENCE 2.0 DEFINED
7
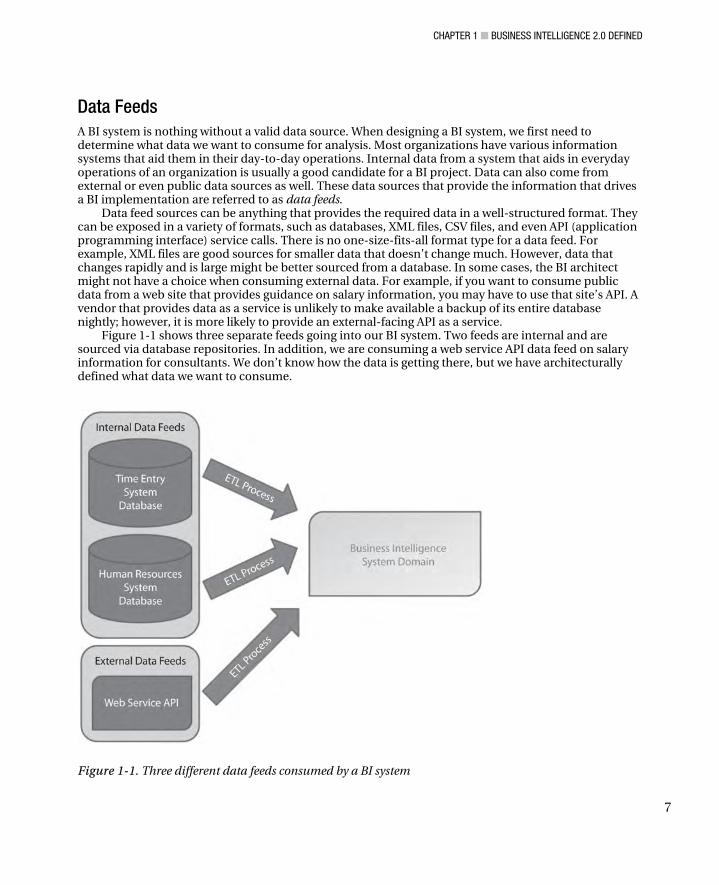
Data Feeds A BI system is nothing without a valid data source. When designing a BI system, we first need to determine what data we want to consume for analysis. Most organizations have various information systems that aid them in their day-to-day operations. Internal data from a system that aids in everyday operations of an organization is usually a good candidate for a BI project. Data can also come from external or even public data sources as well. These data sources that provide the information that drives a BI implementation are referred to as data feeds.
Data feed sources can be anything that provides the required data in a well-structured format. They can be exposed in a variety of formats, such as databases, XML files, CSV files, and even API (application programming interface) service calls. There is no one-size-fits-all format type for a data feed. For example, XML files are good sources for smaller data that doesn’t change much. However, data that changes rapidly and is large might be better sourced from a database. In some cases, the BI architect might not have a choice when consuming external data. For example, if you want to consume public data from a web site that provides guidance on salary information, you may have to use that site’s API. A vendor that provides data as a service is unlikely to make available a backup of its entire database nightly; however, it is more likely to provide an external-facing API as a service.
Figure 1-1 shows three separate feeds going into our BI system. Two feeds are internal and are sourced via database repositories. In addition, we are consuming a web service API data feed on salary information for consultants. We don’t know how the data is getting there, but we have architecturally defined what data we want to consume.
Figure 1-1. Three different data feeds consumed by a BI system
CHAPTER 1 ■ BUSINESS INTELLIGENCE 2.0 DEFINED
8
■ Note Time entry and HR systems are highly transactional with multiple updates happening every minute. Using the underlying databases directly as the source for data is not a good idea. The data feed sources need to pull data that is transitionally accurate, and pulling them from a live system does not guarantee that. Furthermore, large-scale data pulls can adversely affect the performance of the underlying system.
Most BI implementations use a snapshot or a backup of the data that happens at a given point in time. The snapshots can be in the form of synchronization that can give an almost real-time feed to the data; alternatively, snapshots of the data can be taken at monthly intervals. This allows the data feed to “bridge” itself from the operations and transactions of the system.
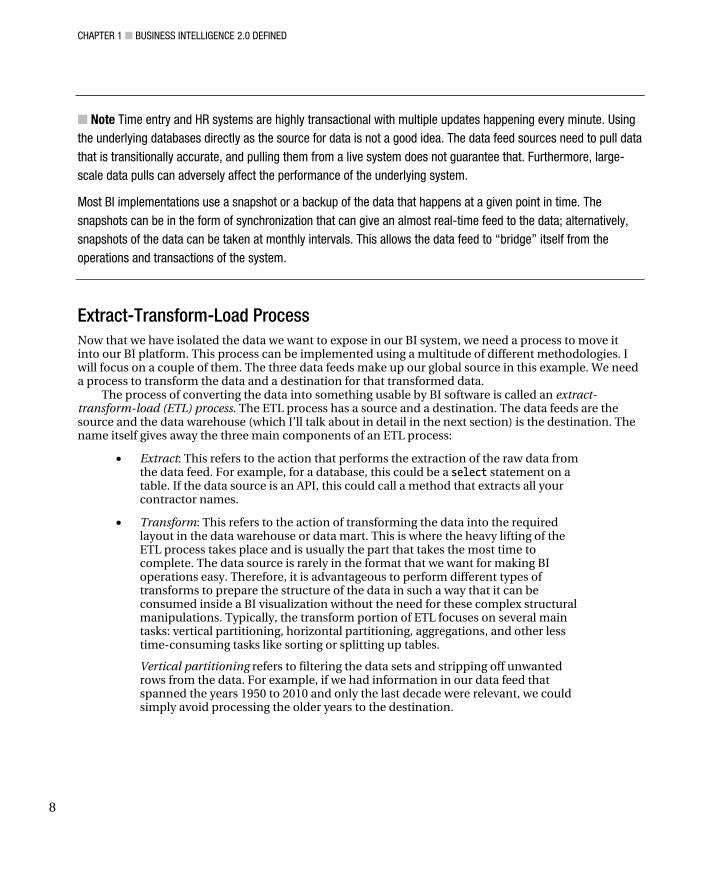
Extract-Transform-Load Process Now that we have isolated the data we want to expose in our BI system, we need a process to move it into our BI platform. This process can be implemented using a multitude of different methodologies. I will focus on a couple of them. The three data feeds make up our global source in this example. We need a process to transform the data and a destination for that transformed data.
The process of converting the data into something usable by BI software is called an extract-transform-load (ETL) process. The ETL process has a source and a destination. The data feeds are the source and the data warehouse (which I’ll talk about in detail in the next section) is the destination. The name itself gives away the three main components of an ETL process:
• Extract: This refers to the action that performs the extraction of the raw data from the data feed. For example, for a database, this could be a select statement on a table. If the data source is an API, this could call a method that extracts all your contractor names.
• Transform: This refers to the action of transforming the data into the required layout in the data warehouse or data mart. This is where the heavy lifting of the ETL process takes place and is usually the part that takes the most time to complete. The data source is rarely in the format that we want for making BI operations easy. Therefore, it is advantageous to perform different types of transforms to prepare the structure of the data in such a way that it can be consumed inside a BI visualization without the need for these complex structural manipulations. Typically, the transform portion of ETL focuses on several main tasks: vertical partitioning, horizontal partitioning, aggregations, and other less time-consuming tasks like sorting or splitting up tables.
Vertical partitioning refers to filtering the data sets and stripping off unwanted rows from the data. For example, if we had information in our data feed that spanned the years 1950 to 2010 and only the last decade were relevant, we could simply avoid processing the older years to the destination.
CHAPTER 1 ■ BUSINESS INTELLIGENCE 2.0 DEFINED
9
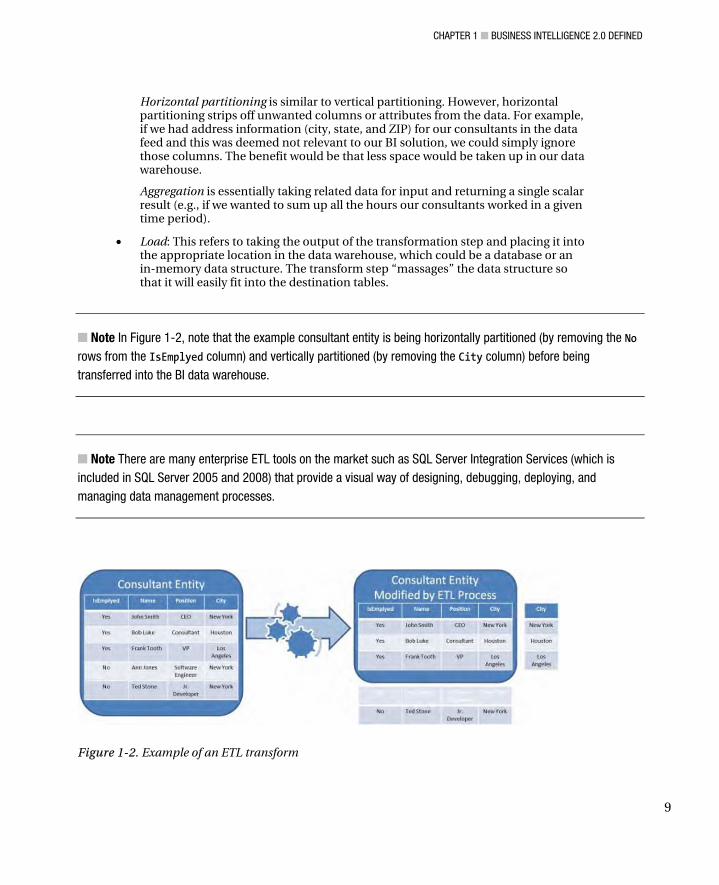
Horizontal partitioning is similar to vertical partitioning. However, horizontal partitioning strips off unwanted columns or attributes from the data. For example, if we had address information (city, state, and ZIP) for our consultants in the data feed and this was deemed not relevant to our BI solution, we could simply ignore those columns. The benefit would be that less space would be taken up in our data warehouse.
Aggregation is essentially taking related data for input and returning a single scalar result (e.g., if we wanted to sum up all the hours our consultants worked in a given time period).
• Load: This refers to taking the output of the transformation step and placing it into the appropriate location in the data warehouse, which could be a database or an in-memory data structure. The transform step “massages” the data structure so that it will easily fit into the destination tables.
■ Note In Figure 1-2, note that the example consultant entity is being horizontally partitioned (by removing the No rows from the IsEmplyed column) and vertically partitioned (by removing the City column) before being transferred into the BI data warehouse.
■ Note There are many enterprise ETL tools on the market such as SQL Server Integration Services (which is included in SQL Server 2005 and 2008) that provide a visual way of designing, debugging, deploying, and managing data management processes.
Figure 1-2. Example of an ETL transform
CHAPTER 1 ■ BUSINESS INTELLIGENCE 2.0 DEFINED
10
The Data Warehouse The data warehouse is a storage repository for data that is used in BI software. The end result of the ETL process is a data repository that is highly optimized for analysis and querying.
Data warehouses tend to hold a great deal of historical information and tend to have large storage requirements. Therefore, they are usually stored in enterprise database software (such as Microsoft SQL Server) that allows for optimal use of the server hardware.
The data warehouse can be the primary repository that communicates with BI tools in the presentation layer or it can be used as a staging area for further data transformations. For example, from our data warehouse, we could create a set of Analysis Services cubes for multidimensional analysis or create secondary smaller data marts for reporting or querying.
■ Note A hub-and-spoke architecture includes a central data hub (usually a data warehouse) that feeds data into separate spokes (usually data marts). The hub is a very large data warehouse that is too cumbersome to satisfy all of the BI needs. It is used as a staging area and further broken down into smaller data marts, or spokes, that better satisfy the query needs of BI operations.
The BI Presentation Layer (Presentation of Knowledge) The presentation layer is a logical tier in the architecture where BI client software is used by the business users. The responsibility of these visual tools is to surface the data cleanly from a data warehouse or data mart to the user. This tier is sometimes referred to as the presentation of knowledge, as it is responsible for presenting not just data but insight in an easy-to-consume format.
In a typical BI implementation, usually there isn’t just one type of presentation software used. BI client software includes specific tools for different audiences. For example, a company executive may be interested in a high-level overview of the business and prefer looking at the data in a highly visual format such as a dashboard or a report. Conversely, a financial analyst who is very familiar with the data might prefer the power of a spreadsheet-like format, forgoing some of the simplicity of charts and graphs. This is why most BI software implementations provide a mixed bag of tools that is tailored to not only specific tool functionality but the audience as well.
Presentation tools can take many different forms, including web, desktop, and mobile. Furthermore, they can be homegrown, custom-developed pieces of software or third-party pieces of software that sit on top of data warehouse structures. For example, Microsoft Performance Point Server is a piece of software that exposes multidimensional data that is found in Analysis Services cubes.
Challenges of Bringing the BI Tiers Together The four core BI components come together and form a complete BI solution. Each tier plays an important role in keeping the system current and running. As you can probably guess, implementing and maintaining a system like this is not easy and is fairly complex.
Very simple errors in the first tiers could have a ripple effect into the entire system, making pieces of the implementation meaningless. Developing on an existing piece of BI software is not trivial. The BI system has a total of four complex tiers that need to communicate with each other effectively. Adding a
CHAPTER 1 ■ BUSINESS INTELLIGENCE 2.0 DEFINED
11
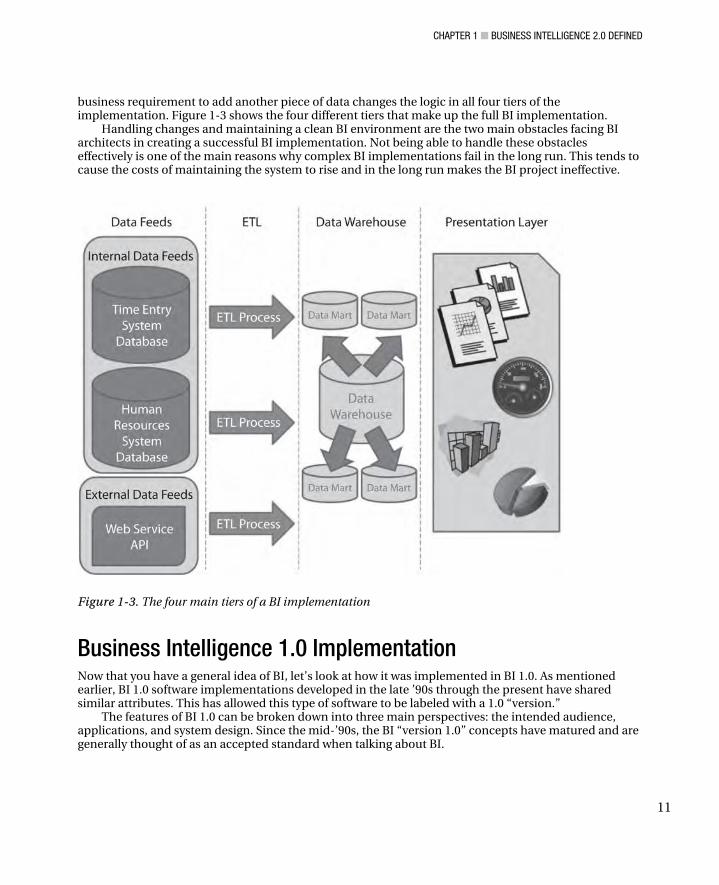
business requirement to add another piece of data changes the logic in all four tiers of the implementation. Figure 1-3 shows the four different tiers that make up the full BI implementation.
Handling changes and maintaining a clean BI environment are the two main obstacles facing BI architects in creating a successful BI implementation. Not being able to handle these obstacles effectively is one of the main reasons why complex BI implementations fail in the long run. This tends to cause the costs of maintaining the system to rise and in the long run makes the BI project ineffective.
Figure 1-3. The four main tiers of a BI implementation
Business Intelligence 1.0 Implementation Now that you have a general idea of BI, let’s look at how it was implemented in BI 1.0. As mentioned earlier, BI 1.0 software implementations developed in the late ’90s through the present have shared similar attributes. This has allowed this type of software to be labeled with a 1.0 “version.”
The features of BI 1.0 can be broken down into three main perspectives: the intended audience, applications, and system design. Since the mid-’90s, the BI “version 1.0” concepts have matured and are generally thought of as an accepted standard when talking about BI.
CHAPTER 1 ■ BUSINESS INTELLIGENCE 2.0 DEFINED
12
BI 1.0’s Intended Audience You already know that BI is software that aids business professionals in their everyday work. However, who are the “business professionals” that specifically use BI tools?
Many of us take the current state of computer technology for granted. Just two decades ago, many organizations still relied on paper rather than providing their data to employees electronically. However, the productivity of computers quickly gave way to many organizations implementing computer systems to aid their workers. Many of the initial computer systems were created years before visual design patterns were popular; thus, they were not intuitive to learn. Finally, you did not start to see GUI (graphical user interface) standardization until the mid-’90s, and many software vendors implemented interfaces differently. For the user, this meant having to relearn similar functions all over each time new software was implemented. What is my point? Business users who were also pretty good with navigating complex software were a hard commodity to find until after the Internet boom. Software was not designed to be intuitive, and different vendors did not help by adding their own implementation of common tasks.
BI 1.0 implementations not only required users to understand software, but also needed someone who understood the data behind it. BI is all about delivering valuable insight from analyzing large amounts of data. If someone can navigate through the data sets but cannot analyze it or—even worse—cannot understand what they are looking at, what good is the system? Effective BI 1.0 users needed to do both of these tasks; thus, the intended audience was limited to tech-savvy business users that had intricate domain knowledge of the company’s data.
Two Distinct Users of BI 1.0 In order to fully utilize BI 1.0 software, business professionals had two basic requirements: they had to be good with navigating complex computer software, and they needed specific domain knowledge of their organization’s data. BI 1.0 business professionals usually ended up being analysts that had a background in finance, statistics, mathematics, or other analytical fields.
This had the effect of splitting up the BI 1.0 audience into two groups: power users and consumers. Power users of BI were professionals that were able to use all the BI software tools as well as comprehend the knowledge the tools provided. The consumers, on the other hand, just consumed the derived insight from BI and rarely used the BI 1.0 tools.
■ Note We have all seen a movie or a TV show where the main character is stressed out and has to deliver a report to his boss on a tight deadline. This is essentially how you can relate to the BI 1.0 power user. They were the ones using the software and performing the detailed analysis. The result from the analytics they performed could have been a report that they delivered to their boss. Their boss would “consume” the BI data at a higher level; however, usually they would be abstracted completely from the process of performing the actual analytics and using BI software.
CHAPTER 1 ■ BUSINESS INTELLIGENCE 2.0 DEFINED
13
The essential takeaway is that BI 1.0 software was created such that it limited its full adoption to the power users, who were a select few in the whole organization. Even though BI analytical information was consumed by a larger amount of people, not everyone was tech savvy or had the deep understanding of the data to use it.
BI 1.0 has the drawback of its inherent complexity. It creates a “middle layer” of analysts that are responsible for delivering the insight to a higher level. This summarized data can be used to perform decision-making activities.
You as a Business Intelligence Consumer
My wife is always trying to get me to eat healthier. She constantly e-mails me articles about what to eat or what not to eat. It seems that I see one type of research that says a certain food is good for you, and then the next week I get an article that contradicts that finding. If you are like me, you are probably more confused as to what is healthy and what isn’t. This is a great example that puts you into the role of a BI 1.0 consumer, as you have to rely on the findings.
Let’s take a look at a high level how the process of recommending a food as “healthy” goes. On one side of the process, we have researchers who create the experiments to determine if a piece of food can be deemed healthy or unhealthy. The researchers perform the various tests and compile the data from the subjects. This research process is very analogous to the work analysts perform in their organizations. The findings are then presented in an academic journal or in a web article, and then the insight is consumed by the reader.
As you can see, this follows the BI 1.0 consumer audience process very well. The consumer is not really part of the analysis and has to rely on the validity of the research performed. As I mentioned above, you seemingly get contradicting data on what is healthy depending on who does the research. This is exactly the problem that challenges executives in organizations. Executives are not part of the analysis process and are handed just a summary of the wisdom from their analysts. They essentially have to trust their team to give them good analysis.
There are many other examples in everyday life that place you in the role of a BI consumer. Given the differences with research findings on healthy/unhealthy food, I hope you can relate better to the issues that can arise with this kind of model.
Proper Understanding of BI Models BI software can be very powerful in the right hands. The initial tendency in BI was to allow users an “open realm” where they could model and look at the data in any shape they wanted to. While giving more options to analyze data is powerful, it has several drawbacks. The obvious drawbacks are that the user has to learn the software and be well versed with the data (these are the essential BI 1.0 requirements for the end user). However, software that allows an open analysis of company data could lead to disastrous errors. When using complex software, users might quickly create models that are error prone, or they might not fully understand the model they are implementing. This could actually lead to potentially poor decisions made from the analysis of the data. BI is supposed to make decisions easier and remove a degree of risk. Having a complex BI system that can have a higher degree of errors could actually have the opposite effect and increase decision-making costs.
CHAPTER 1 ■ BUSINESS INTELLIGENCE 2.0 DEFINED
14
Applications BI 1.0 applications were the first generation of applications that were derived from DSS concepts. No standards existed for this type of software, and many software types were clear innovations in their own areas.
The implementation of BI 1.0 applications initially favored a desktop application installed on a workstation. These applications were usually developed in a higher-level language such as C++, Java, or Visual Basic. The application would receive information from a data store usually via a client-server messaging architecture.
The initial focus of BI was putting the data in front of clients and allowing them the power to create complex data models. One of the most popular tools that allowed this was the spreadsheet.
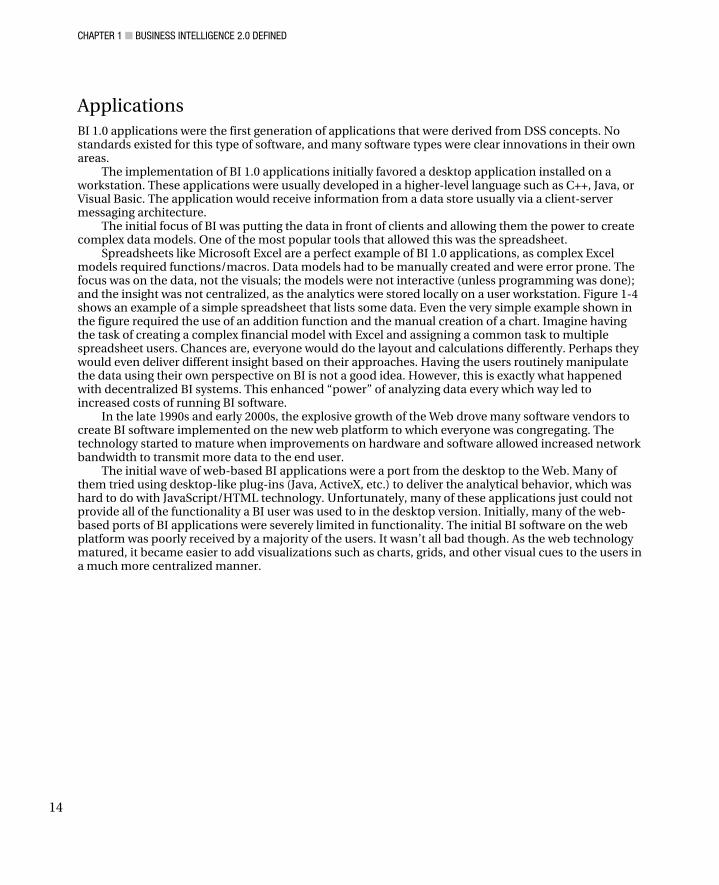
Spreadsheets like Microsoft Excel are a perfect example of BI 1.0 applications, as complex Excel models required functions/macros. Data models had to be manually created and were error prone. The focus was on the data, not the visuals; the models were not interactive (unless programming was done); and the insight was not centralized, as the analytics were stored locally on a user workstation. Figure 1-4 shows an example of a simple spreadsheet that lists some data. Even the very simple example shown in the figure required the use of an addition function and the manual creation of a chart. Imagine having the task of creating a complex financial model with Excel and assigning a common task to multiple spreadsheet users. Chances are, everyone would do the layout and calculations differently. Perhaps they would even deliver different insight based on their approaches. Having the users routinely manipulate the data using their own perspective on BI is not a good idea. However, this is exactly what happened with decentralized BI systems. This enhanced “power” of analyzing data every which way led to increased costs of running BI software.
In the late 1990s and early 2000s, the explosive growth of the Web drove many software vendors to create BI software implemented on the new web platform to which everyone was congregating. The technology started to mature when improvements on hardware and software allowed increased network bandwidth to transmit more data to the end user.
The initial wave of web-based BI applications were a port from the desktop to the Web. Many of them tried using desktop-like plug-ins (Java, ActiveX, etc.) to deliver the analytical behavior, which was hard to do with JavaScript/HTML technology. Unfortunately, many of these applications just could not provide all of the functionality a BI user was used to in the desktop version. Initially, many of the web-based ports of BI applications were severely limited in functionality. The initial BI software on the web platform was poorly received by a majority of the users. It wasn’t all bad though. As the web technology matured, it became easier to add visualizations such as charts, grids, and other visual cues to the users in a much more centralized manner.
CHAPTER 1 ■ BUSINESS INTELLIGENCE 2.0 DEFINED
15
Figure 1-4. Even basic Excel spreadsheets require an understanding of functions.
■ Note In order to see examples of bad BI platform ports, do a web search with some of the keywords mentioned previously. There are a lot of great articles out there from several years ago that detail many failures of desktop-to-web ports of BI software. Some people who deem the “initial BI implementations” (BI 1.0) failures point to the inflexibility of the systems to be adopted by other platforms, such as the Internet.
CHAPTER 1 ■ BUSINESS INTELLIGENCE 2.0 DEFINED
16
BI software started improving as developers got a better understanding of the web platform. The web platform was used to deliver content to users from a centralized location. This started to mitigate some of the problems with users storing insight locally and delivered the analytical tools in a common shared format.
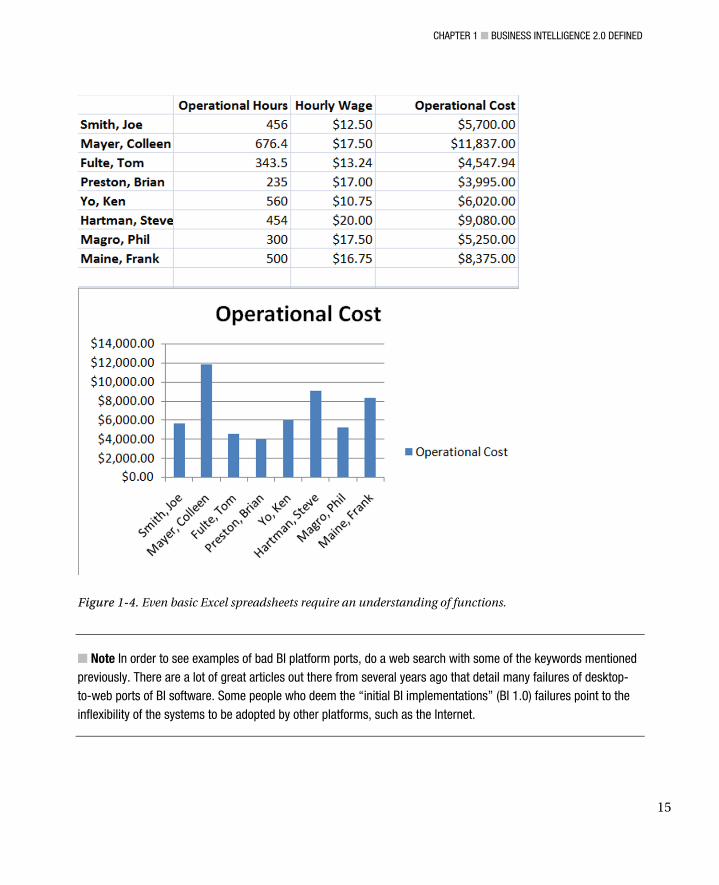
One example of how this was done is web-based reporting. Web-based reporting in the BI 1.0 time frame was usually a static report that was either printed out or distributed electronically to a set of users. These reports were not interactive and were essentially the result of the work done by an author who manually created these reports. Figure 1-5 shows a sample Microsoft Reporting Services report that could be delivered to many consumers. These reports had to be authored manually and provided very little interaction. Basic interactivity could be added via parameter controls like drop-downs; however, the end result was still another view of the same data.
Figure 1-5. Sample AdventureWorks report from Microsoft Reporting Services
Static and Noninteractive Data Static and noninteractive reports reiterate the drawbacks of BI 1.0, as first the reports need to be created by a business analyst, and then the insight needs to be delivered to some consumer (an executive). The problem with this approach is that the consumer misses out on important information such as how the data got there and the process of deriving the resultant analytics. In this approach, the consumer relies entirely on the competence of the person using the BI tools. What if the consumer of the data has additional information that is necessary for the analysis? What if the consumer is unaware of an inefficient or—even worse—outdated process to attain the data? This approach has its clear disadvantages and incurs additional costs of maintaining better processes so that consumers and analysts are on the same page. It would be much better if the consumer of the BI could also perform the analytics. In order for that to happen, however, the tools had to become simpler and easier to use.
CHAPTER 1 ■ BUSINESS INTELLIGENCE 2.0 DEFINED
17
■ Note Some of the drawbacks of not having the consumer see where the numbers came from could be mitigated by creating a “drill-down” report. This type of report allowed the consumer to click additional links to navigate to the underlying details of the summarized data. However, these kinds of reports usually had to be manually created and included custom code.
System Design System design is another big component that BI shares across different software vendors. BI 1.0 systems are much like Figure 1-3 (shown previously), which depicts complex and monolithic systems with dependencies.
As mentioned in the preceding section, initial BI 1.0 concepts came from innovations from DSS. These systems were proprietary, and many software vendors were providing innovations not seen before in business software. The fact that BI companies were creating unique intellectual property usually meant that they were operating under a closed architecture and wary of opening up their system algorithms. However, this did not stop vendors from opening up some of their functionality via APIs. These APIs were unfortunately implemented via custom scripting languages that usually varied across vendors. This underscores one of the disadvantages of BI 1.0 software: lack of standardization.
■ Note One example of a proprietary language that is used to retrieve information from multidimensional structures is MDX, Microsoft’s language to query OLAP cubes. For example, developers who want to consume the data from an Analysis Services cube can write MDX and expose it inside their custom applications. MDX can also be natively used as a query language inside Reporting Services or Excel. This may seem like a standard architecture until you realize this is limited to the Microsoft BI stack only. While MDX support is provided by many tooling vendors that hook into Analysis Services, MDX is not used as a query language beyond the Microsoft domain. Although MDX is a powerful language, it has many drawbacks in distributed BI architecture that truly limit its usefulness.
BI 1.0 software tools were themselves designed and programmed by a software vendor. During the time of BI 1.0, agile development methodologies weren’t yet popular. Most software was written and designed using classic development processes such as the waterfall method. Complex BI implementations truly exposed the limitations of these classic software methodologies. Using these methodologies, the requirements were all gathered first and converted into big specifications. With these inherently complex systems, many things were usually overlooked, and this led to software that was hard to change after programming had started.
BI 1.0 systems are usually very rigid. As shown previously in Figure 1-3, a multiple-tier application tightly coupled to the next tier is not very flexible if you want to make a change. Furthermore, many of the data feeds that were used were also collected in a manner that did not allow for much leeway. This led to BI systems becoming “stale,” as they were not able to keep up with the demand of the changes
CHAPTER 1 ■ BUSINESS INTELLIGENCE 2.0 DEFINED
18
that rapidly happened in business. For example, changes in accounting practices or an acquisition could rapidly change the analytic landscape for an organization.
Some improvements were made in BI 1.0 apps as modular software development techniques and service orientation were used to decouple tight operations between tiers. However, it wasn’t until BI 2.0 system architecture design concepts started getting applied that progress was truly made.
Business Intelligence 2.0 Implementation At this point, you should understand at a high level how software was implemented following BI 1.0 concepts. In this section, I will cover how BI 2.0 improved and extended BI 1.0 using new technology and software design techniques.
In the BI 2.0 section, I will first describe the shift in technology that led to the migration of BI concepts to BI 2.0. This section will follow along the three main perspectives of BI: the intended audience, applications, and system design introduced in the previous section. Additionally, I will highlight some of the information from the previous section to contrast the different methodologies of BI 1.0 and BI 2.0.
How BI 2.0 Came to Be How did we get from BI 1.0 to BI 2.0? Developers and BI vendors didn’t simply wake up one day and say, “We have been writing software one way for over a decade; let’s start designing it in this new-and-improved way.”
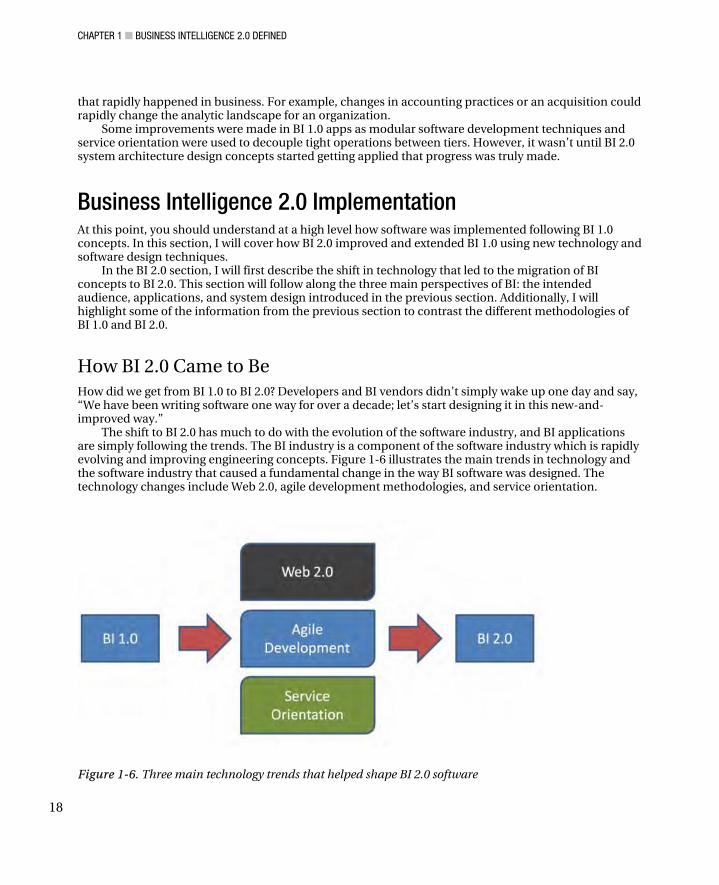
The shift to BI 2.0 has much to do with the evolution of the software industry, and BI applications are simply following the trends. The BI industry is a component of the software industry which is rapidly evolving and improving engineering concepts. Figure 1-6 illustrates the main trends in technology and the software industry that caused a fundamental change in the way BI software was designed. The technology changes include Web 2.0, agile development methodologies, and service orientation.
Figure 1-6. Three main technology trends that helped shape BI 2.0 software
CHAPTER 1 ■ BUSINESS INTELLIGENCE 2.0 DEFINED
19
■ Note The following sections are not meant to be an in-depth dive into each technology. Each of these topics could easily have its own book dedicated to it! I encourage you to do more research on any topic you want to understand in greater depth.
Web 2.0 Web 2.0 refers to the second generation of principles that govern the design, development, and utilization of the Web by developers and end users. The term Web 2.0 became a popular buzzword in 2004 and refers to using the Internet as a platform for software. Many social networking sites that started up during that time are considered Web 2.0 sites (e.g., Facebook, MySpace, and Flickr). You can interact with a web site for a few minutes and quickly make the distinction between a classic web site and a Web 2.0 web site. This same distinction applies to a BI application implemented with BI 1.0 or BI 2.0, as each will inherently behave differently.
Web 2.0 techniques advocate the use of things such as open APIs, standard syndication feeds, improved UI responsiveness (e.g., using Ajax and RIAs), and social networking. More Internet sites being created in the mid-2000s started using Web 2.0 principles and leveraged the Internet as a platform. It made sense for BI software to follow suit.
Agile Development Methodologies Agile development processes are an evolution over the classic waterfall software development processes used in the late 1990s and early 2000s. Agile development concedes the fact that most functional requirements and specs will change after development on the product starts. In order to mitigate this, agile development proposes an iterative process in which frequent surveys are made as the development of the software progresses. This allows teams to quickly adapt to changes and make alterations during the development phase, resulting in higher-quality software. Furthermore, being “agile” not only allows you to reduce the overall risk of development, but also gives you the flexibility to survive in the fast-changing world of BI.
Agile development has led to measurable changes in BI software quality. Large-scale implementations that can take months to plan and even longer to develop can be more flexible. Agile development methodologies mitigate some of the rigidity of BI 1.0, as development sprints can quickly point out faults in design. This leads to improvements that can be made or planned for in the system long before it is scheduled to go live.
Data is gold in a BI system. Another popular agile methodology is test-driven development (TDD). TDD is a style that advocates testing your source code as you add business functionality. TDD proves out the successes or flaws in your code quickly and iteratively. It mitigates software defects by ensuring that your code changes have not added flawed logic. TDD use in BI 2.0 is very important, as it enhances code quality dramatically.
CHAPTER 1 ■ BUSINESS INTELLIGENCE 2.0 DEFINED
20
Service Orientation Figure 1-3 showed how complex and tightly coupled the different tiers in a BI implementation can be. Loose coupling should be promoted across the different tiers in order to create pluggable software components. Wouldn’t it also be better if the business logic was exposed in such a way that it could be consumed from other services? This is exactly what service orientation solves.
Service-oriented architecture (SOA) is about using a series of independent services that can communicate business logic with each other. These services can be used independently or together to form business platforms that come together and provide value. Investing in services that expose important business functionality allows for a much simpler integration effort. Furthermore, SOA allows for exposing some of the business logic as APIs and creating “mashable” applications (both of which are Web 2.0 concepts). With properly designed SOA, the services become the most important part of the BI implementation, as they end up driving the data.
In the last couple of years, you have probably heard about moving data to “the cloud.” The cloud is another abstraction of service orientation where the service architecture is hosted on the Internet. By hosting using the Internet platform, the cloud completely abstracts the technology implementation from the service consumers. Many public services are starting to be hosted on the cloud which allows you to enhance your BI offerings. For example, some government agencies provide large amounts of statistical data that can be freely consumed as a data feed in a BI system.
BI 2.0’s Intended Audience BI 2.0 is sometimes referred to as “BI for the masses.” This name should strike a powerful shift in the philosophy for which it was designed. One of the primary goals of designing a product on the next-generation BI platform is to reach an audience beyond tech-savvy business professionals.
This concept of BI for the masses does not mean just delivering BI for more people in enterprise organizations. It also strives to target the tens of millions of users of the Internet.
At its core, BI 2.0 software is designed for the nontechnical user, regardless of whether that person is a boardroom executive or just a casual Internet user. Essentially, the idea is that the applications are easy to understand. This is primarily achieved by using newer user experience–oriented design patterns that users are already familiar with. In addition, data is presented in a cleaner, more visually driven format. This allows the insight to be derived from visual cues and UI interactions rather than statistical number crunching. These designs leverage a lot of patterns that have been popularized during the Internet boom. Since these designs take advantage of standardization, the user has less to learn about the UI interactivity and can focus on other aspects.
In classic BI, users could manipulate data by writing custom macros, scripts, or functions to get answers from the data. BI 2.0 simplifies that by translating these statistical manipulations into UI interactions that users are already familiar with.
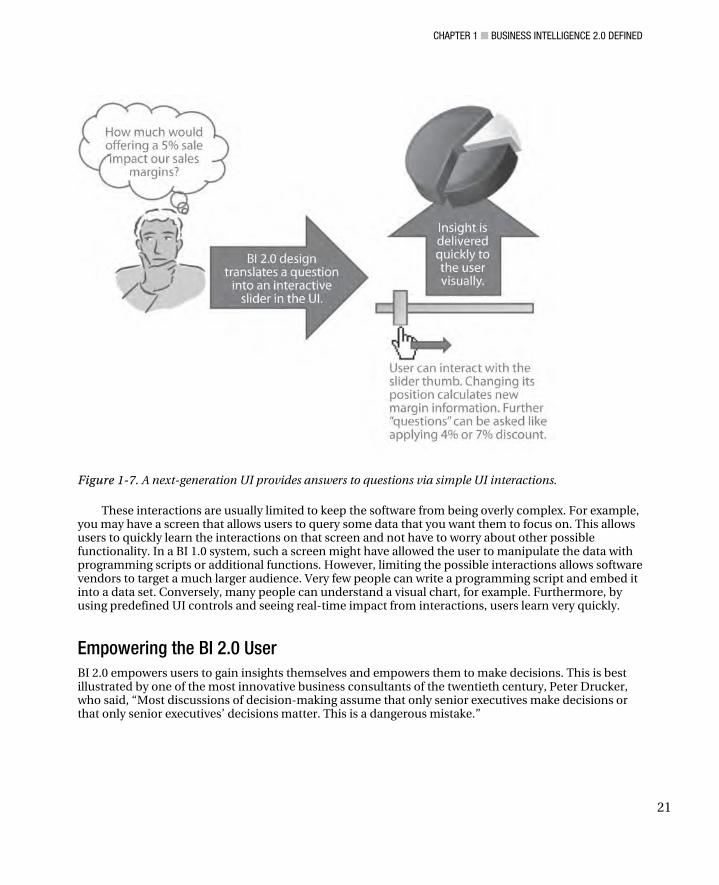
Figure 1-7 shows an example of this interaction. In the example, the user has two questions: should the company offer a 5 percent sale on its products, and how will that impact the bottom line? BI 2.0 UIs provide specific interactions to allow the user to quickly gauge if this is a good idea. In the figure, there is a slider that the user can slide to adjust the sale percentage of the products. As it slides from 0 percent to 5 percent, an algorithm processes the information and displays how this will increase sales but lower the margin on the product. The user gains real-time insight by seeing instant visual feedback from the chart. We will be implementing a very similar example in the following chapters.
CHAPTER 1 ■ BUSINESS INTELLIGENCE 2.0 DEFINED
21
Figure 1-7. A next-generation UI provides answers to questions via simple UI interactions.
These interactions are usually limited to keep the software from being overly complex. For example, you may have a screen that allows users to query some data that you want them to focus on. This allows users to quickly learn the interactions on that screen and not have to worry about other possible functionality. In a BI 1.0 system, such a screen might have allowed the user to manipulate the data with programming scripts or additional functions. However, limiting the possible interactions allows software vendors to target a much larger audience. Very few people can write a programming script and embed it into a data set. Conversely, many people can understand a visual chart, for example. Furthermore, by using predefined UI controls and seeing real-time impact from interactions, users learn very quickly.
Empowering the BI 2.0 User BI 2.0 empowers users to gain insights themselves and empowers them to make decisions. This is best illustrated by one of the most innovative business consultants of the twentieth century, Peter Drucker, who said, “Most discussions of decision-making assume that only senior executives make decisions or that only senior executives’ decisions matter. This is a dangerous mistake.”
CHAPTER 1 ■ BUSINESS INTELLIGENCE 2.0 DEFINED
22
Peter Drucker was a brilliant management consultant who came up with the term knowledge worker. He felt that too many of the decisions being made in an organization were being made by a select few. Therefore, he advocated passionately through his business philosophy that workers need to be empowered and use knowledge in order for a business to be successful. He proved that useful business information in the work environment led to more innovative and progressive organizations.
BI 2.0 is the software implementation of the “empower the users” business management concept. It is not about having analysts crunch numbers and then pass them off to an executive who can understand and derive a decision from them. BI 2.0 puts the information and knowledge right in front of all users in a simple format. Not only can users see the information quickly, but they can interact with it to produce powerful data models that can aid decision-making processes. Effective use of the knowledge in a BI system leads employees to derive strategic decisions on their own.
An important note to take away is that BI 2.0 users are not performing simple routine tasks like data scrubbing or aggregation. This makes the users more invested in the company, as they feel more valuable to the organization. As a business professional, what would you rather deliver to your boss—a new sales strategy concept derived on current market conditions or a routine monthly report? This is exactly what BI 2.0 implementations allow a user to deliver: strategic business decisions.
Applications BI 2.0 applications extend BI 1.0 design with simpler interfaces, new technology, and SOA. A large part of BI’s maturing into BI 2.0 has to do with improvements in software development.
Previously in the chapter, I covered a lot of the enhancements that are being made in BI 2.0 applications. Rather than repeating these again, let’s take a look at a couple of examples of BI 2.0 Internet applications.
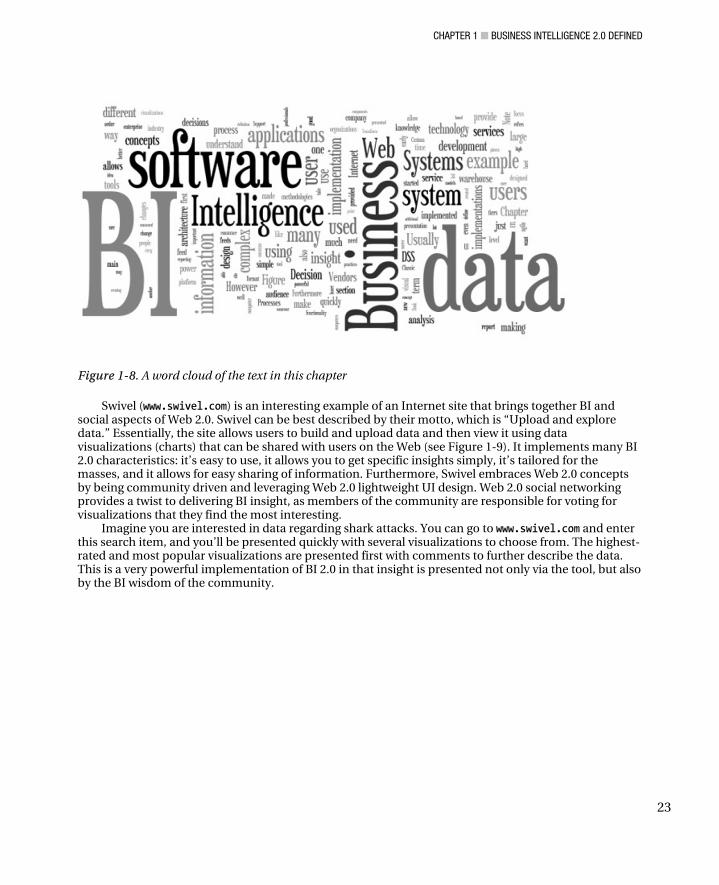
Wordle (www.wordle.net) is a site that provides a tool for creating word clouds (aka tag clouds). The site is simple to use and allows users to do everything themselves inside the tool. The user can paste in some text or provide a URL that has some kind of text. After clicking the Submit button, the user is presented with a colorful visualization that highlights the most popular words in the provided text. The graphic can then be exported or shared with others. Figure 1-8 shows a word cloud made from the text of this chapter using the Wordle tool. Think about how powerful this data visualization is. You can take text that you haven’t read and get immediate keywords to give you insight on what the text is all about. As a practical example, you could take a transcript from a president’s speech and get the key highlights of it.
This simple tool has many powerful BI 2.0 attributes driving its functionality: its process is simple, it’s easy for the average user to use, and it delivers accurate insight from the data provided. One important aspect of Wordle is the “self-service” implementation of the tool. The information is derived entirely from users’ actions and the data they provided. Therefore, Wordle is a great example of a simple BI 2.0 tool that any user can use to gain a quick analysis of their data.
CHAPTER 1 ■ BUSINESS INTELLIGENCE 2.0 DEFINED
23
Figure 1-8. A word cloud of the text in this chapter
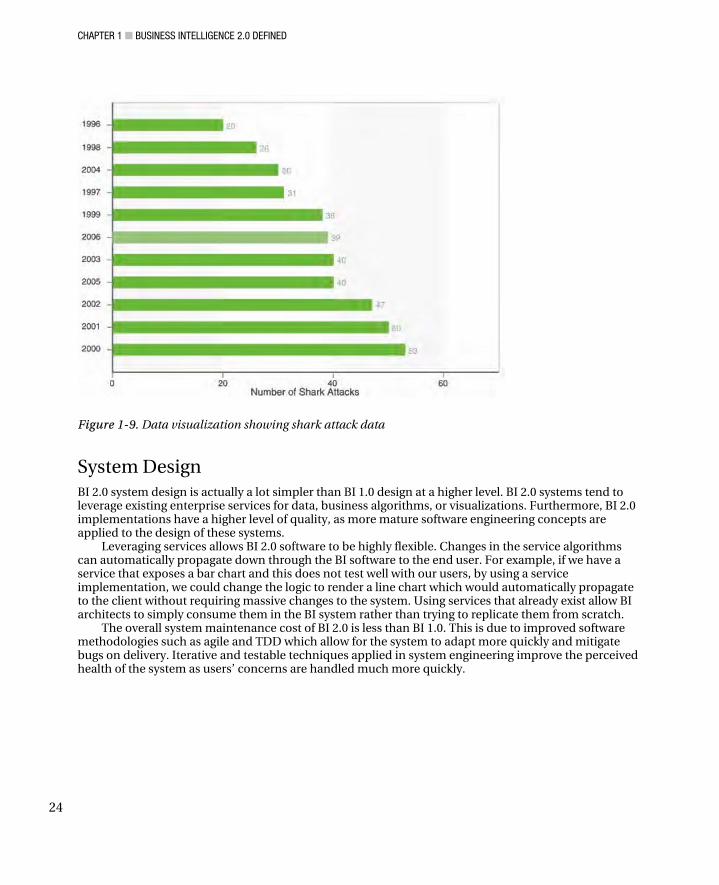
Swivel (www.swivel.com) is an interesting example of an Internet site that brings together BI and social aspects of Web 2.0. Swivel can be best described by their motto, which is “Upload and explore data.” Essentially, the site allows users to build and upload data and then view it using data visualizations (charts) that can be shared with users on the Web (see Figure 1-9). It implements many BI 2.0 characteristics: it’s easy to use, it allows you to get specific insights simply, it’s tailored for the masses, and it allows for easy sharing of information. Furthermore, Swivel embraces Web 2.0 concepts by being community driven and leveraging Web 2.0 lightweight UI design. Web 2.0 social networking provides a twist to delivering BI insight, as members of the community are responsible for voting for visualizations that they find the most interesting.
Imagine you are interested in data regarding shark attacks. You can go to www.swivel.com and enter this search item, and you’ll be presented quickly with several visualizations to choose from. The highest-rated and most popular visualizations are presented first with comments to further describe the data. This is a very powerful implementation of BI 2.0 in that insight is presented not only via the tool, but also by the BI wisdom of the community.
CHAPTER 1 ■ BUSINESS INTELLIGENCE 2.0 DEFINED
24
Figure 1-9. Data visualization showing shark attack data
System Design BI 2.0 system design is actually a lot simpler than BI 1.0 design at a higher level. BI 2.0 systems tend to leverage existing enterprise services for data, business algorithms, or visualizations. Furthermore, BI 2.0 implementations have a higher level of quality, as more mature software engineering concepts are applied to the design of these systems.
Leveraging services allows BI 2.0 software to be highly flexible. Changes in the service algorithms can automatically propagate down through the BI software to the end user. For example, if we have a service that exposes a bar chart and this does not test well with our users, by using a service implementation, we could change the logic to render a line chart which would automatically propagate to the client without requiring massive changes to the system. Using services that already exist allow BI architects to simply consume them in the BI system rather than trying to replicate them from scratch.
The overall system maintenance cost of BI 2.0 is less than BI 1.0. This is due to improved software methodologies such as agile and TDD which allow for the system to adapt more quickly and mitigate bugs on delivery. Iterative and testable techniques applied in system engineering improve the perceived health of the system as users’ concerns are handled much more quickly.
CHAPTER 1 ■ BUSINESS INTELLIGENCE 2.0 DEFINED
25
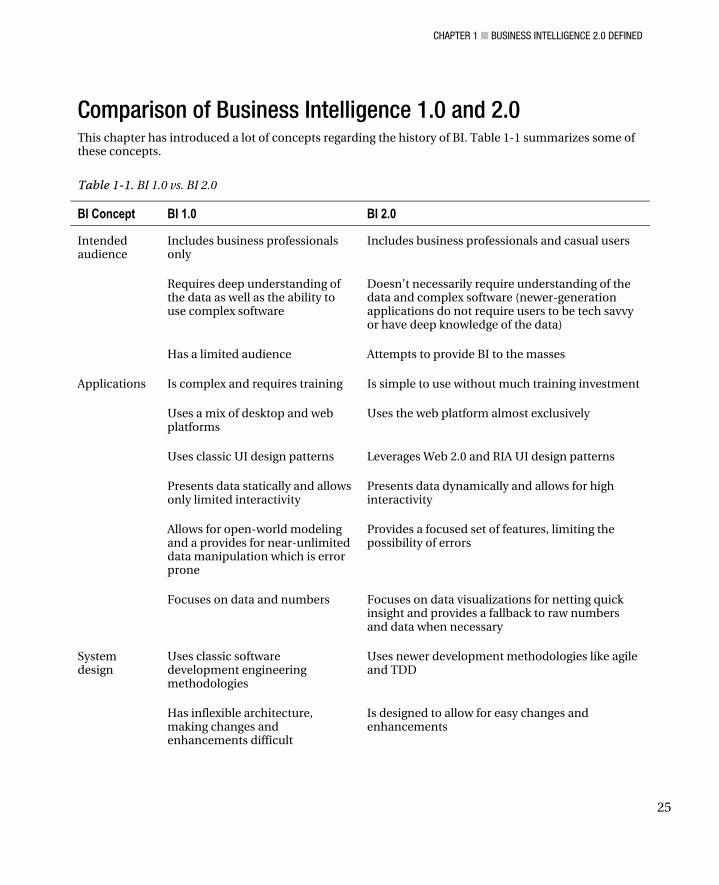
Comparison of Business Intelligence 1.0 and 2.0 This chapter has introduced a lot of concepts regarding the history of BI. Table 1-1 summarizes some of these concepts.
Table 1-1. BI 1.0 vs. BI 2.0
BI Concept BI 1.0 BI 2.0
Intended audience
Includes business professionals only
Includes business professionals and casual users
Requires deep understanding of the data as well as the ability to use complex software
Doesn’t necessarily require understanding of the data and complex software (newer-generation applications do not require users to be tech savvy or have deep knowledge of the data)
Has a limited audience Attempts to provide BI to the masses
Applications Is complex and requires training Is simple to use without much training investment
Uses a mix of desktop and web platforms
Uses the web platform almost exclusively
Uses classic UI design patterns Leverages Web 2.0 and RIA UI design patterns
Presents data statically and allows only limited interactivity
Presents data dynamically and allows for high interactivity
Allows for open-world modeling and a provides for near-unlimited data manipulation which is error prone
Provides a focused set of features, limiting the possibility of errors
Focuses on data and numbers Focuses on data visualizations for netting quick insight and provides a fallback to raw numbers and data when necessary
System design
Uses classic software development engineering methodologies
Uses newer development methodologies like agile and TDD
Has inflexible architecture, making changes and enhancements difficult
Is designed to allow for easy changes and enhancements
CHAPTER 1 ■ BUSINESS INTELLIGENCE 2.0 DEFINED
26
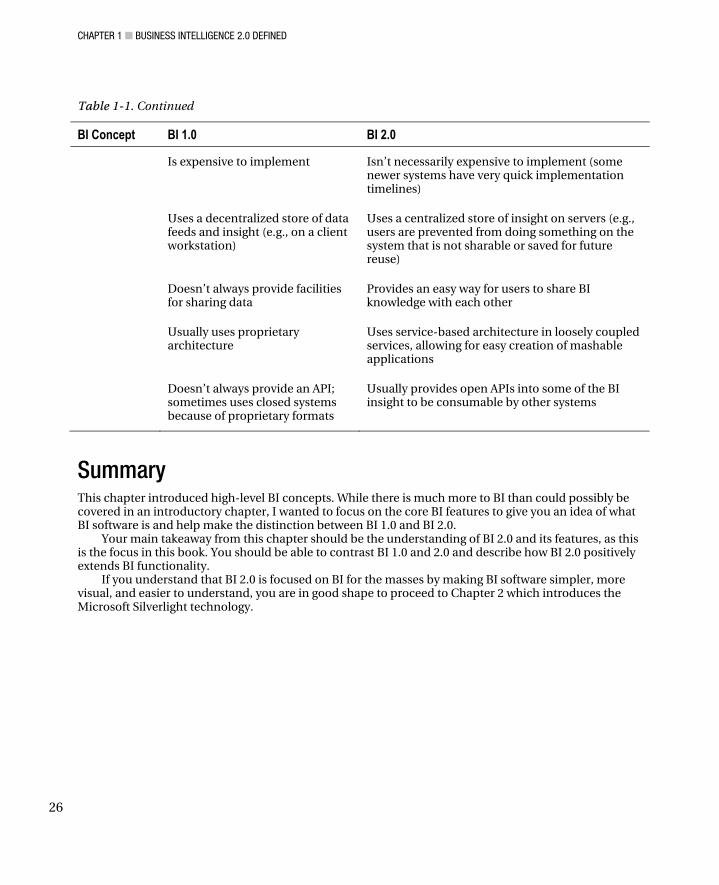
Table 1-1. Continued
BI Concept BI 1.0 BI 2.0
Is expensive to implement Isn’t necessarily expensive to implement (some newer systems have very quick implementation timelines)
Uses a decentralized store of data feeds and insight (e.g., on a client workstation)
Uses a centralized store of insight on servers (e.g., users are prevented from doing something on the system that is not sharable or saved for future reuse)
Doesn’t always provide facilities for sharing data
Provides an easy way for users to share BI knowledge with each other
Usually uses proprietary architecture
Uses service-based architecture in loosely coupled services, allowing for easy creation of mashable applications
Doesn’t always provide an API; sometimes uses closed systems because of proprietary formats
Usually provides open APIs into some of the BI insight to be consumable by other systems
Summary This chapter introduced high-level BI concepts. While there is much more to BI than could possibly be covered in an introductory chapter, I wanted to focus on the core BI features to give you an idea of what BI software is and help make the distinction between BI 1.0 and BI 2.0.
Your main takeaway from this chapter should be the understanding of BI 2.0 and its features, as this is the focus in this book. You should be able to contrast BI 1.0 and 2.0 and describe how BI 2.0 positively extends BI functionality.
If you understand that BI 2.0 is focused on BI for the masses by making BI software simpler, more visual, and easier to understand, you are in good shape to proceed to Chapter 2 which introduces the Microsoft Silverlight technology.