1 an introduction to the r statistical programming language some material from ny times, various...
TRANSCRIPT
1
An Introduction to the RStatistical Programming Language
Some material from NY Times, various Harry Potter websites,Matthew Keller (www.mckeller.com), Revolution Analytics,and Ian Westbrooke (NZDOC)
2
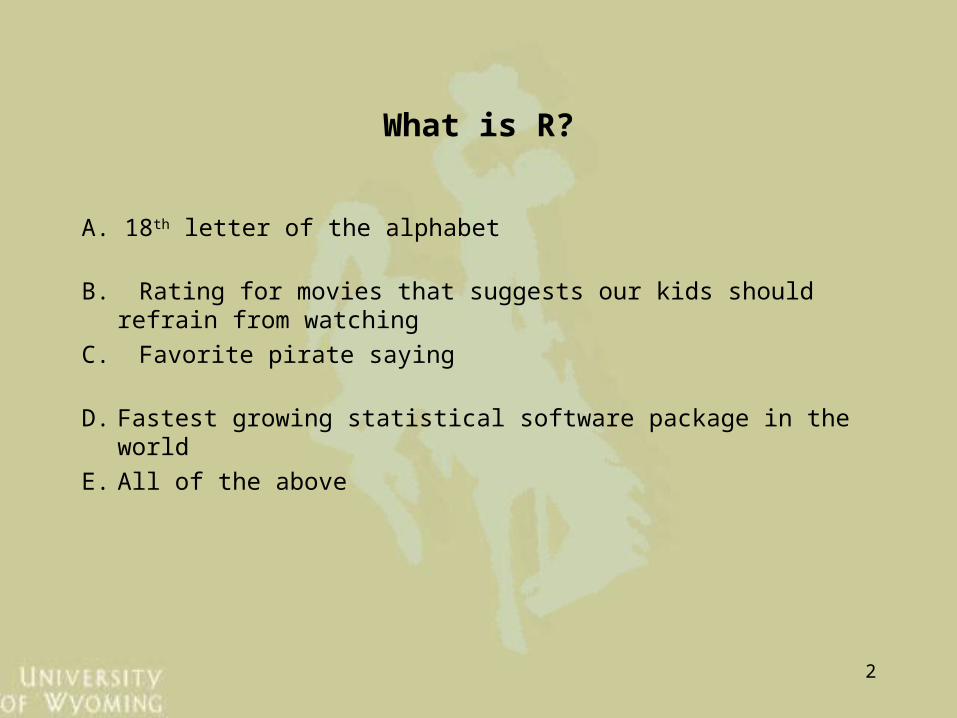
What is R?
A. 18th letter of the alphabet
B. Rating for movies that suggests our kids should refrain from watching
C. Favorite pirate saying
D. Fastest growing statistical software package in the world
E. All of the above
3
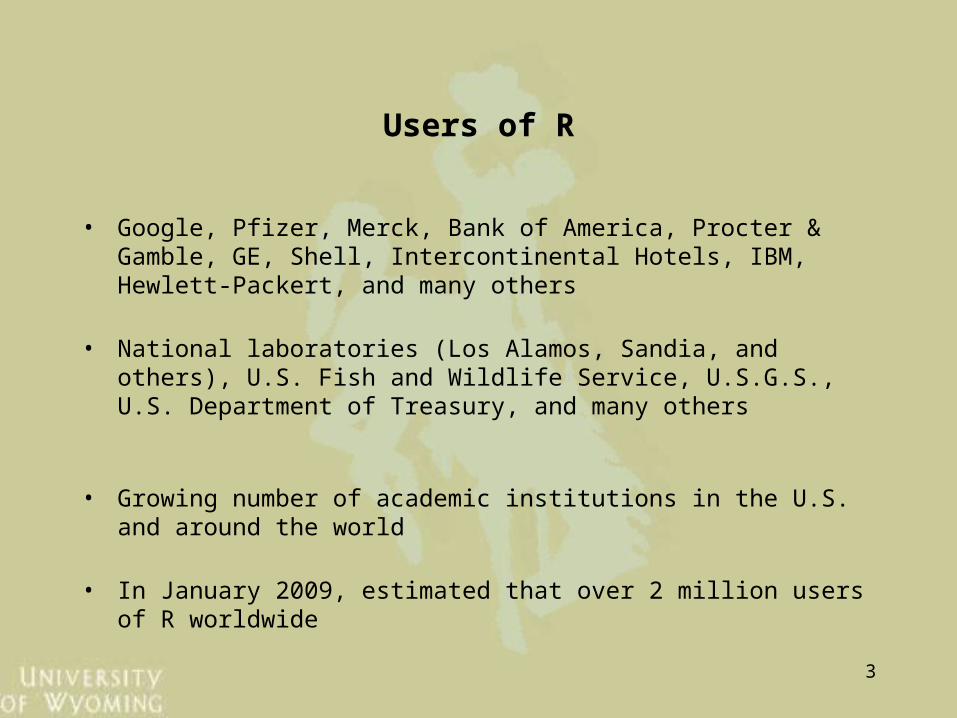
Users of R
• Google, Pfizer, Merck, Bank of America, Procter & Gamble, GE, Shell, Intercontinental Hotels, IBM, Hewlett-Packert, and many others
• National laboratories (Los Alamos, Sandia, and others), U.S. Fish and Wildlife Service, U.S.G.S., U.S. Department of Treasury, and many others
• Growing number of academic institutions in the U.S. and around the world
• In January 2009, estimated that over 2 million users of R worldwide
4
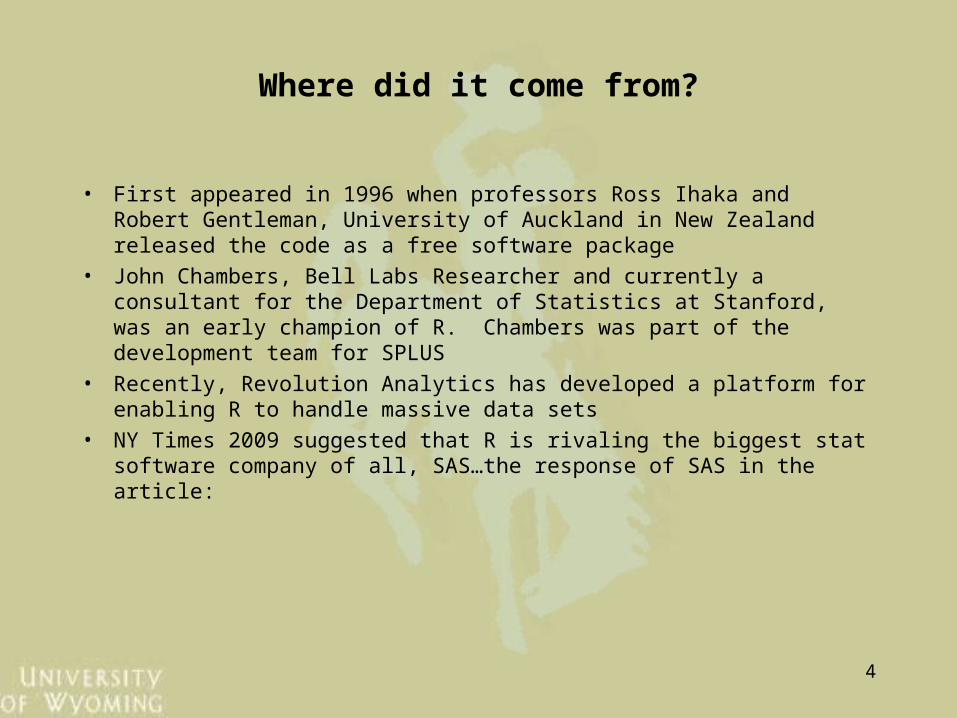
Where did it come from?
• First appeared in 1996 when professors Ross Ihaka and Robert Gentleman, University of Auckland in New Zealand released the code as a free software package
• John Chambers, Bell Labs Researcher and currently a consultant for the Department of Statistics at Stanford, was an early champion of R. Chambers was part of the development team for SPLUS
• Recently, Revolution Analytics has developed a platform for enabling R to handle massive data sets
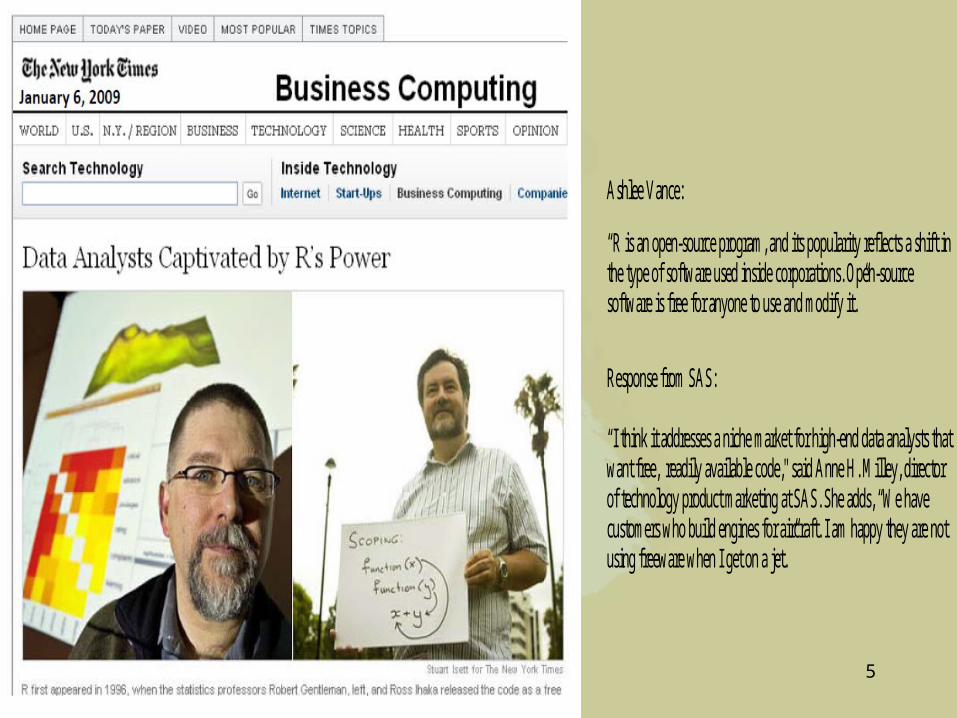
• NY Times 2009 suggested that R is rivaling the biggest stat software company of all, SAS…the response of SAS in the article:
5
Ashlee Vance:
“R is an open-source program, and its popularity reflects a shift in the type of software used inside corporations. Open-source software is free for anyone to use and modify it.”
Response from SAS: “I think it addresses a niche market for high-end data analysts that want free, readily available code," said Anne H. Milley, director of technology product marketing at SAS. She adds, “We have customers who build engines for aircraft. I am happy they are not using freeware when I get on a jet.”
6
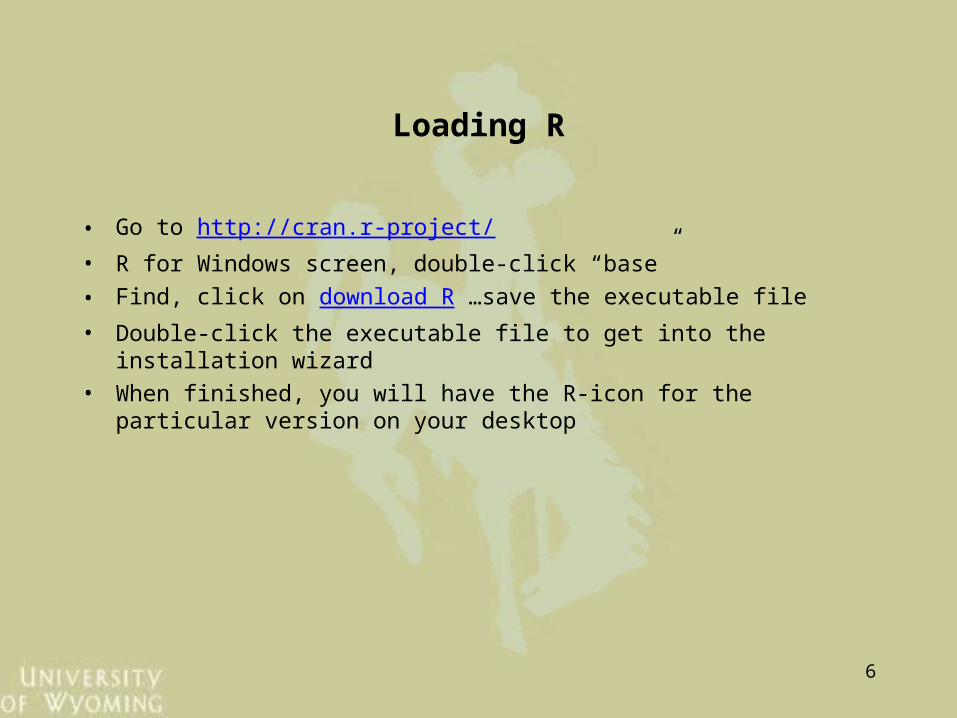
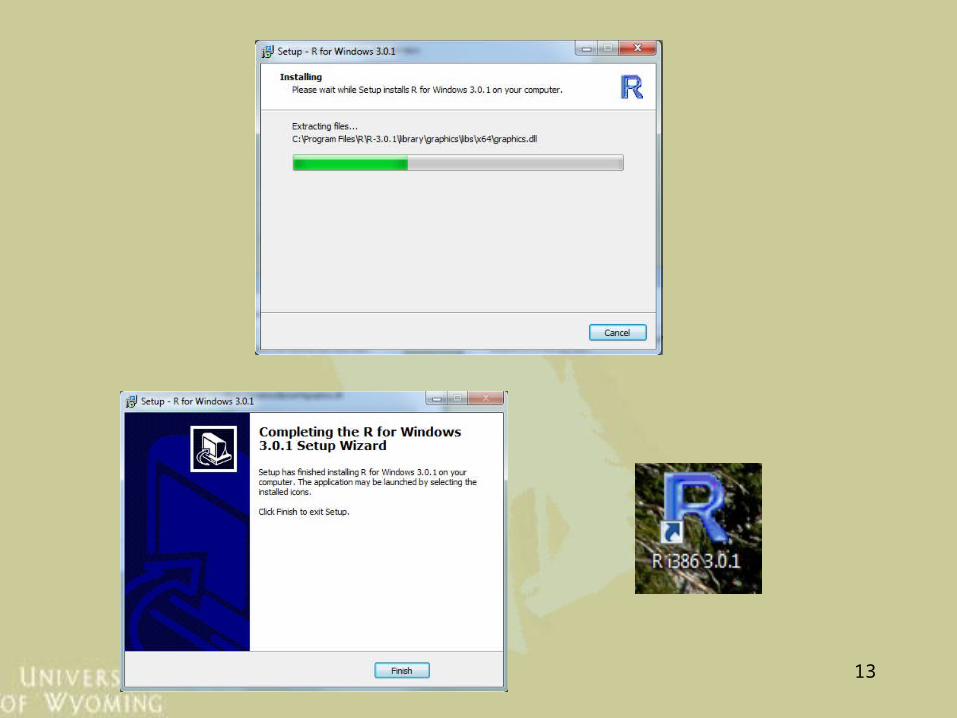
Loading R
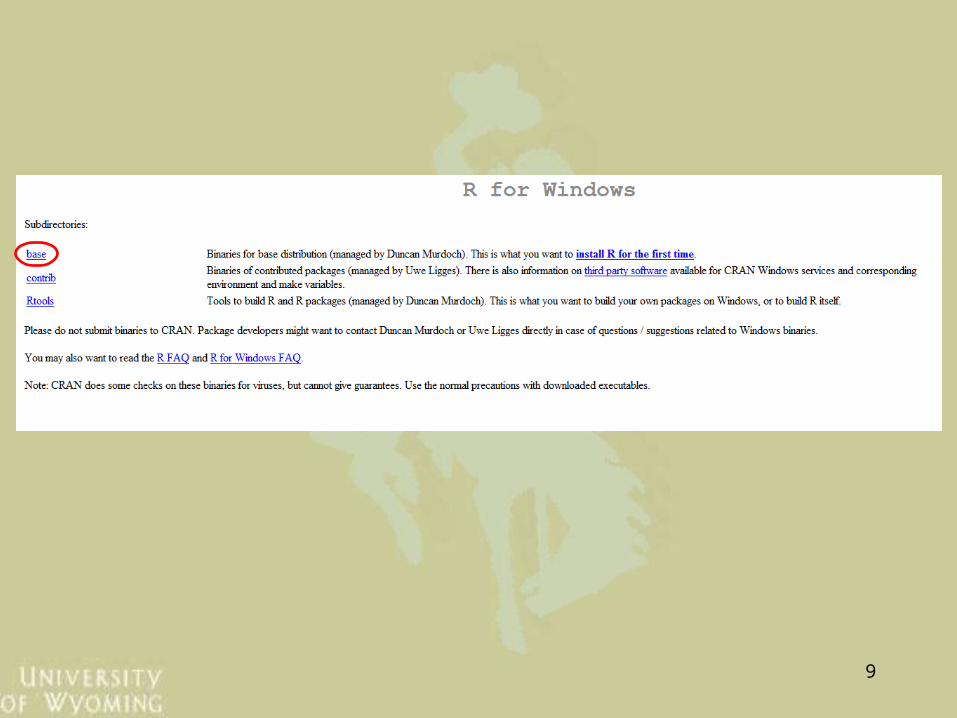
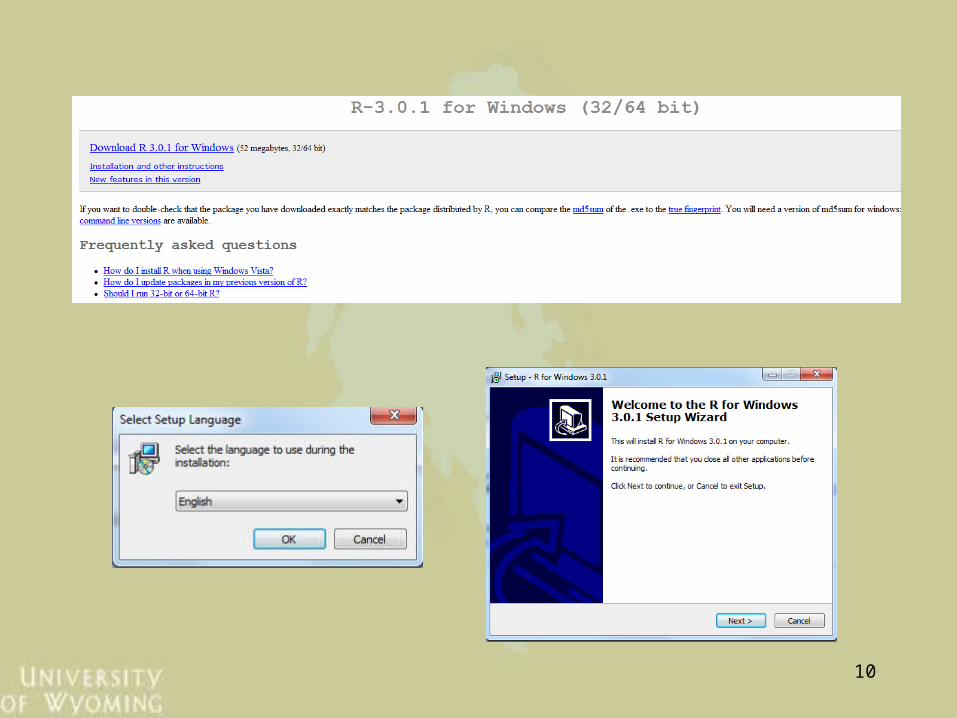
• Go to http://cran.r-project/
• R for Windows screen, double-click “base”
• Find, click on download R …save the executable file
• Double-click the executable file to get into the installation wizard
• When finished, you will have the R-icon for the particular version on your desktop
7
8
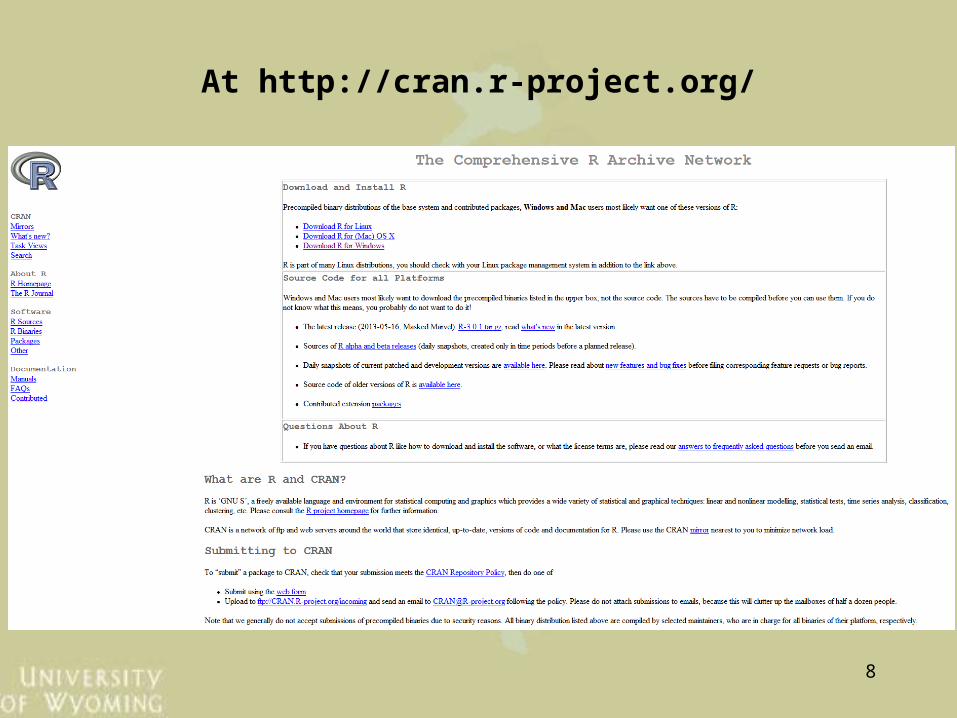
At http://cran.r-project.org/
9
10
11
12
13
14
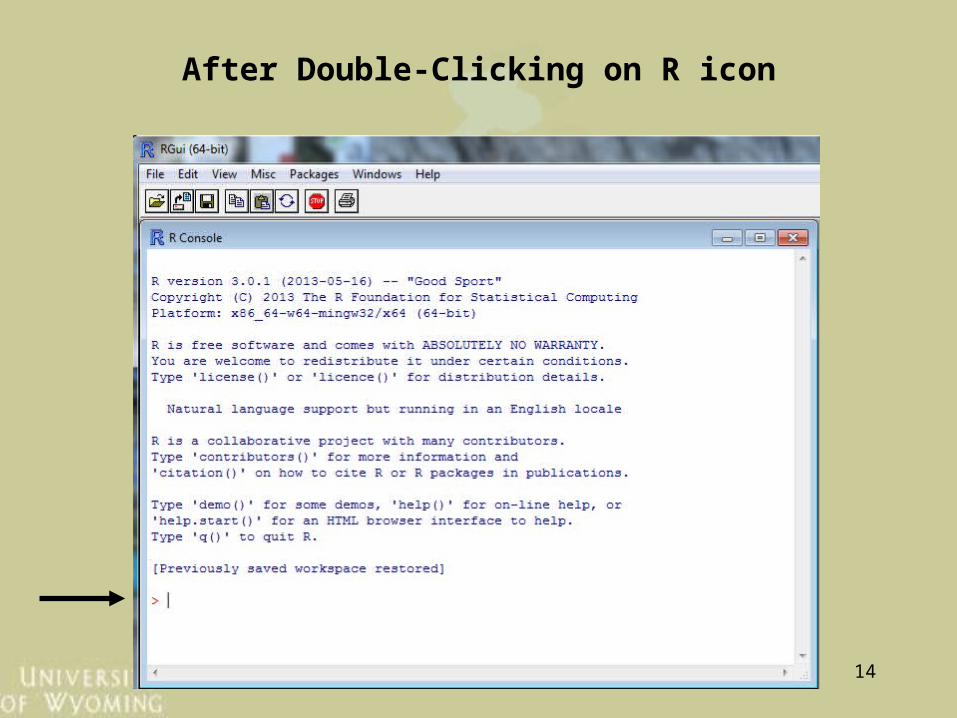
After Double-Clicking on R icon
15
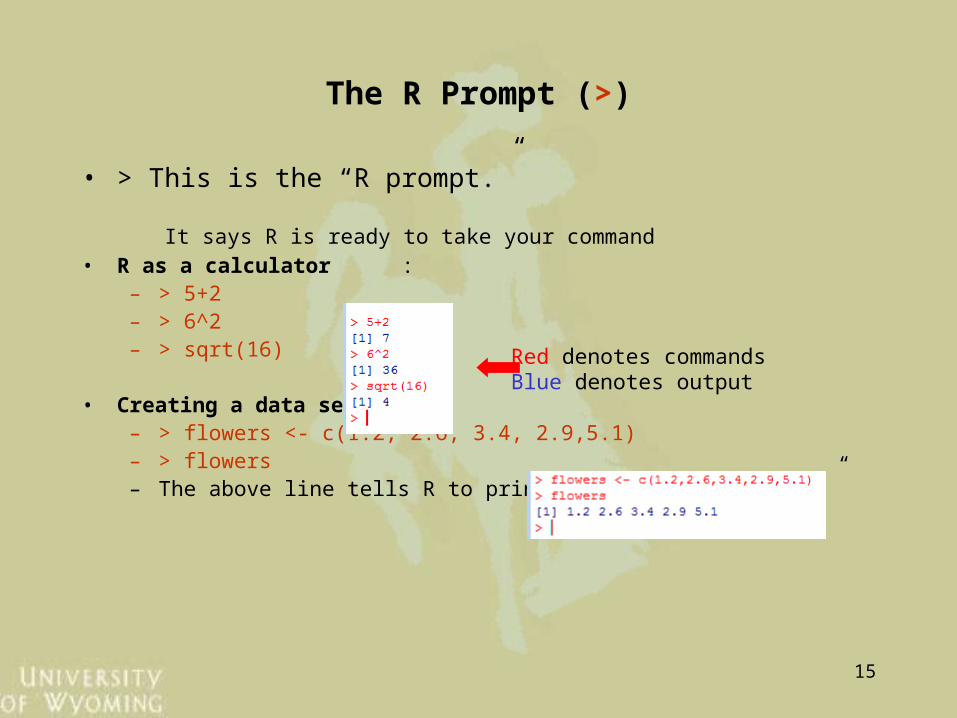
The R Prompt (>)
• > This is the “R prompt.”
It says R is ready to take your command
• R as a calculator :
– > 5+2– > 6^2– > sqrt(16)
• Creating a data set:
– > flowers <- c(1.2, 2.6, 3.4, 2.9,5.1)– > flowers– The above line tells R to print the data set “flowers”
Red denotes commandsBlue denotes output
16
Important Rules
1. We created a variable
2. Variable names are case sensitive
3. No blanks in name
(can use _ or . to join words, but better not to use a blank between names)
4. Start with a letter (cap or lc)
5. Use of <- instead of =
17
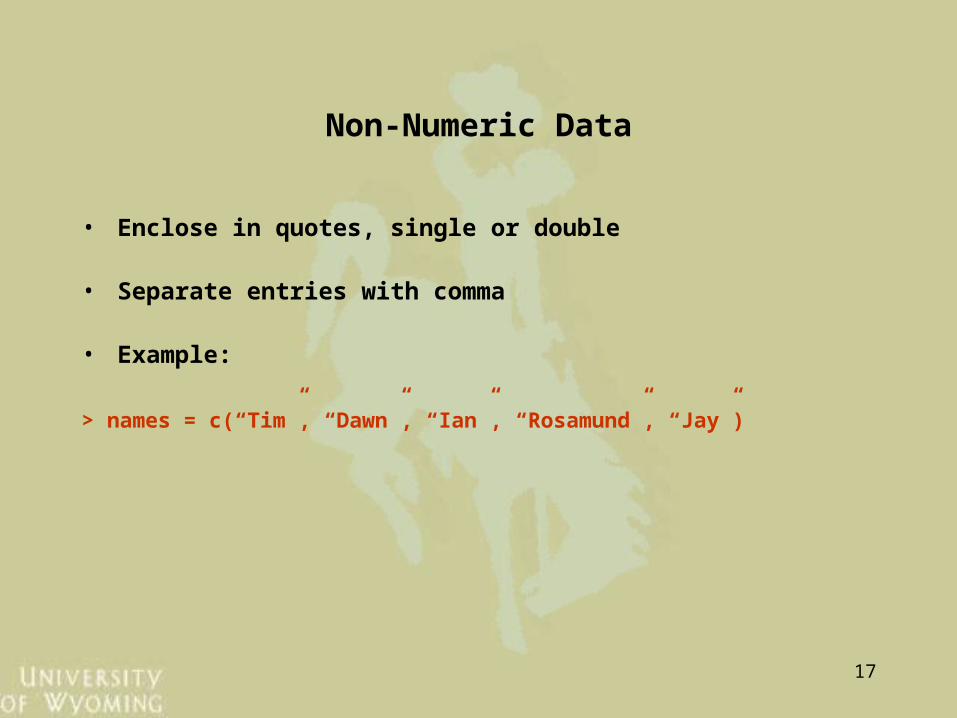
Non-Numeric Data
• Enclose in quotes, single or double
• Separate entries with comma
• Example:
> names = c(“Tim”, “Dawn”, “Ian”, “Rosamund”, “Jay”)
18
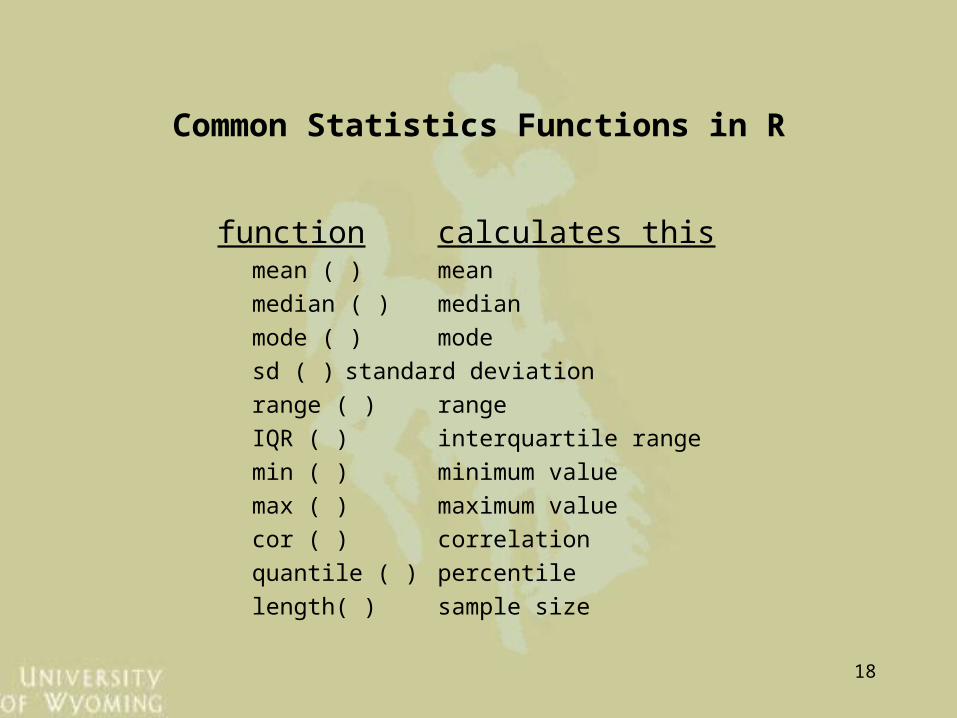
Common Statistics Functions in R
function calculates thismean ( ) mean
median ( ) median
mode ( ) mode
sd ( ) standard deviation
range ( ) range
IQR ( ) interquartile range
min ( ) minimum value
max ( ) maximum value
cor ( ) correlation
quantile ( ) percentile
length( ) sample size
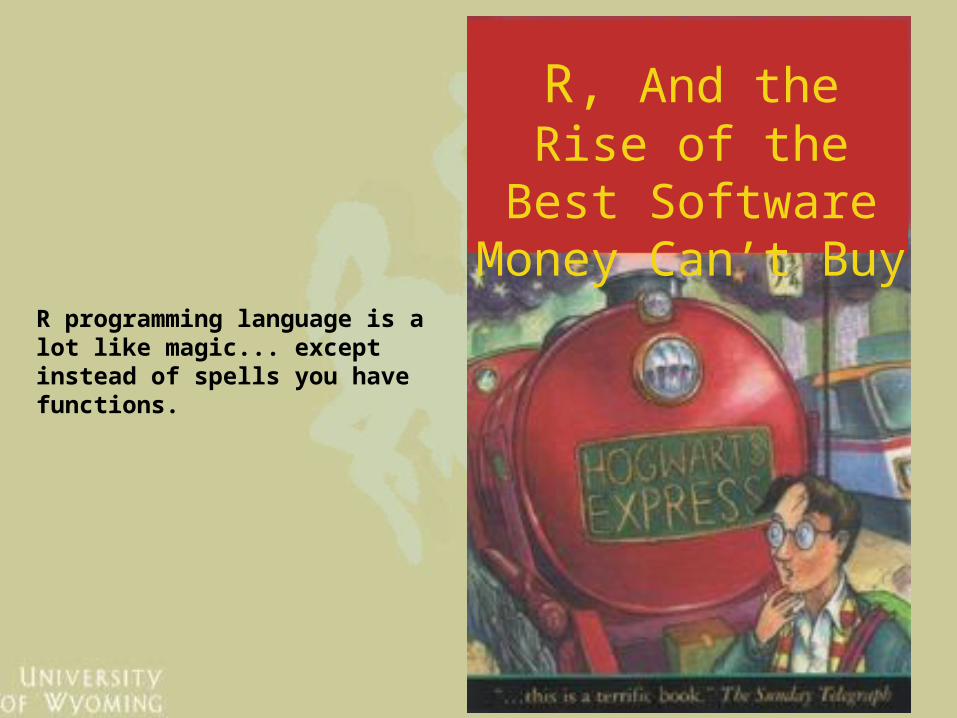
R, And the Rise of the Best Software Money Can’t Buy
R programming language is a lot like magic... except instead of spells you have functions.
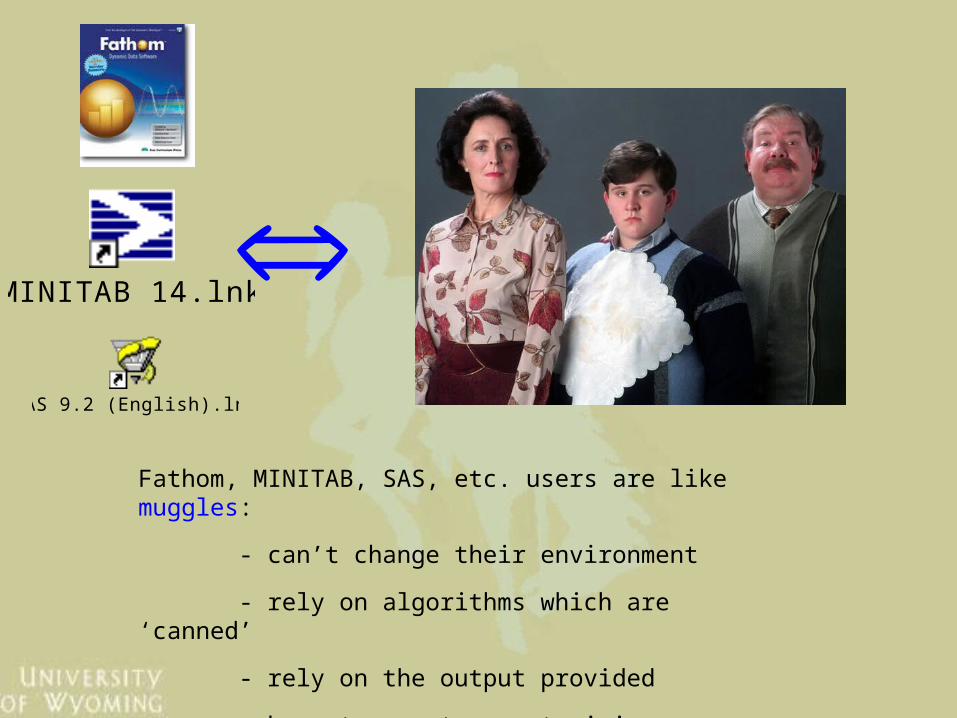
Fathom, MINITAB, SAS, etc. users are like muggles:
- can’t change their environment
- rely on algorithms which are ‘canned’
- rely on the output provided
- have to pay to constraining algorithms.
MINITAB 14.lnk
SAS 9.2 (English).lnk
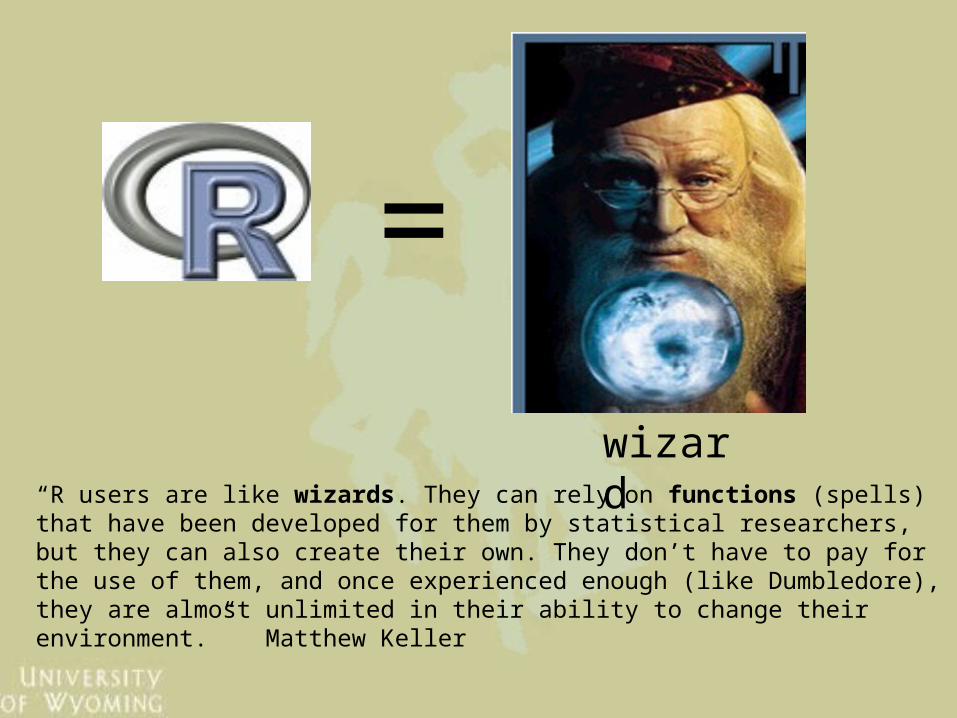
=
wizard“R users are like wizards. They can rely on functions (spells) that have been developed for them by statistical researchers, but they can also create their own. They don’t have to pay for the use of them, and once experienced enough (like Dumbledore), they are almost unlimited in their ability to change their environment.” Matthew Keller
22
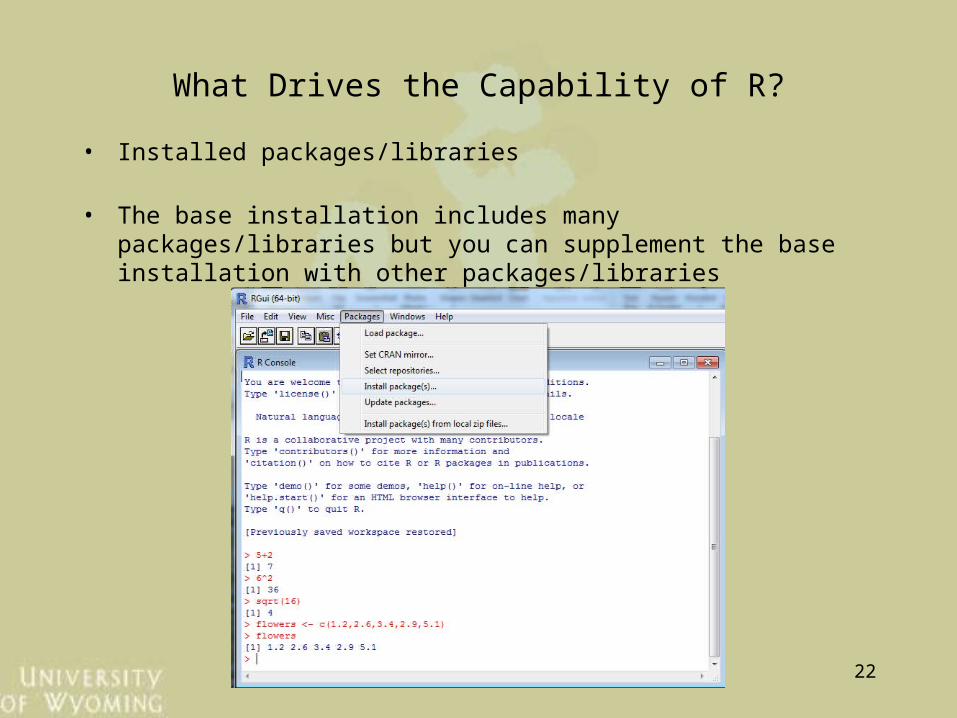
What Drives the Capability of R?
• Installed packages/libraries
• The base installation includes many packages/libraries but you can supplement the base installation with other packages/libraries
23
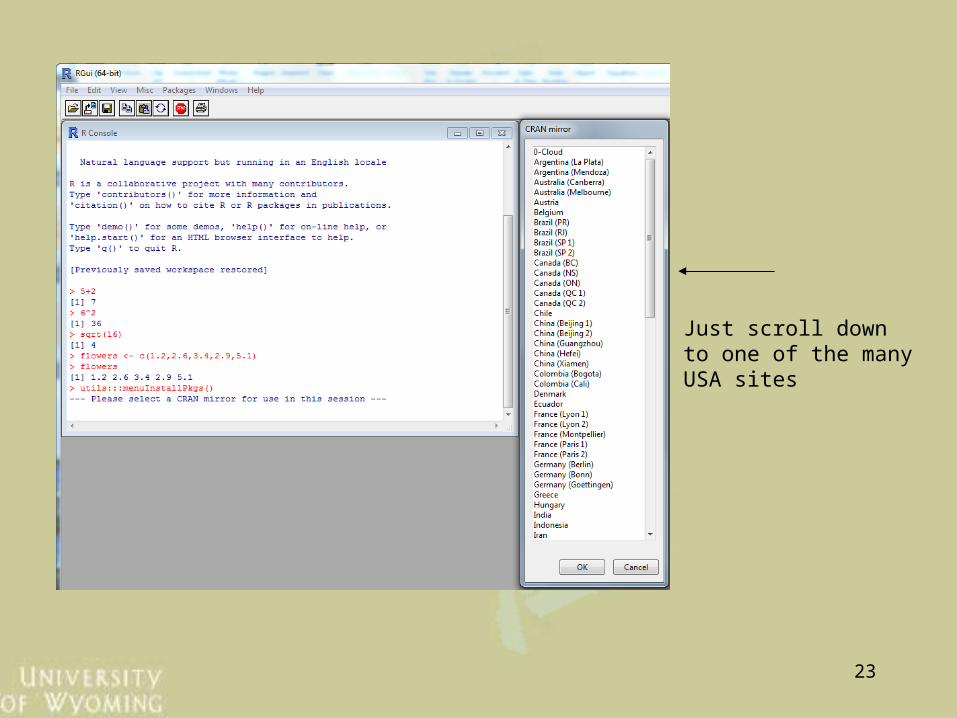
Just scroll downto one of the manyUSA sites
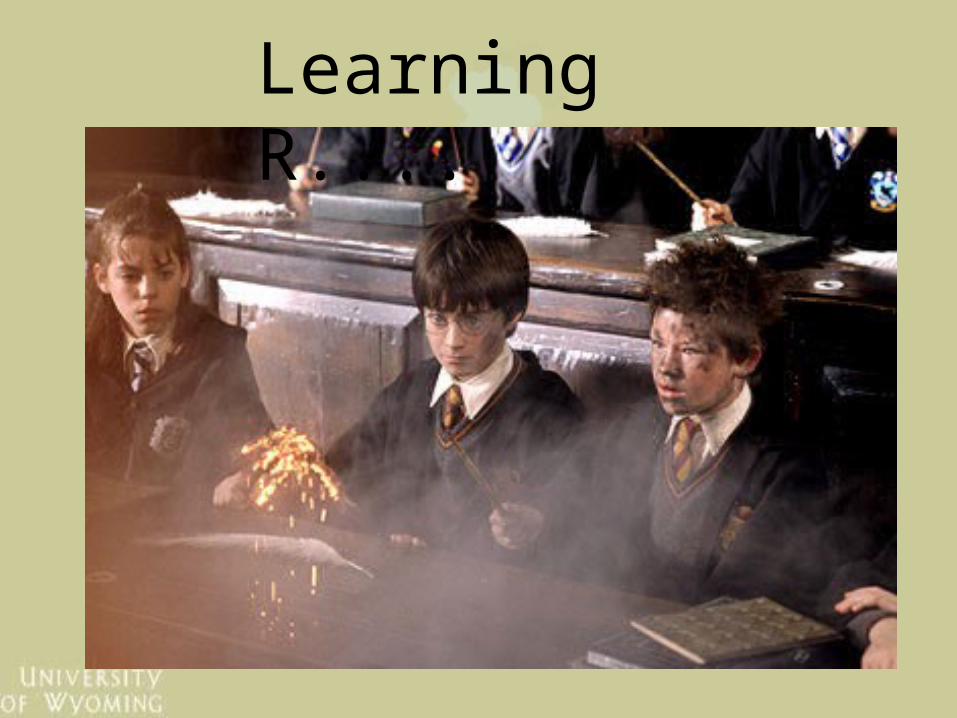
Learning R....
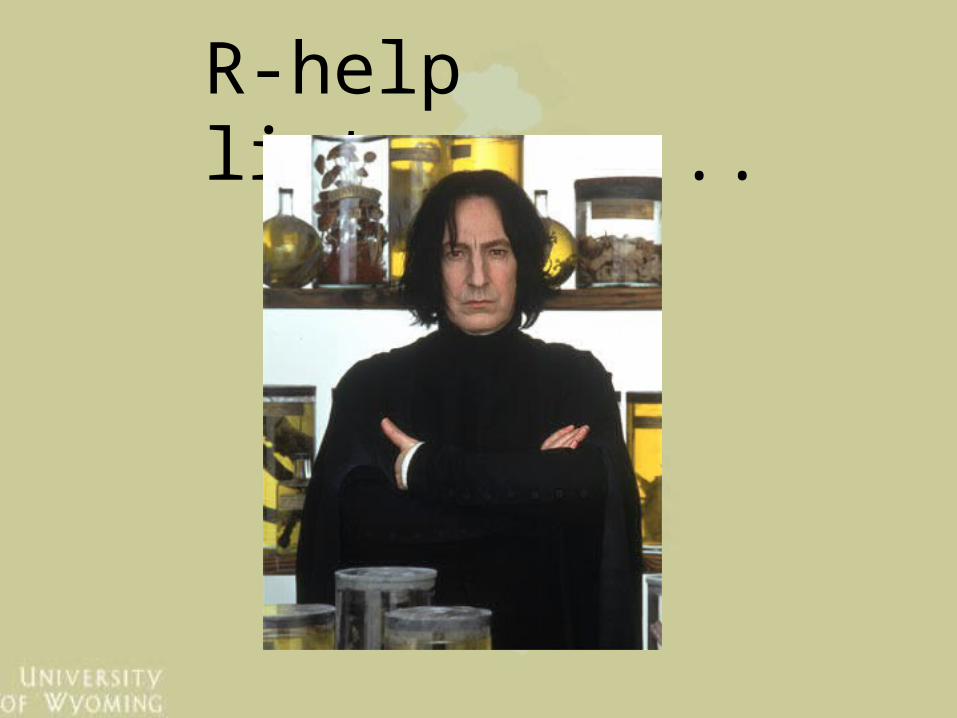
R-help listserve....
26
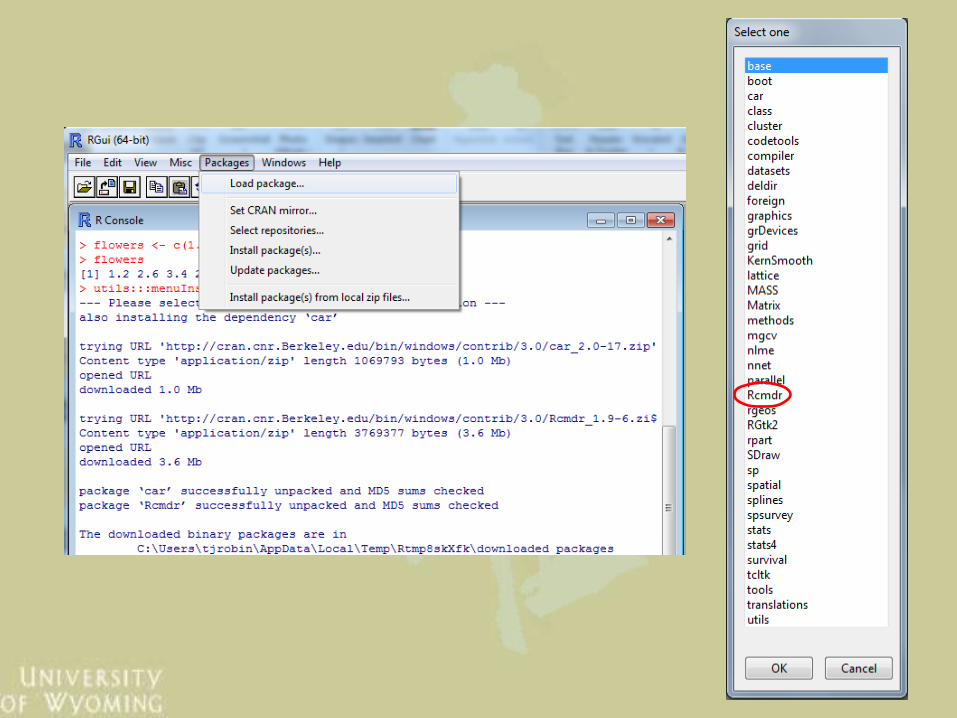
Rcmdr
• It is a package in R
– Advantages:• Click on the menu – similar to SPSS, Minitab, JMP• No need to memorize the R-functions• Save the script in your personnel directory and use it for future. • Good for non-statistical people or folks just starting use of R
– Disadvantages:
• No access for some functions• Limited access to the packages• Does not always help those with limited statistical skills enough
27
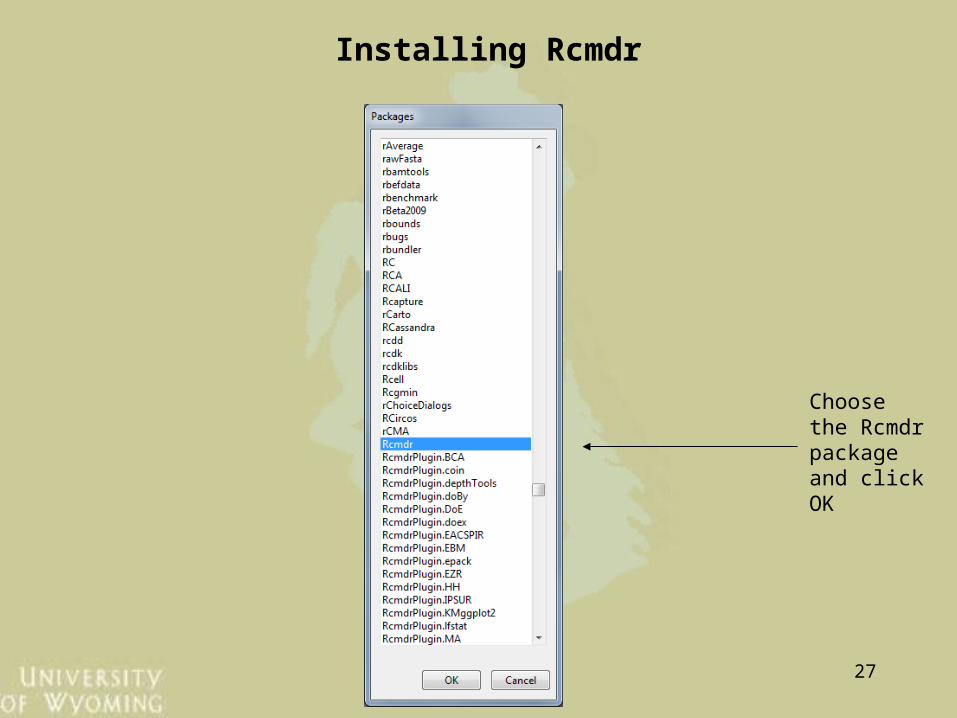
Choosethe Rcmdrpackageand clickOK
Installing Rcmdr
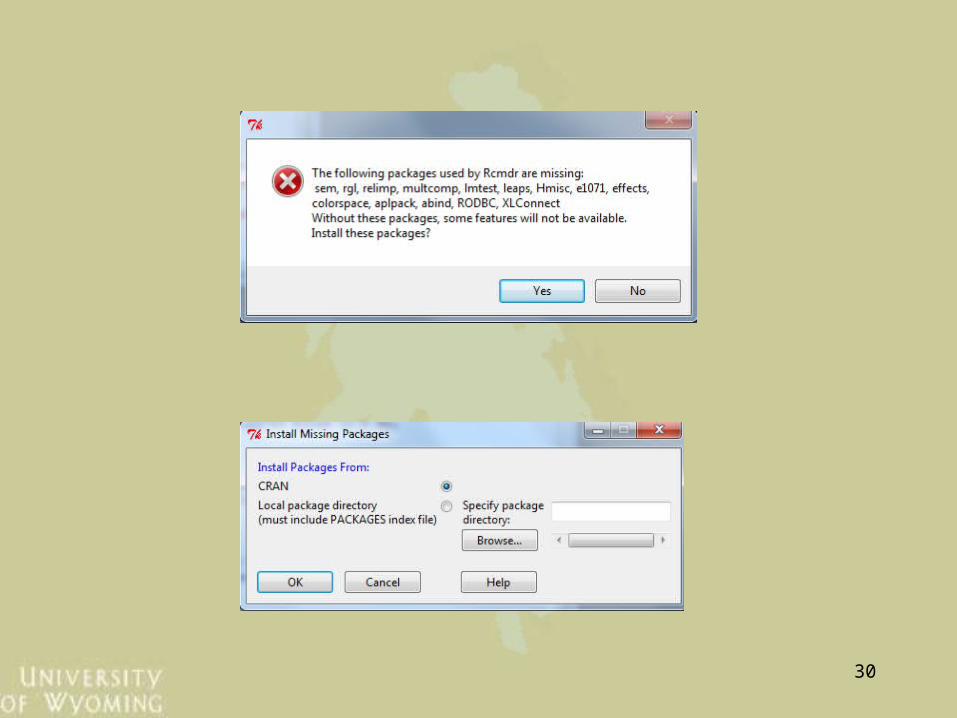
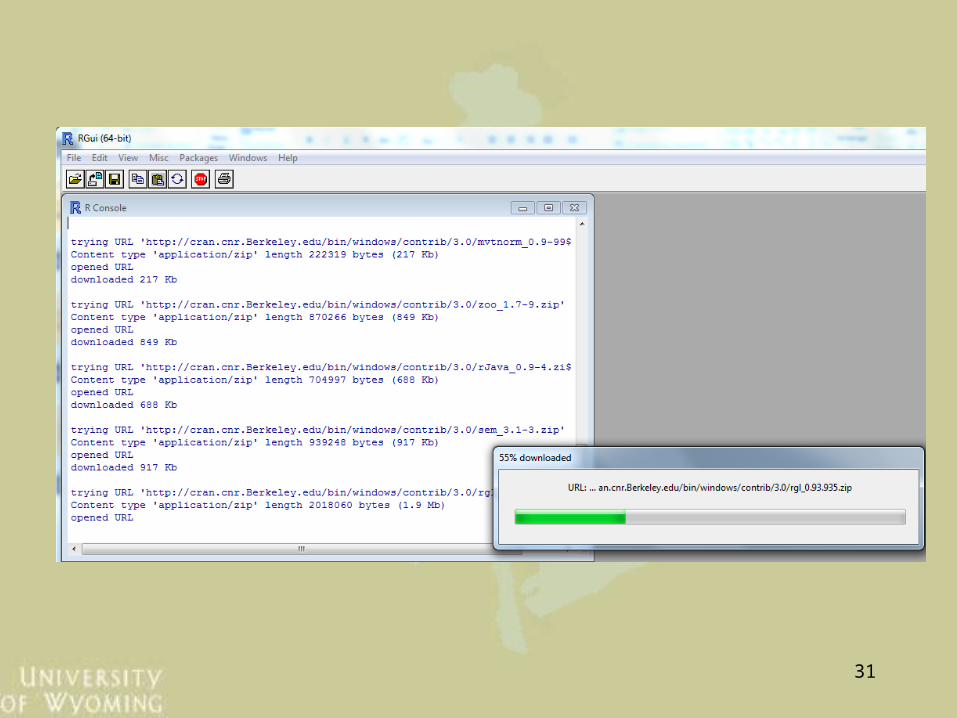
Installing vs. Loading a Package/Library
• ‘Installing’ a package involves getting your machine to talk to a CRAN server and downloading the package/library from the CRAN site to your personal machine
• Once the package is installed, we must load the package in order to activate it for our current session…this can be accomplished in one of two ways:
- Use the library( ) function- Use the drop-down menu from the
console window
28
29
30
31
32
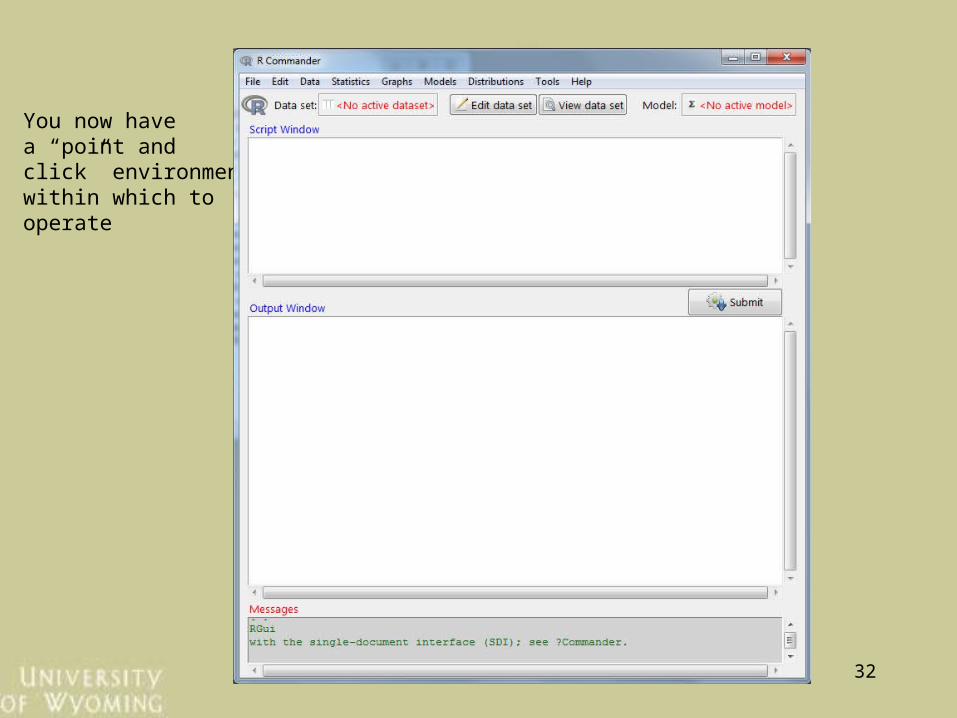
You now havea “point andclick” environmentwithin which tooperate