1 a rank-by-feature framework for interactive exploration of multidimensional data jinwook seo, ben...
Post on 22-Dec-2015
221 views
TRANSCRIPT

1
A Rank-by-Feature Framework for Interactive Exploration of Multidimensional Data
Jinwook Seo, Ben Shneiderman
University of Maryland
Hyun Young Song ([email protected])Maryam Farboodi ([email protected])
Feb, 09 2006

2
HCE 3.0
HCE (Hierarchical Clustering Explorer) Main Idea: GRID principles
Graphics, Ranking and Interaction for Discovery Feature Application
http://www.cs.umd.edu/hcil/hce/ User Manual
http://www.cs.umd.edu/hcil/hce/hce3-manual/hce3_manual.html
Dataset http://www.cs.umd.edu/hcil/hce/examples/
application_examples.html

3
Axis-Parallel vs. Non Axis-Parallel Approach Definition
3 dimensions X, Y & Z Axis-parallel: Projection on either X & Y; X & Z
or Y & Z Non axis-parallel: Can project on a.X+b.Y & Z
Simplicity vs. power Users

4
Related Works
Axis-parallel: Machine learning, Info. Vis. Pattern recognition
Subset of dimensions to find specific patterns Machine learning and Data mining
Supervised/ Unsupervised classification Subspace-based clustering analysis
Projections naturally partitioning the data set Information Visualization
Permutation Matrix Parallel coordinates: dimension ordering Conditional Entropy

5
Related Work (cntd.)
Non axis-parallel: statisticians Two-dimensional projection SOM (Self Organizing Maps) XGobi:
Grand tour, Projection pursuit No ranking
HD-Eye interactive hierarchical clustering OptiGrid (partitioning clustering algorithm)

6
Major Contributions
GRID (Graphics, Ranking and Interaction for Discovery) Study 1D, study 2D, then find features Ranking guides insight, statistics confirm
Visualization Techniques Overview Coordination (multiple windows) Dynamic query (item slider)

7
General Overview
Menu Toolbar Overviews, Color setting
Dendrogram (binary tree), scatterplot 7 tabs
Color mosaic, Table view, Histogram Ordering, Scatterplot ordering, Profile search, Gene ontology, K-means

8
General Overview
back

9
Load/Transformation Data
Natural Log Standardization Normalization
To the first column Median
Linear scaling
back

10
Clustering Algorithm
1. Initially, each data a cluster by itself
2. Merge the pair with highest similarity value
3. Update similarity values
4. Repeat 2 & 3 for n - 1 times to reach one cluster of size n
No predefined number of clusters

11
Choosing Algorithm Parameters

12
Linkage Method
Average Linkage
Average Group Linkage
Complete Linkage
Single Linkage
Scheinderman’s 1by1 Linkage Tries to grow the newly merged cluster of last iteration
first
),(),(),( kj
ji
j
ki
ji
ikn CCDist
CC
CCCDist
CC
CCCDist
))(),((),( knkn CMeanCMeanDISTCCDIST
)),(),,((),( kjkikn CCDISTCCDISTMaxCCDIST
)),(),,((),( kjkikn CCDISTCCDISTMinCCDIST

13
Dendrogram View
back

14
7 Tabs

15
1D Histogram Interface
Interface description Control panel, Score overview, Ordered list,
Histogram browser

16
1D Histogram Ordering
Ranking criteria Normality of the distribution (0~∞)
s: skewness, k: kurtosis: Uniformity of the distribution (0~∞)
Number of potential outliers (0~n) IQR = Q3 – Q1, d: item value Suspected outlier: Extreme outlier:
Number of unique values (0~n) Size of the biggest gap (0~max. dim. range)
mf: max frequency, t: tolerance:
|3||| ks
)(log)( 21
i
k
ii ppHentrpy
mft
IQRd 3
IQRQd 5.13 IQRQd 5.11

17
2D Scatterplot Interface
Interface description Control panel, Score overview, Ordered list,
Scatterplot browser
18
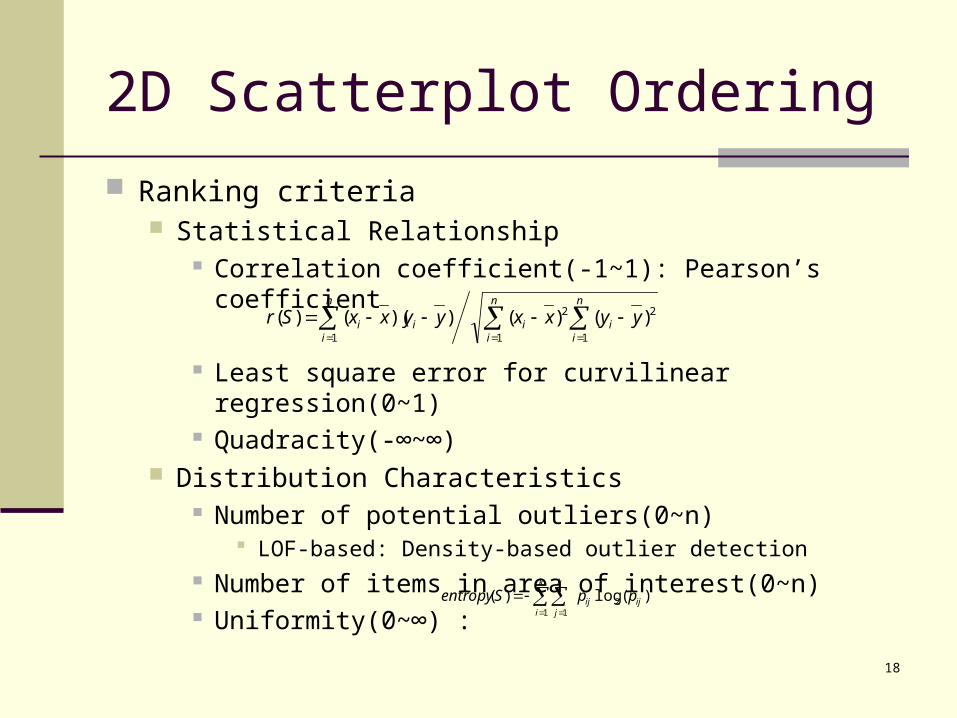
2D Scatterplot Ordering
Ranking criteria Statistical Relationship
Correlation coefficient(-1~1): Pearson’s coefficient
Least square error for curvilinear regression(0~1) Quadracity(-∞~∞)
Distribution Characteristics Number of potential outliers(0~n)
LOF-based: Density-based outlier detection Number of items in area of interest(0~n) Uniformity(0~∞) : )(log)( 2
1 1ij
k
iij
k
j
ppSentropy
n
i
n
iii
n
iii yyxxyyxxSr
1 1
22
1
)()())(()(

19
Demo

20
System Constraints
Computational Complexity n data in m dimensional space : O(nm²) O(n) : scoring complexity O(m²) :combination of dimension
Display Constraints Appropriate number of
dimensions for score overview component: 0~130
Lack of sliders to adjust displacement
21
Evaluation of HCE 3.0
Linear color mapping (3 color or 1 color) Consistent layout of the components Focus-context
F: dendrogram – C: rank-by-feature F: ordered list - C: histogram, scatter plot
Item slider Dynamic query
Multi-window view Dynamic update of data selection in different
window

22
Futureworks
User study Various statistical tools and data mining algorithms
HCE 3.0 (HCE 3.5) HCE 4.0 ??
1D, 2D axis parallel projection 3D projection
Numerical data format Numerical + categorical, binary, Nominal
Limited number of applicable datasets
( us cities, cereal, netscan …)1D - 5 ranking criteria
2D – 6 ranking criteria
More meaningful datasets to demonstrate the power of each ranking criteria Incorporate more criterion into rank-by-feature framework

23
Thank you!Questions?