1 a new infrastructure for high throughput network and application performance measurement. les...
Post on 20-Dec-2015
217 views
TRANSCRIPT

1
A new infrastructure for high throughput network and
application performance measurement.
Les Cottrell – SLACPrepared for the IPAM meeting, UCLA Mar 19 ‘02
http://www.slac.stanford.edu/grp/scs/net/talk/ipam-mar02.html
Partially funded by DOE/MICS Field Work Proposal on Internet End-to-end Performance Monitoring (IEPM), also supported by IUPAP
2
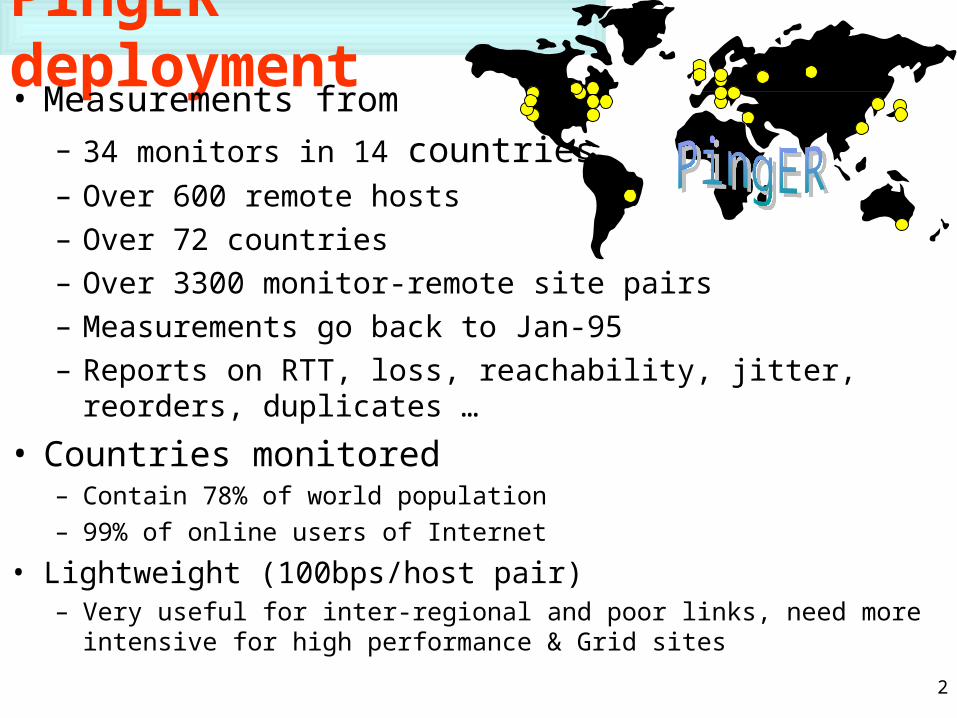
PingER deployment• Measurements from
– 34 monitors in 14 countries– Over 600 remote hosts
– Over 72 countries
– Over 3300 monitor-remote site pairs
– Measurements go back to Jan-95
– Reports on RTT, loss, reachability, jitter, reorders, duplicates …
• Countries monitored– Contain 78% of world population
– 99% of online users of Internet
• Lightweight (100bps/host pair)– Very useful for inter-regional and poor links, need more intensive for high
performance & Grid sites
3
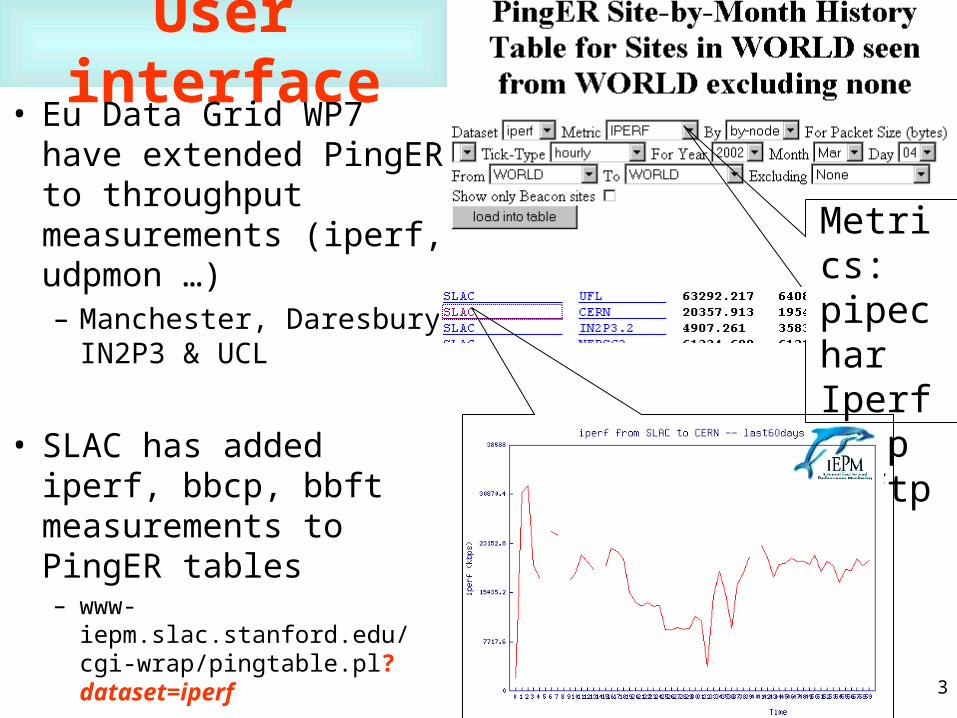
User interface• Eu Data Grid WP7 have
extended PingER to throughput measurements (iperf, udpmon …) – Manchester, Daresbury,
IN2P3 & UCL
• SLAC has added iperf, bbcp, bbft measurements to PingER tables– www-iepm.slac.stanford.edu/cgi-
wrap/pingtable.pl?dataset=iperf
Metrics:pipecharIperfBbcpbbftp

4
Effect of Sep 11 ’02 on unreachability• For most sites (median) the effect was not noticeable
• There was a big peak in unreachability for 10 sites (5%) on Sep 11 &12
• All 5 Italian sites lost connectivity for about 24 hours, Padova took 8 days to stabilise
• BNL took 6 days to stabilize• 5 sites (2.5%) took 10 days to
recover• 2 sites (MX & Montreal) had not
recovered by end of month, may have had nothing to do with WTC– MX found blocked ping access in Nov
SNVORN

5
Romania performance from US

6
Losses: World by region, Jan ‘02• <1%=good, <2.5%=acceptable, < 5%=poor, >5%=bad
• Russia, S America bad
• Balkans, M East, Africa, S Asia, Caucasus poor
Monitored Region \ Monitor Country
BR (1)
CA (2)
DK (1)
DE (1)
HU (1)
IT (3)
JP (2)
RU (2)
CH (1)
UK (3)
US (16) Avg Region
Avg -(H
Avg NA + WEU + JP Pairs
COM 0.2 0.3 0.3 0.2 COM 0.27 23
Canada 1.8 1.6 0.3 0.5 9.0 0.3 1.4 21.7 0.7 0.7 0.5 3.5 Canada 0.74 126
US 0.4 2.6 0.2 0.3 8.0 0.1 1.4 13.8 0.3 1.3 0.9 2.7 US 0.88 2149
C America 0.9 0.9 C America 0.89 19
Australasia 0.8 1.8 1.3 Australasia 1.30 18
E Asia 1.2 3.5 1.0 1.1 9.0 0.9 2.0 5.2 1.5 1.4 1.5 2.6 E Asia 1.61 215
Europe 0.4 5.6 0.3 0.5 5.4 0.4 1.3 15.5 1.1 1.0 1.0 2.9 Europe 1.38 852
NET 1.7 6.2 1.0 1.3 8.0 1.6 3.6 21.9 0.7 0.8 0.9 4.3 NET 2.00 85
FSU- 4.5 0.5 9.8 0.5 1.6 11.2 4.3 1.2 2.0 4.0 FSU- 2.09 48
Balkans 3.8 3.8 Balkans 3.83 109
Mid East 4.6 1.4 3.0 8.5 2.8 3.2 11.8 2.0 2.5 2.1 4.2 Mid East 2.70 57
Africa 5.8 1.5 12.0 1.2 4.2 11.9 2.0 1.9 2.5 4.8 Africa 2.72 45
Baltics 5.3 0.8 2.3 7.7 2.2 3.5 10.8 4.8 2.1 3.9 4.3 Baltics 3.12 67
S Asia 1.6 7.3 0.1 3.1 9.2 3.0 3.9 17.9 1.5 3.1 3.0 4.9 S Asia 3.12 97
Caucasus 3.2 3.2 Caucasus 3.22 19
S America 24.1 11.3 0.6 0.9 6.7 12.9 7.7 23.0 9.3 1.1 6.6 9.5 S America 6.30 203
Russia 35.9 24.1 22.2 13.4 23.8 21.7 13.6 0.7 8.7 24.1 12.7 18.3 Russia 17.57 91
Avg 7.5 6.9 2.8 2.4 9.8 3.7 3.9 13.8 3.1 3.2 2.8 4.4 Avg 3.16
Pairs 64 144 54 67 70 203 190 114 209 192 1990 Pairs
7
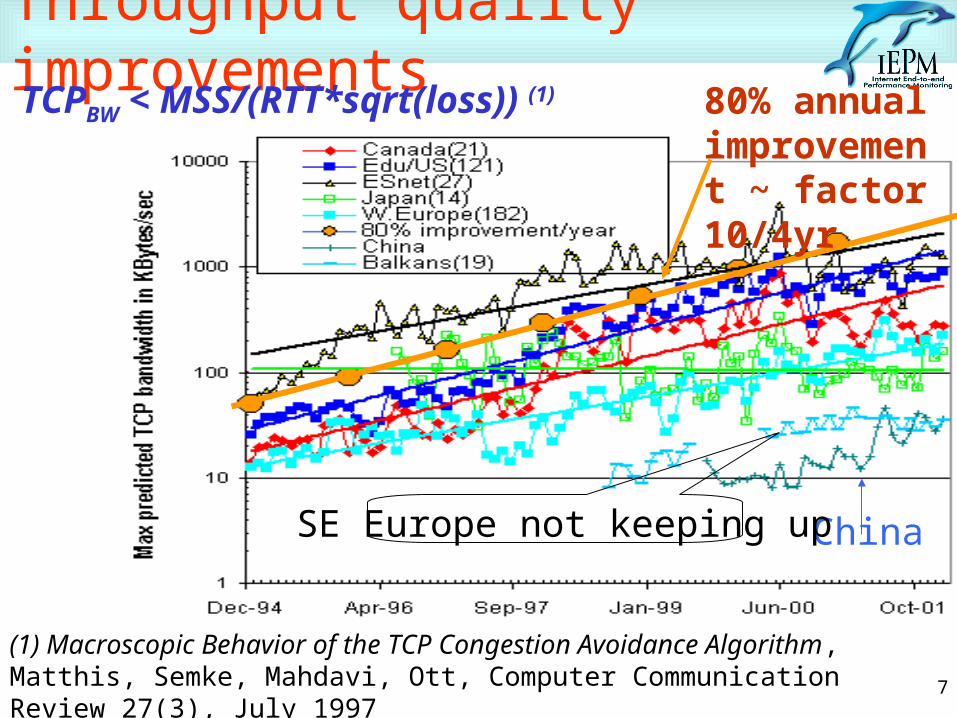
Throughput quality improvementsTCPBW < MSS/(RTT*sqrt(loss)) (1)
(1) Macroscopic Behavior of the TCP Congestion Avoidance Algorithm, Matthis, Semke, Mahdavi, Ott, Computer Communication Review 27(3), July 1997
China
80% annual improvement ~ factor 10/4yr
SE Europe not keeping up
8
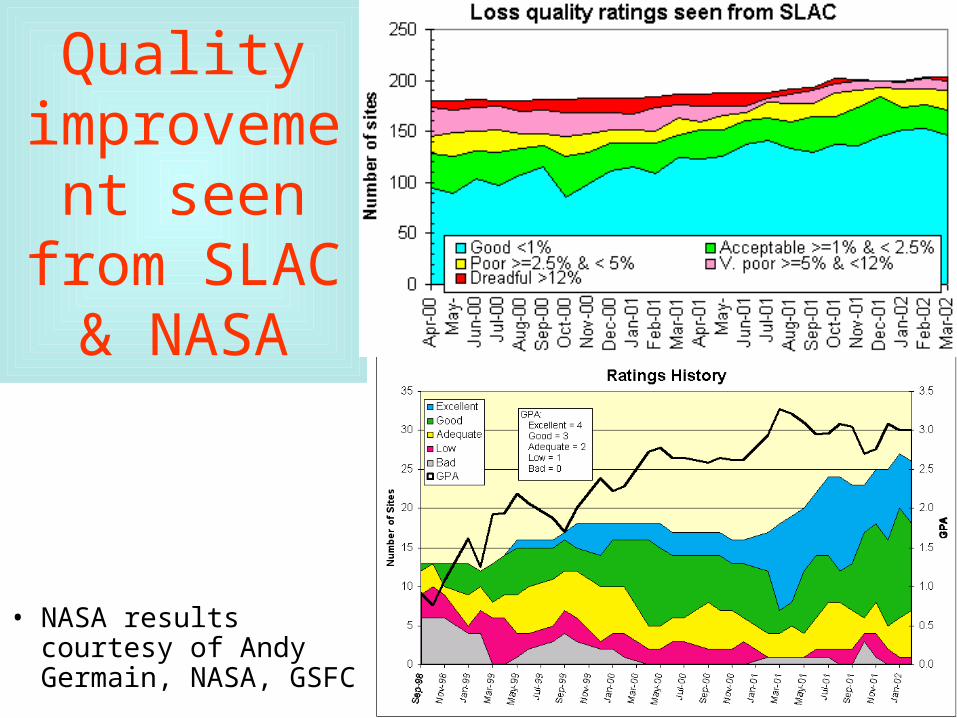
Quality improvement
seen from SLAC & NASA
• NASA results courtesy of Andy Germain, NASA, GSFC
9
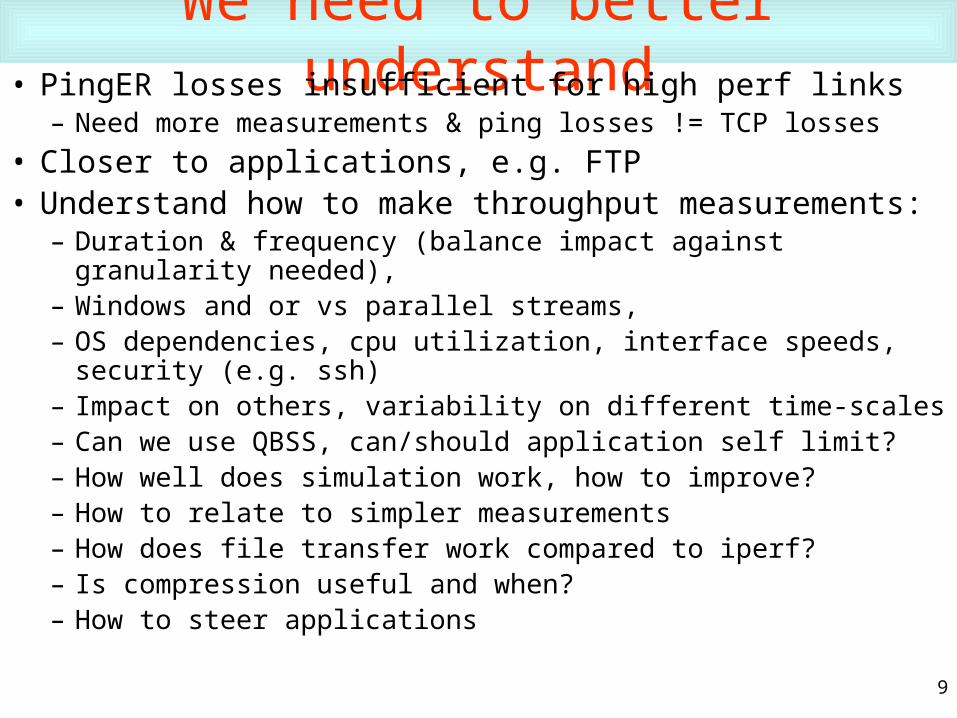
We need to better understand• PingER losses insufficient for high perf links
– Need more measurements & ping losses != TCP losses
• Closer to applications, e.g. FTP• Understand how to make throughput measurements:
– Duration & frequency (balance impact against granularity needed), – Windows and or vs parallel streams, – OS dependencies, cpu utilization, interface speeds, security (e.g. ssh)– Impact on others, variability on different time-scales– Can we use QBSS, can/should application self limit?– How well does simulation work, how to improve?– How to relate to simpler measurements– How does file transfer work compared to iperf?– Is compression useful and when?– How to steer applications

10
Even with big windows (1MB)
still need multiple streams
• Above knee performance still improves slowly, maybe due to TCP fair share as add more streams
• ANL, Caltech & RAL reach a knee (between 2 and 24 streams) above this gain in throughput slow

11
IEPM-BW: Main issues being addressed• Provide a simple, robust infrastructure for:
– Continuous/persistent and one-off measurement of high network AND application performance
– management infrastructure – flexible remote host configuration • Optimize impact of measurements
– Duration, frequency of active measurements, and use passive• Integrate standard set of measurements including: ping, traceroute, pipechar,
iperf, bbcp …• Allow/encourage adding measure/app tools
• Develop tools to gather, reduce, analyze, and publicly report on the measurements:– Web accessible data, tables, time series, scatterplots, histograms, forecasts …
• Compare, evaluate, validate various measurement tools and strategies (minimize impact on others, effects of app self rate limiting, QoS, compression…), find better/simpler tools, choose best set
• Provide simple forecasting tools to aid applications and to adapt the active measurement frequency
• Provide tool suite for high throughput monitoring and prediction

12
IEPM-BW Deliverables• Understand and identify resources needed to achieve high
throughput performance for Grid and other data intensive applications
• Provide access to archival and near real-time data and results for eyeballs and applications:– planning and expectation setting, see effects of upgrades– assist in trouble-shooting problems by identifying what is
impacted, time and magnitude of changes and anomalies– as input for application steering (e.g. data grid bulk data transfer),
changing configuration parameters– for prediction and further analysis
• Identify critical changes in performance, record and notify administrators and/or users
• Provide a platform for evaluating new network tools (e.g. pathrate, pathload, GridFTP, INCITE, UDPmon …)
• Provide measurement/analysis/reporting suite for Grid & hi-perf sites
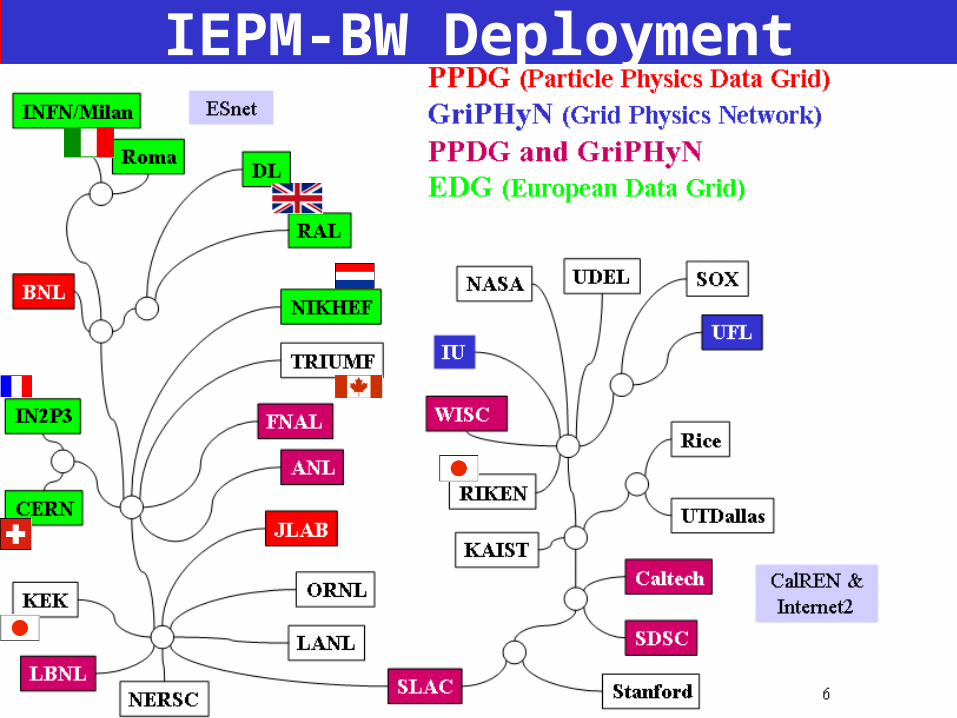
IEPM-BW Deployment

14
Results so far 1/2• Reasonable estimates of
throughput achievable with 10 sec iperf meas.
• Multiple streams and big windows are critical– Improve over default
by 5 to 60.– There is an optimum
windows*streams• Continuous data at 90
min intervals from SLAC to 33 hosts in 8 countries since Dec ‘01

15
Results so far 2/2
0 400
Dis
k M
bps
80
Iperf Mbps
• 1MHz ~ 1Mbps
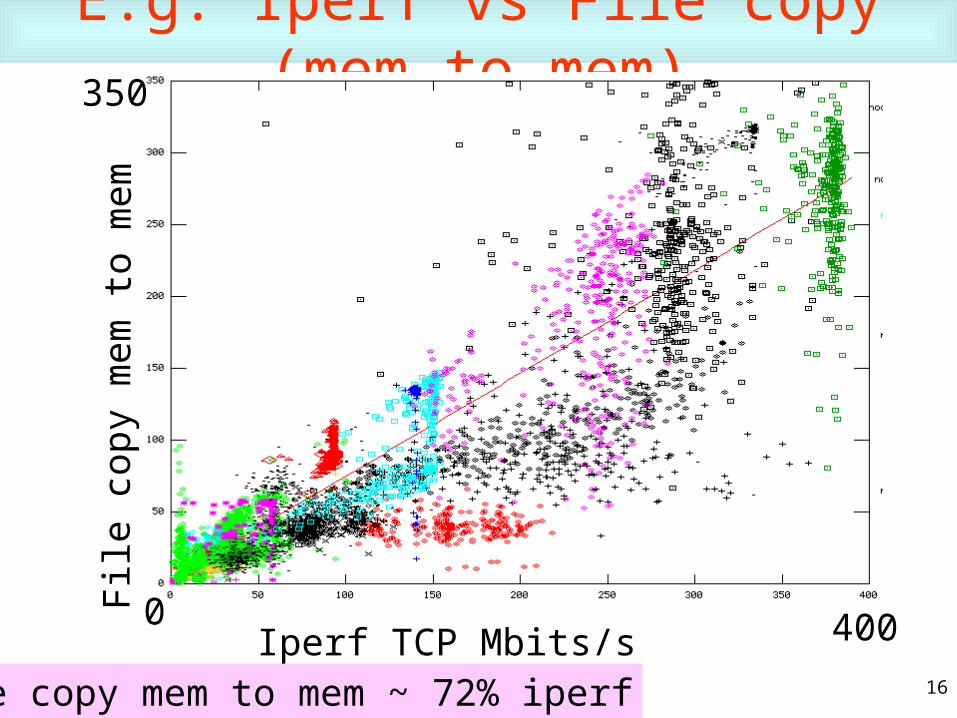
• Bbcp mem to mem tracks iperf
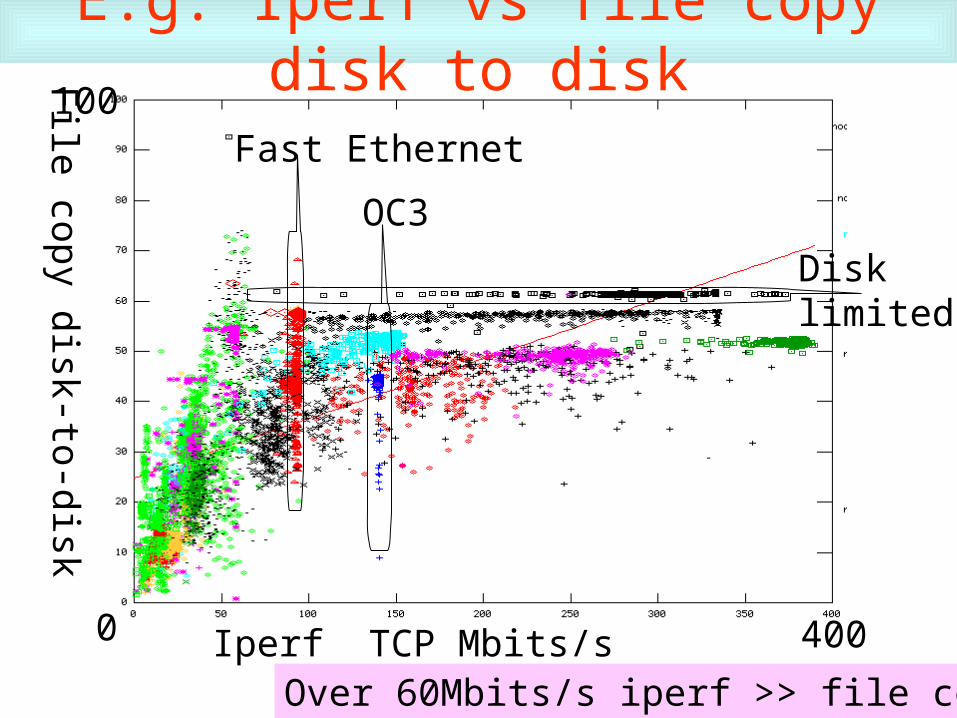
• BBFTP & bbcp disk to disk tracks iperf until disk performance limits
• High throughput affects RTT for others
– E.g. to Europe adds ~ 100ms
– QBSS helps reduce impact
• Archival raw throughput data & graphs already available via http
16
E.g. Iperf vs File copy (mem-to-mem)
0 400
350
Iperf TCP Mbits/s
Fil
e co
py m
em to
mem
File copy mem to mem ~ 72% iperf
17
E.g. Iperf vs file copy disk to disk
0 400
100
Iperf TCP Mbits/s
File copy dis k-to- dis k
Fast Ethernet
OC3
Disklimited
Over 60Mbits/s iperf >> file copy

18
Windows and Streams 1/2• Now well accepted that multiple streams and/or big
windows are important to achieve optimal throughput• Can be unfriendly to others• Optimum windows & streams changes with changes in path• So working on new methods to predict both windows &
streams automatically & optimize– Netest from LBNL uses UDP& TCP
• Predicts window sizes and streams using packet streams, UDP & TCP
• Needs to be validated
– Brute force: run iperf multi windows & streams & find optimum, need to automate measurement & analysis
– Only need to run occasionally or when suspect change • e.g. Step change in number of hops or RTT or other measurement

19
Optimizing streams & flows vs losses
Throughput = i=1,n(MSSi/(RTTi/sqrt(lossi)) (1)
~ (MSS/RTT)(1/sqrt(lossi) ~ [n*MSS]/(RTT*sqrt(loss))So problem reduces to optimizing throughput w.r.t. loss (2)
(2) “The End-to-End Performance Effects of parallel TCP sockets on a Lossy Wide-Area network”, Hacker & Athey, Proc 16th Int Parallel & Distributed ProcessingSymposium, Ft Lauderdale, FL April 2002
20
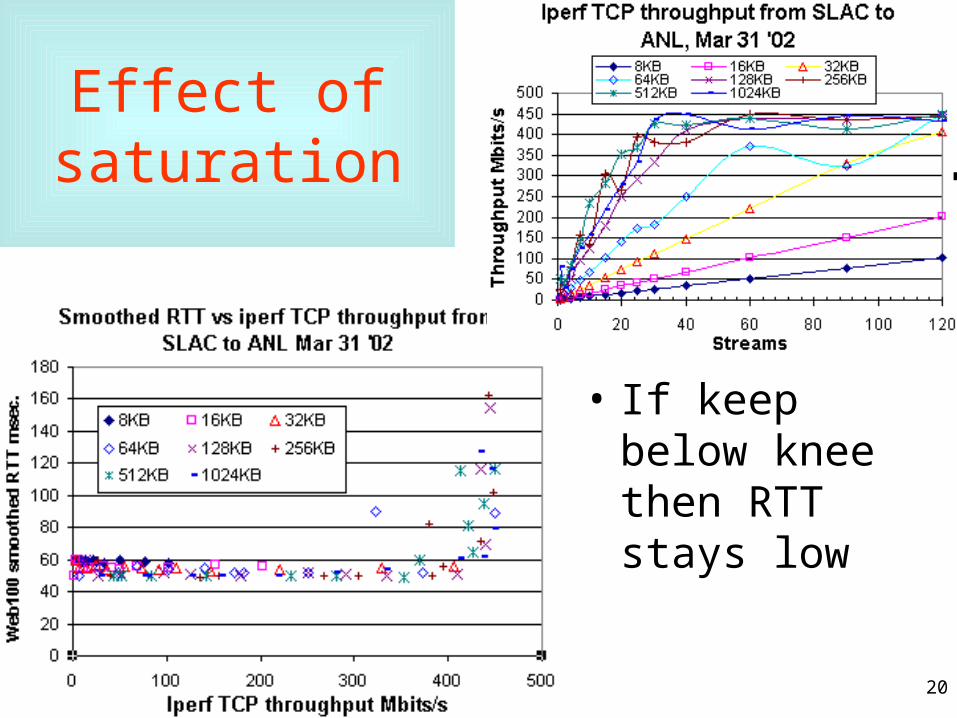
Effect of saturation
• If keep below knee then RTT stays low

21
Estimated vs
measured throughput
• Est BW~C*Streams*MSS/(RTT*sqrt(loss)) (Mathis et. al. & Hacker)• Measure retransmissions using Web100, loss~Retransmissions/total
packet• Note high degree of correlation (R^2 >0.9)• If window large enough ((>=128KB) then ~ common relation,
window threshold varies from link to link

22
Forecasting• Given access to the data one can do real-time forecasting for
– TCP bandwidth, file transfer/copy throughput• E.g. NWS, Predicting the Performance of Wide Area Data Transfers by
Vazhkudai, Schopf & Foster
• Developing simple prototype using average of previous measurements– Validate predictions versus observations– Get better estimates to adapt frequency of active measurements &
reduce impact• Also use ping RTTs and route information
– Look at need for diurnal corrections– Use for steering applications
• Working with NWS for more sophisticated forecasting• Can also use on demand bandwidth estimators (e.g.
pipechar, but need to know range of applicability)
23
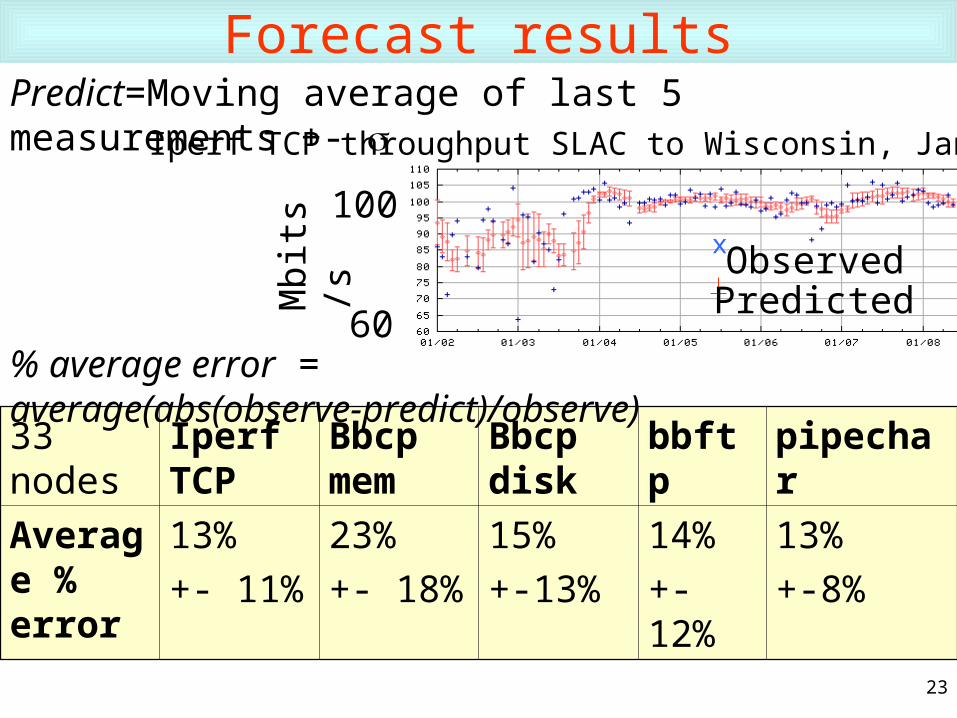
Forecast results
33 nodes Iperf TCP
Bbcp mem
Bbcp disk
bbftp pipechar
Average % error
13%
+- 11%
23%
+- 18%
15%
+-13%
14%
+-12%
13%
+-8%
Predict=Moving average of last 5 measurements +- Iperf TCP throughput SLAC to Wisconsin, Jan ‘02
100
60M
bits
/s
x
PredictedObserved
% average error = average(abs(observe-predict)/observe)
24
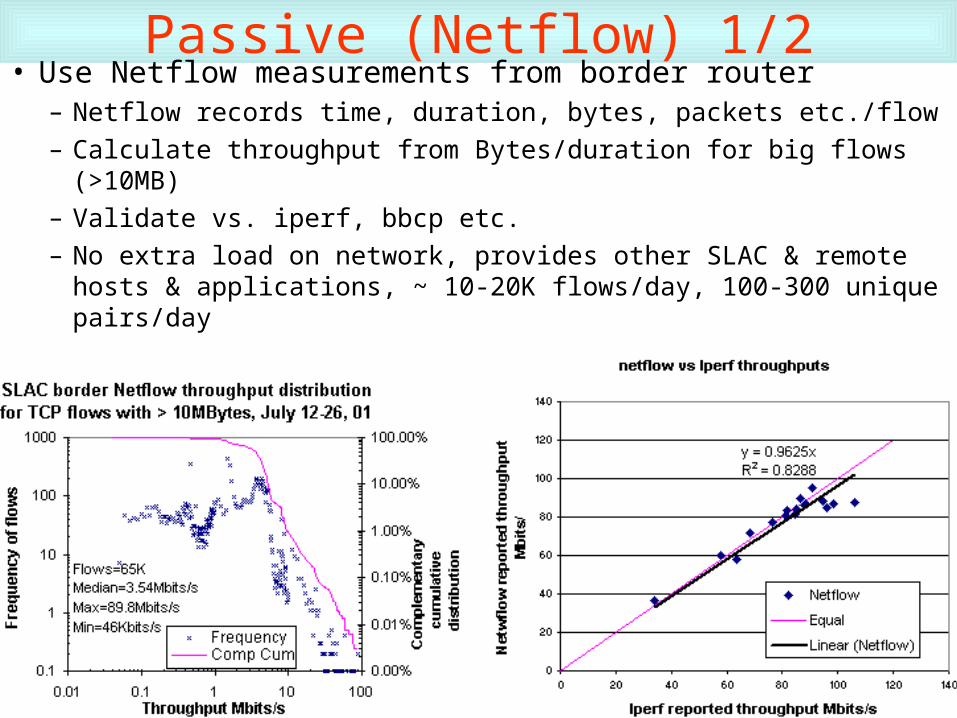
Passive (Netflow) 1/2• Use Netflow measurements from border router
– Netflow records time, duration, bytes, packets etc./flow
– Calculate throughput from Bytes/duration for big flows (>10MB)
– Validate vs. iperf, bbcp etc.
– No extra load on network, provides other SLAC & remote hosts & applications, ~ 10-20K flows/day, 100-300 unique pairs/day
25
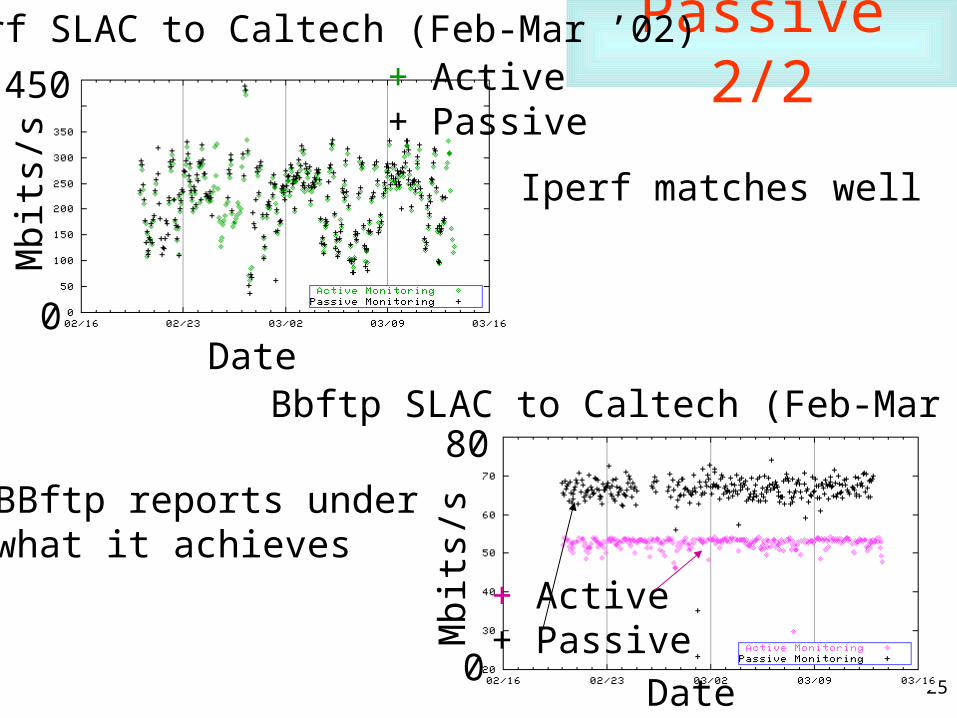
Passive 2/2M
bits
/s
Date0
450
Iperf SLAC to Caltech (Feb-Mar ’02)
0
80M
bits
/s
Date
Bbftp SLAC to Caltech (Feb-Mar ’02)
+ Active+ Passive
+ Active+ Passive
Iperf matches well
BBftp reports underwhat it achieves
26
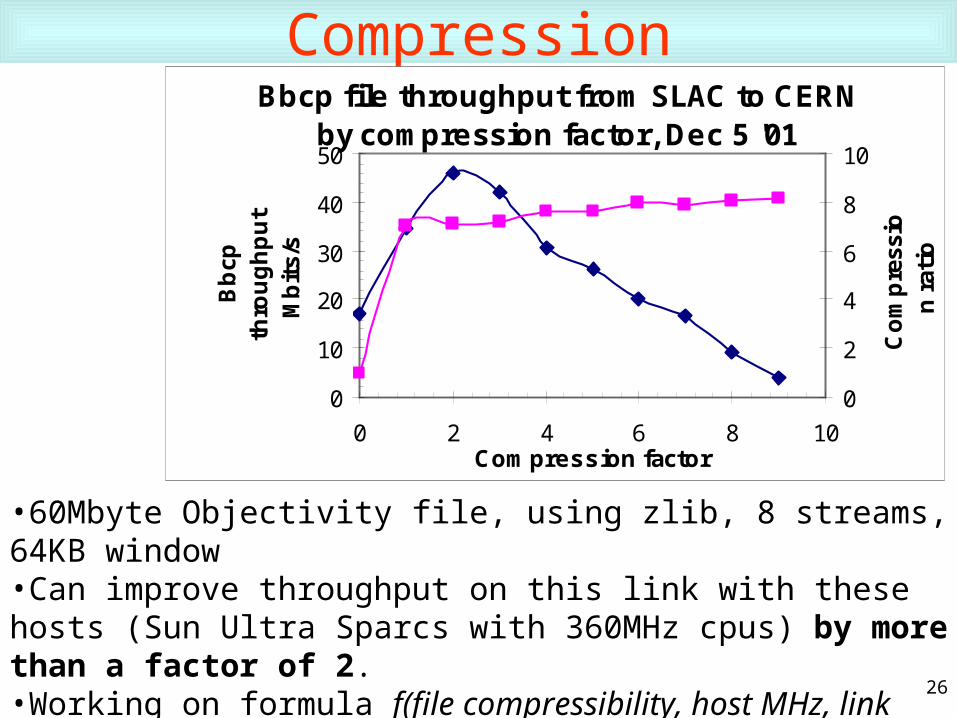
CompressionBbcp file throughput from SLAC to CERN
by compression factor, Dec 5 '01
0
10
20
30
40
50
0 2 4 6 8 10Compression factor
Bb
cp
thro
ug
hp
ut
Mb
its/
s
0
2
4
6
8
10
Co
mp
ress
ion
rat
io
•60Mbyte Objectivity file, using zlib, 8 streams, 64KB window•Can improve throughput on this link with these hosts (Sun Ultra Sparcs with 360MHz cpus) by more than a factor of 2.•Working on formula f(file compressibility, host MHz, link Mbits/s) whether compression is worth it

27
Impact on Others• Make ping measurements with & without iperf
loading– Loss loaded(unloaded)– RTT
• Looking at how to avoid impact: e.g. QBSS/LBE, application pacing, control loop on stdev(RTT) reducing streams, want to avoid scheduling

28Pings to host on show floor
Priority: 9+-2 ms
BE: 18.5+-3ms
QBSS: 54+-100 ms
SC2001 QBSS demo• Send data from 3 SLAC/FNAL booth computers (emulate a tier 0 or
1 HENP site) to over 20 other sites with good connections in about 6 countries– Iperf TCP throughputs ranged from 3Mbps to ~ 300Mbps
• Saturate 2Gbps connection to floor network– Maximum aggregate throughput averaged over 5 min. ~ 1.6Gbps
• Apply QBSS to highest performance site, and rest BE
100
0Time
Mbi
ts/s
Iperf TCP Throughput Per GE interface
QBSSNo QBSS
5mins
29
Possible HEP usage of QBSS• Apply priority to lower volume interactive
voice/video-conferencing and real time control• Apply QBSS to high volume data replication• Leave the rest as Best Effort• Since 40-65% of bytes to/from SLAC come from a
single application, we have modified to enable setting of TOS bits
• Need to identify bottlenecks and implement QBSS there
• Bottlenecks tend to be at edges so hope to try with a few HEP sites
30
Possible scenario• BaBar user wants to transfer large volume (e.g. TByte) of data from
SLAC to IN2P3: – Select initial windows and streams from a table of pre-measured optimal values,
or use an on demand tool (extended iperf), or reasonable default if none available
• Application uses data volume to be transferred and simple forecast to estimate how much time is needed
– Forecasts from active archive, Netflow, on demand use one-end bandwidth estimation tools (e.g. pipechar, NWS TCP throughput estimator)
– If estimate duration is longer than some threshold, then more careful duration estimate is made using diurnal forecasting
– Application reports to user who decides whether to proceed
• Application turns on QBSS and starts transferring – For long measurements, provide progress feedback, using progress so far,
Netflow measurements of this flow for last few half hours, diurnal corrections etc.
– If falling behind required duration, turn off QBSS, go to best effort – If throughput drops off below some threshold, check for other sites

31
Experiences• Getting ssh accounts and resources on remote hosts
– Tremendous variation in account procedures from site to site, takes up to 7 weeks, requires knowing somebody who cares, sites are becoming increasingly circumspect
– Steep learning curve on ssh, different versions • Getting disk space for file copies (100s Mbytes)
– Diversity of OSs, userids, directory structures, where to find perl, iperf ..., contacts • Required database to track
– Also anonymizes hostnames, tracks code versions, whether to execute command (e.g. no ping if site blocks ping) & with what options,
• Developed tools to download software and to check remote configurations – Remote server (e.g. iperf) crashes:
• Start & kill server remotely for each measurement – Commands lock up or never end: – Time out all commands
• Some commands (e.g. pipechar) take a long time, so run infrequently • AFS tokens to allow access to .ssh identity timed out, used trscron
– Protocol port blocking – Ssh following Xmas attacks; bbftp, iperf ports, big variation between sites – Wrote analyses to recognize and worked with site contacts
• Ongoing issue, especially with increasing need for security, and since we want to measure inside firewalls close to real applications
• Simple tool built for tracking problems

32
Next steps• Develop/extend management, analysis, reporting, navigating tools – improve robustness,
manageability, workaround ssh anomalies • Get improved forecasters and quantify how they work, provide tools to access • Optimize intervals (using forecasts, and lighter weight measurements) and durations • Evaluate use of compression • Evaluate self rate limiting application (bbcp)• Tie in passive Netflow measurements • Add gridFTP (with Allcock@ANL), UDPmon (RHJ@manchester) & new BW measurers –
netest (Jin@LBNL), INCITE (Reidi@Rice), pathrate, pathload (Dovropolis@Udel) – Make early data available via http to interested & “friendly” researchers – CAIDA for correlation and validation of Pipechar & iperf etc. (sent documentaion) – NWS for forecasting with UCSB (sent documentation)
• Understand correlations & validate various tools, choose optimum set• Make data available by std methods (e.g. MDS, GMA, …) – with Dantong@BNL, Jenny
Schopf@ANL & Tierney@LBNL • Make tools portable, set up other monitoring sites, e.g. PPDG sites
– Working with INFN/Trieste to port– Work with NIMI/GIMI to evaluate deploying dedicated engines – More uniformity, easier management, greater access granularity & authorization
• Still need non dedicated: • Want measurements from real application hosts, closer to real end user • Some apps may not be ported to GIMI OS
– Not currently funded for GIMI engines – Use same analysis, reporting etc.
33
More Information• IEPM/PingER home site:
– www-iepm.slac.stanford.edu/• Bulk throughput site:
– www-iepm.slac.stanford.edu/monitoring/bulk/• SC2001 & high throughput measurements
– www-iepm.slac.stanford.edu/monitoring/bulk/sc2001/• Transfer tools:
– http://dast.nlanr.net/Projects/Iperf/release.html– http://doc.in2p3.fr/bbftp/– www.slac.stanford.edu/~abh/bbcp/– http://hepwww.rl.ac.uk/Adye/talks/010402-ftp/html/sld015.htm
• TCP Tuning:– www.ncne.nlanr.net/training/presentations/tcp-tutorial.ppt– www-didc.lbl.gov/tcp-wan.html
• QBSS measurements– www-iepm.slac.stanford.edu/monitoring/qbss/measure.html

34
Further slides

35
0 400
300
Iperf TCP Mbits/sWorking with Developer. Not using TCP, but should track Pipechar disagrees badly above 100Mbits/s (6 hosts, 20%),50% of hosts have reasonable agreement
Pip
echa
r m
in th
roug
hpt M
bits
/sE.g. iperf vs pipechar
36
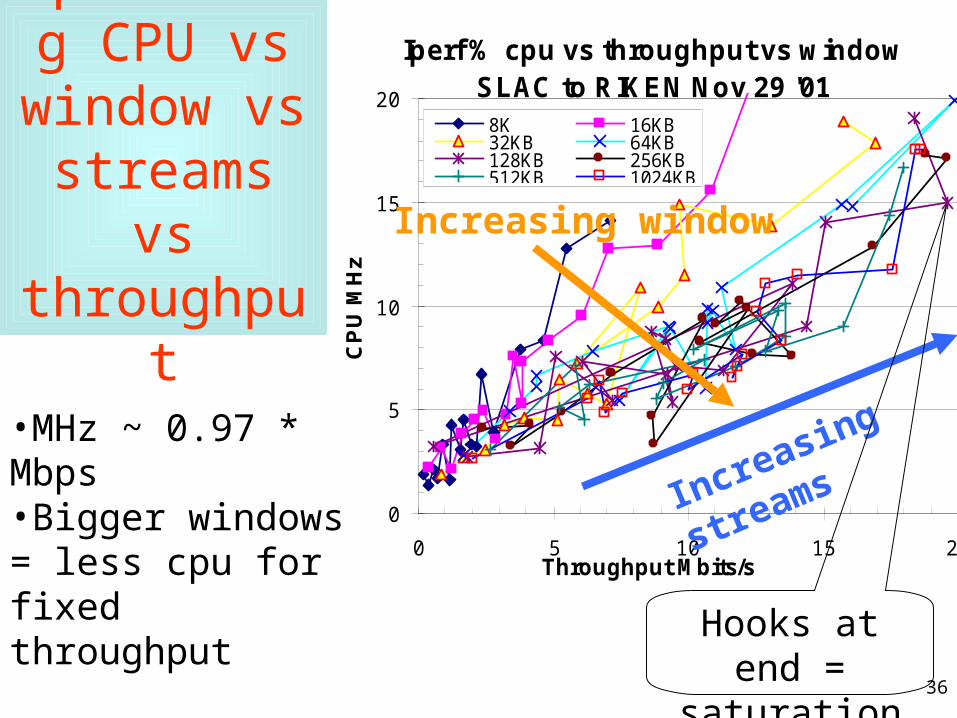
Optimizing CPU vs
window vs streams vs throughput
•MHz ~ 0.97 * Mbps•Bigger windows = less cpu for fixed throughput
Iperf % cpu vs throughput vs window SLAC to RIKEN Nov 29 '01
0
5
10
15
20
0 5 10 15 20Throughput Mbits/s
CP
U M
Hz
8K 16KB32KB 64KB128KB 256KB512KB 1024KB
Increasing window
Increasing streams
Hooks at end = saturation

37
Typical QBSS test bed• Set up QBSS testbed
• Configure router interfaces– 3 traffic types:
• QBSS, BE, Priority
– Define policy, e.g.• QBSS > 1%, priority < 30%
– Apply policy to router interface queues
10Mbps
100Mbps
100Mbps
100Mbps
1Gbps
Cisco 7200s
38
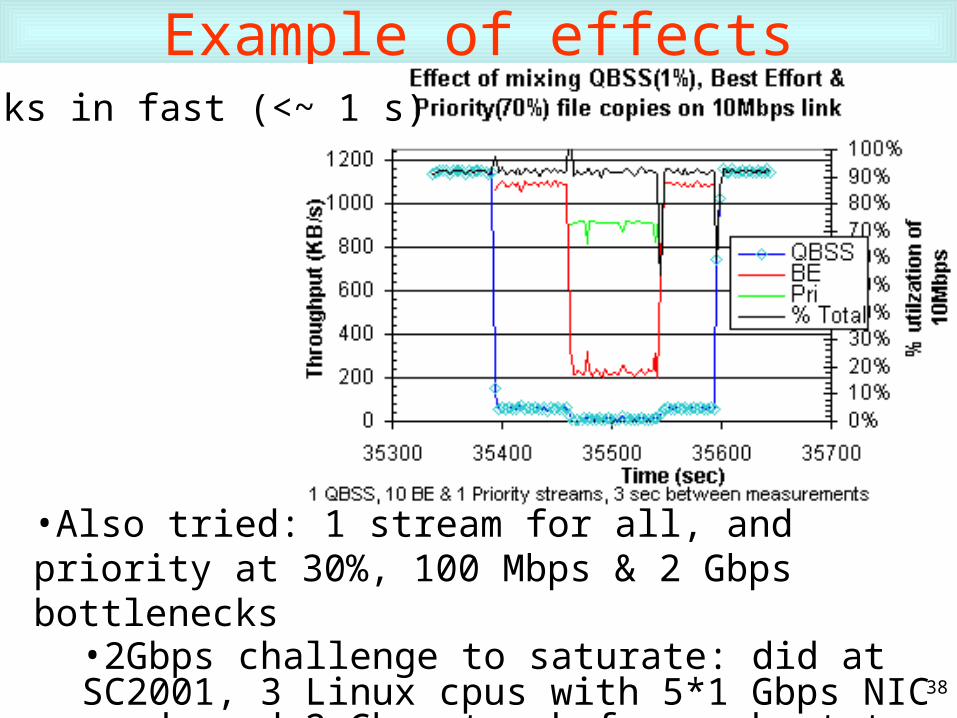
Example of effects
•Also tried: 1 stream for all, and priority at 30%, 100 Mbps & 2 Gbps bottlenecks
•2Gbps challenge to saturate: did at SC2001, 3 Linux cpus with 5*1 Gbps NIC cards and 2 Gbps trunk from subnet to floor network, sending to 17 hosts in 5 countries
Kicks in fast (<~ 1 s)
39
Impact on response time (RTT)• Run ping with Iperf loading with various QoS
settings, iperf ~ 93Mbps– No iperf ping avg RTT ~ 300usec (regardless of QoS)– Iperf = QBSS, ping=BE or Priority: RTT~550usec
• 70% greater than unloaded
– Iperf=Ping QoS (exc. Priority) then RTT~5msec• > factor of 10 larger RTT than unloaded
40
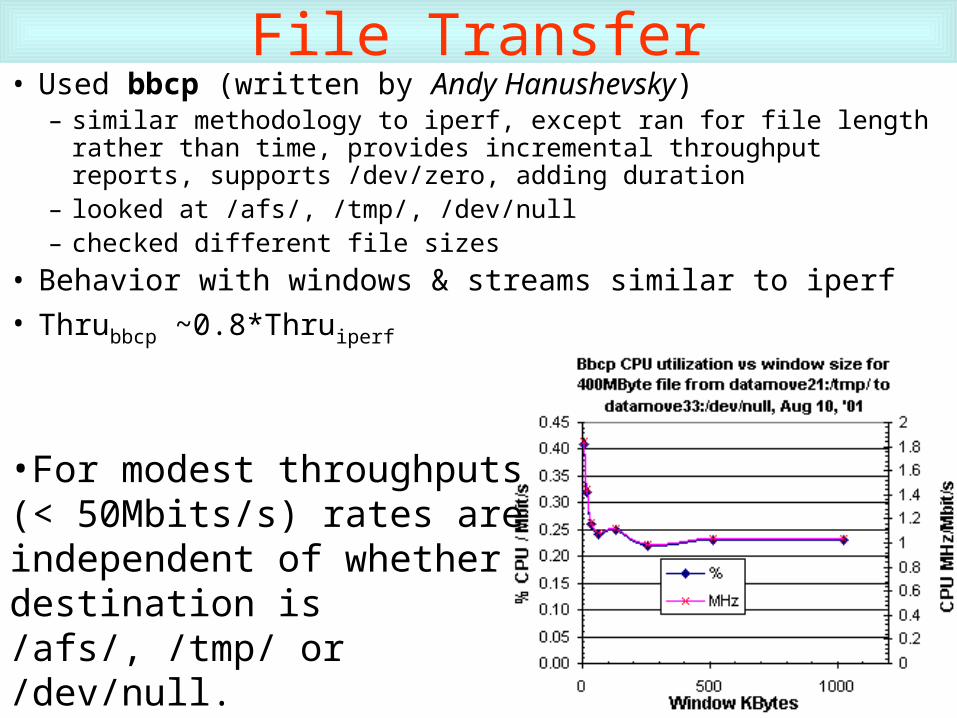
File Transfer• Used bbcp (written by Andy Hanushevsky)
– similar methodology to iperf, except ran for file length rather than time, provides incremental throughput reports, supports /dev/zero, adding duration
– looked at /afs/, /tmp/, /dev/null– checked different file sizes
• Behavior with windows & streams similar to iperf
• Thrubbcp ~0.8*Thruiperf
•For modest throughputs (< 50Mbits/s) rates are independent of whether destination is /afs/, /tmp/ or /dev/null. •Cpu utilization ~ 1MHz/Mbit/s is ~ 20% > than for iperf
41
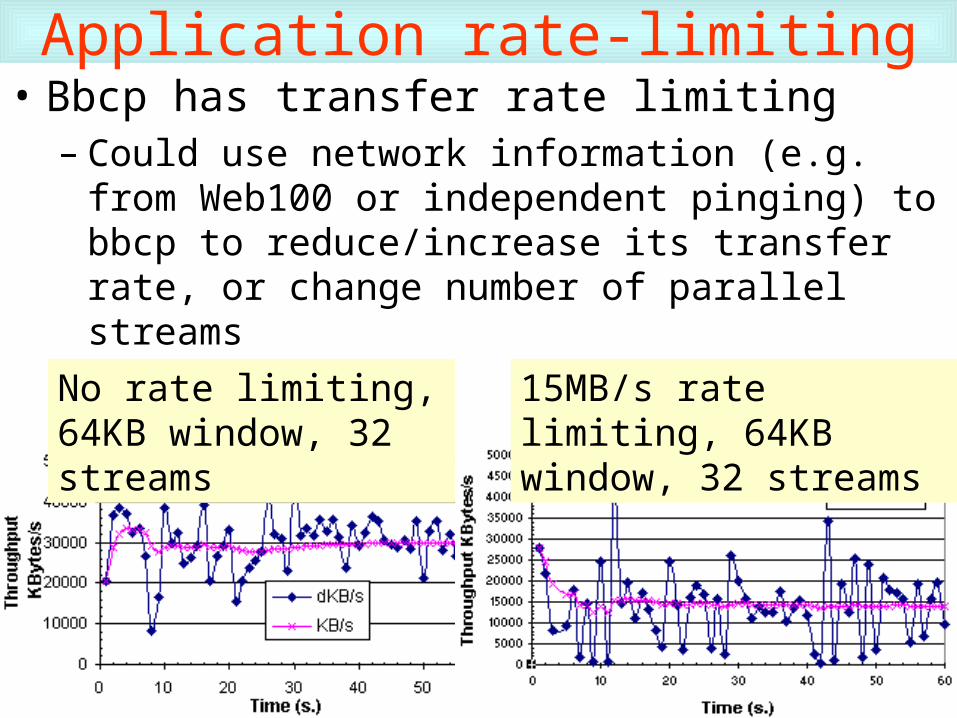
Application rate-limiting• Bbcp has transfer rate limiting
– Could use network information (e.g. from Web100 or independent pinging) to bbcp to reduce/increase its transfer rate, or change number of parallel streams
No rate limiting, 64KB window, 32 streams
15MB/s rate limiting, 64KB window, 32 streams