1 7. r epetitive c onstruction objective: to understand how production and production rates are...
TRANSCRIPT
1
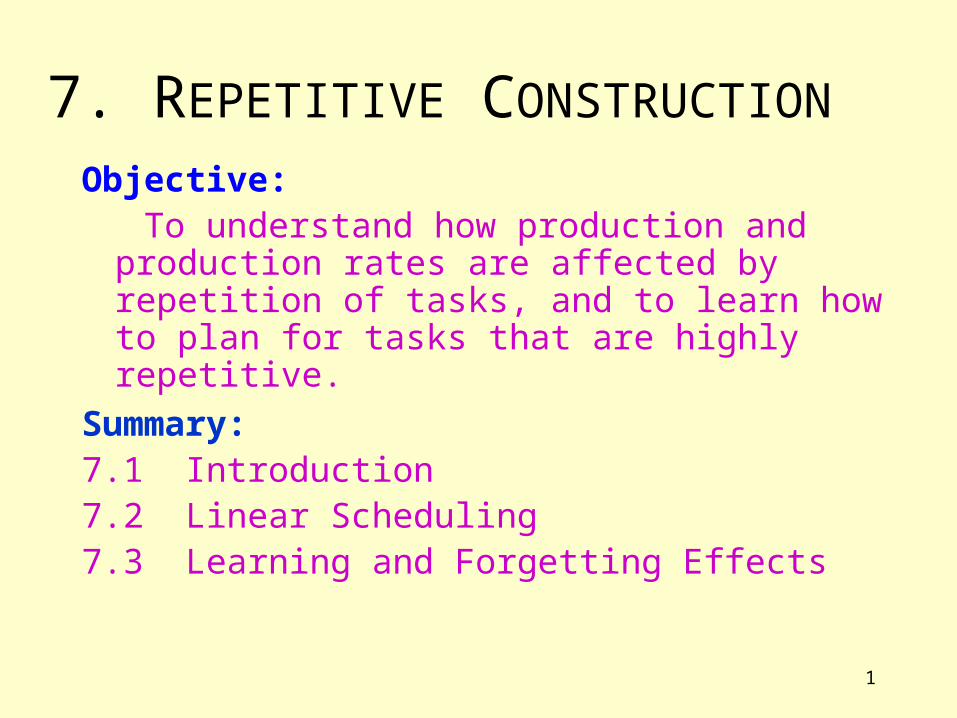
7. REPETITIVE CONSTRUCTION
Objective: To understand how production and production rates
are affected by repetition of tasks, and to learn how to plan for tasks that are highly repetitive.
Summary:7.1 Introduction7.2 Linear Scheduling7.3 Learning and Forgetting Effects

2
7.1 INTRODUCTIONMany tasks in construction are repetitive, and these can be divided into two basic types:
– Discrete Repetition (where discrete units of an item are built many times over):• building many similar housing units;• building multiple (similar) floors on a high rise building;
– Continuous Repetition (where the item being constructed is one continuous unit):
• laying a long pipeline;• constructing a tunnel;• building a long RC retaining wall;
– Note, tasks that are continuously repetitive are often performed in discrete units:• an RC retaining wall may be built in sections;• while a tunnel boring machine will operate continuously, lining the tunnel behind it may be
done in discrete sections.

3Fig. 7-1: Ladder Representation of Highly Repetitive Tasks
7.2 LINEAR SCHEDULINGCPM is not an appropriate planning tool for tasks that are highly repetitive:
– activity networks can become complicated;– although activity networks can be simplified with a ladder, if there is a lot
of repetition, then:• it is difficult to see where phased tasks may interfere with each other• the internal critical path could become complicated if the time to repeat a task
varies.
Each activity is made upof lots of sub-activities.We do not know wherethe interferences (andthus the critical path)
will occur internally ona ladder.

4
Linear scheduling provides a very simple yet very effective means of modeling highly repetitive tasks:
Fig. 7-2: Simple Velocity Diagram for a Pipeline ProjectTIME
WORK COMPLETED
LAYOUT EXCAVATE LAY PIPE BACK FILL
Time Buffer(Free Float)between 2activities
Space bufferbetween 2activities
BACK FILL started late to avoidinterference with LAY PIPE and to provide a minimum space buffer at their point of convergence
LAY PIPE started late to provide a space buffer between itself and EXCAVATE
Minimum spacebuffer betweenLAY PIPE andBACK FILL
Gradient of line= production rate.
Time Now
read offstage of
completion
read offstage of
completion
The starts of both LAYOUTand EXCAVATE are criticaland the whole of LAY PIPE

5
Linear scheduling allows us to determine ways of reducing the project duration. This may involve:
– adding more crews (including equipment) to certain activities; – adding more crew members (and/or other type of resources
such as equipment) to certain activities; and– adding more efficient/productive resources to certain activities.

6
How can the project duration be reduced?
Fig. 7-3: Crashing (compressing) Project DurationTIME
WORK COMPLETED
LAYOUT EXCAVATE LAY PIPE
BACK FILL started earlier than before in an attempt to finish sooner
Minimum spacebuffer betweenLAY PIPE andBACK FILL
BACK FILL
BACK FILLfinishes nosooner
Q: Can we start activity BACK FILL sooner?A: Yes, but will not reduce project duration, yet will increase costs as introduces
idle time where it slows down to maintain space buffer with LAY PIPE.

7
Can reduce project duration by adding extra crews:– if do this for one activity, it would have to be LAY PIPE
Fig. 7-4: Adding Extra Crews to Reduce Project DurationTIME
WORK COMPLETED
LAYOUT EXCAVATE
Minimum spacebuffer betweenLAY PIPE andBACK FILL
LAY PIPEBACK FILL
Second crew can start whenthere is enough space between(1) the two LAY PIPE crews; and(2) 2nd LAY PIPE crew and EXCAVATE crew.
BACK FILL can startand finish earlier, reducingproject duration.

8
Can reduce project duration by adding extra crews to adjacent tasks:
Fig. 7-5: Adding Extra Crews to Two Adjacent TasksTIME
WORK COMPLETED
LAYOUT LAY PIPEBACK FILL
BACK FILL can startand finish earlier, reducingproject duration.
EXCAVATE
Minimum spacebuffer betweenLAY PIPE andBACK FILL

9
Alternatively, sometimes, can reduce project duration by adding extra members to a crew:
Fig. 7-6: Adding Extra Crew Members to Reduce Project Duration
TIME
WORK COMPLETED
LAYOUT EXCAVATE
LAY PIPEBACK FILL
BACK FILL can startand finish earlier, reducingproject duration.
More crew members canincrease production rate

10
Finally, how can project duration be reduced without adding more resources such as crews, equipment, or crew members?
Fig. 7-7a: Reducing Project DurationTIME
WORK COMPLETED
LAYOUT EXCAVATE LAY PIPE BACK FILL
In this problem, we have anadditional activity (COMPACT).Its minimum buffer with thepreceding activity is at its start.
COMPACT
How can we start activityCOMPACT sooner withoutadding more resources toany activity?

11
One solution is to reduce the crew size for activity BACKFILL.
Fig. 7-7b: Reducing Project Duration by Delaying a CrewTIME
WORK COMPLETED
LAYOUT EXCAVATE LAY PIPE
BACK FILL
The reduced crew size on BACKFILLmeans its production rate will be reducedand thus it needs to start sooner to ensurethat it finishes at its early start time.
This, in turn, allows COMPACT to startsooner and thus finish sooner.
COMPACT
12
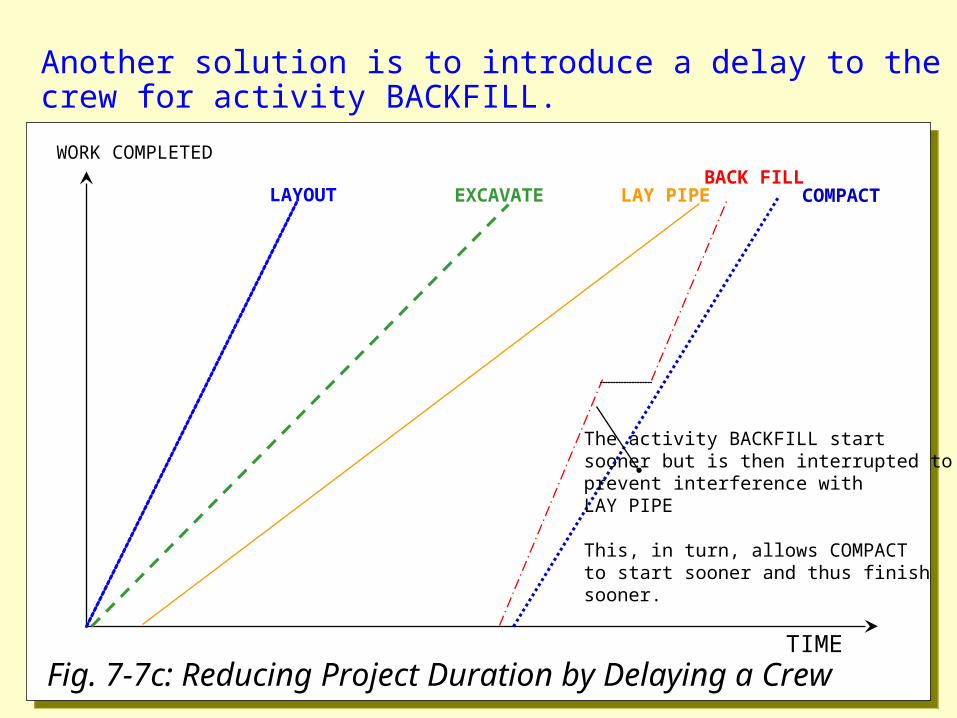
Another solution is to introduce a delay to the crew for activity BACKFILL.
Fig. 7-7c: Reducing Project Duration by Delaying a CrewTIME
WORK COMPLETED
LAYOUT EXCAVATE LAY PIPE COMPACT
The activity BACKFILL startsooner but is then interrupted toprevent interference withLAY PIPE
This, in turn, allows COMPACTto start sooner and thus finishsooner.
BACK FILL

13
Not all tasks progress at a constant rate:therefore, need to allow for this in planning task schedules.
Fig. 7-8: Production Curves may be Non-LinearTIME
WORK COMPLETED
LAYOUT BACK FILLLAY PIPEEXCAVATE
The nature of the workmay change over theproject, for example,the depth of theexcavation mayvary over thelength of thepipe run.
Learning effects cancause significantaccelerationon some tasks

14
Identifying the critical path is straight forward:– it must go from the start to the end by some route
Fig. 7-9: Determining the Critical Path(s)
LAYOUT
TIME
WORK COMPLETED
LAY PIPEBACK FILL
EXCAVATE
CRITICAL PATHEasiest to determine thisworking backwards fromthe end of the project.
The critical pathtakes this routebecause thegaps areequal to theminimumvaluefor the spacebuffers.
ARTIFICIAL CRITICAL PATHThis represents the portion of atask that is critical because it isartificially made to start at its latestart time (according to the logicof the activity dependencies, itcould start sooner).

15
There could be some tasks that are performed at a fixed location:
Fig. 7-10: Production Curves may be Non-LinearTIME
Distance
LAYOUT BACK FILL
LAY PIPE
EXCAVATE
Second pole is criticalas it has forcedEXCAVATE (whichis critical) to bedelayed
Remove twoutility poles

16
7.3 LEARNING AND FORGETTING EFFECTS
Research shows that whenever a task is repeated many times in construction, there is usually a corresponding reduction in how long it takes to perform:
– this is referred to as the learning (or experience) effect;– if the task is repeated with minor interruptions:
• the curve can be approximated by a simple mathematical function (a negative logarithmic curve);
– whenever there are significant interruptions:• some of the learning is lost and performance regresses part of the way back
up the curve;• this is referred to as the forgetting effect.

17Fig. 7-11: Learning and Forgetting Curve Repetition Number
Time to Complete a Task
1 2 3 4 5 6 7 8 9 10 12 13 14 15 16 17 18 19 20 21 22
A delay between the12th and 13th repetitionof the task led toforgetting. The new learning curve has the
same form as an earlier part of theoriginal learning curve - in effect
learning has regressed. In thisexample, the 13th repetition
has regressed back as if itwere just the 4th
repetition.

18
There are many implications for the learning and forgetting effects:
– you can plan for work to accelerate if it is repetitive:• thus, fewer crews may be required to get the work completed on time;
– you should not swap crew members, and you should avoid changing crews, since the benefits of learning will be lost:
• the learning curve will remain flat in the worst case;
– if work is falling behind schedule, you should add crews (or crew members) early so that they have more time to learn:
• this way, fewer crews will be needed and will operate at a higher productivity (so that costs come down).

19
Theory:– the learning curve can be approximated by a negative
logarithmic function:• for every doubling in the number of repetitions, there is a constant
decrement in CAT (the Cumulative Average Time to complete those tasks):
)()./1( tnCATn
1 125.0 days 125 days - 2 75.0 days 100 days 80%
4 56.7 days 80 days 80%
8 44.3.7 days 64 days 80%
REPETITONTIME t TO
COMPLETE TASK CAT
DECREMENTAL CONSTANT IN CAT FORDOUBLING IN
REPETITIONS

20
• thus, in theory, plotting the logarithm of CATn against the logarithm of n should produce a curve that approximates a straight line:
Fig. 7-12: Log-Log Learning Curve Logarithm of n-th repetition
Logarithm of CATn
0
Slope (s)
Intercept (c)

21
If we know s and c then we can predict:– the time, T, to complete n repetitions of a task;– the time, t, to complete the n-th task; and– the number of repetitions, n, we can complete in a given period of time, T;
From this, we can then also determine how many crews, or extra crews are needed to complete the work on time.How do we find s and c ?:
– from published data:• see lecture 7 notes;
– from our own site data:• if we know how long it took to perform the first few repetitions of a task, then we can plot on a log-log graph and find a best fit line;

22
Fig. 7-13: Finding Approximation of Log-Log Learning Curve.
Logarithm of n-th repetition
Logarithm of CATn
0
Best fit line through points.This can be achievedusing linear regression.
Knowing the best fit line,we can now determineappropriate values for s and c.
= observed values