1-217
TRANSCRIPT

7/27/2019 1-217
http://slidepdf.com/reader/full/1-217 1/10
Some Critical Discussions on Flash
and Fire Points of liquid Fuels
HIROKI ISHIDA and AKIRA IWAMA
Institute of Space and Astronautical Science
4-6-1, Komaba, Meguro-ku, Tokyo, 153, Japan
Keywords: Pre-flash point, Flash point, Fire point, Vapor pressure, lower
flammability limit, Raoult's law, Clausius-Clapeyron's law
ABSTRACT
The liquid fuel temperatures of the flash and fire points were discussed fortheir accurate measurement according to their definitions from the view point ofspilled fuel fire hazard prevention. The flash and fire points for some hydrocarbon and alcohol fuels were measured at th e open cup system with an electricspark ignition source, avoiding the external air blow. Measured results were
compared with those by th e usual methods of Tag Closed Cup and Pensky-Martens ,and some influencing factors in the measurement were discussed. In the presentstudy, pre-flash phenomenon, namely "Pre-flash point", was found at a 11t t le lowerliquid temperature than the flash point. I t suggests that the specification ofthe scale of flame appearance at flash phenomenon above the fuel pool surfaceshould be introduced in the usual methods of flash point measurement. Presented
consideration on flash point covers th e theoretical prediction of flash point ofthe binary hydrocarbon fuel mixture.
RECENT PHASES OF THE STUDIES
Many studies on the fire hazard prevention for liquid fuel have concentratedtheir serious interests to the flash point of the fuel for more than forty years.
The flash point is defined as th e fuel temperature at which the equilibrium fuelvapor concentration of i ts lower flammability limit is attained. I t has beenmeasured and investigated concerning such parameters as the latent heat of vaporization, the boiling temperature and the fuel vapor concentration of lowerflammability limit for the purpose of theoretical predict ion of the accuratefuel temperature when the flash phenomenon occurs (1-8). Many previous reports,however, have presented divergent measured values one another, which are due tocomplex parametric factors in their measuring apparatuses and methods for flashpoint such as the position and dimension of ignition source, mixing or no-mixingin vapor phase above pool, and fue l con ta iner condition (open or closed)(1-14).
Then, no t a ll investigations in this field are, of course, necessarily complete, as discussed in detail by Glassman et al.(16). I t seems that some unsol
ved problems remain s t i l l in the usual methods of flash point measurement forthe purpose of obtaining the accurate flash point (9,13-17). Although the firepoint is defined as the lowest fuel temperature at which the diffusion flame issustained above the fuel pool without any external heat supply (7,19,20), generally reliable data have not been published. We can see the considerable
The present address for Hiroki Ishida is Dept. of Mechanical Eng., Nagaoka Technical Colleae
888, Nishikatakai, Nagoaka, Niigata-pref., 940, Japan.
FIRE SAFETY SCIENCE-PROCEEDINGS OF THE FIRST INTERNATIONAL SYMPOSIUM 217
Copyright © International Association for Fire Safety Science

7/27/2019 1-217
http://slidepdf.com/reader/full/1-217 2/10
divergence among th e fire point data in some previous papers, and the divergenceseems due to more complex parametric factors in the measuring methods which havesignificant effects on the measured result than in flash point measurement(15-20).
FAVORABLE MEASUREMENT OF FLASH AND FIRE POINTS
80 100 120
Liquid Tern-perature CC)
6. : Upper Flammability Limit
o : lower Flammability Limit
Til: Theoretical Flash Point
FIGURE 2
60 80 100 120
Liquid Temperature ("Cl
FIGURE 1
corE!, 102
-
7
e 50.
R :3
§
Hg
The purpose of the present study is to obtain the accurate flash and firepoints for some hydrocarbon and alcohol fuels under the experimental conditionaccording to their definitions, and to examine the measured results comparing with
those in previous studies for clarifying the influencing factors in the measurement. Although different apparatuses and methods give different measured values,i t is necessarily important to know the accurate fuel temperatures at flash andfire phenomena according to their definitions for the detailed discussions in theproblems of the flame spread mechanism along liquid fuel surfac e (15-18) and ofthe ignition behavior of fuel droplet in the hot atmosphere (21-24) or on the hot
solid surface (25,26). The accurate measurements of these temperatures are impotant also for the estimation and classification of the flammability hazard of l iq
uid fuels. Figures 1 and 2 show the relations between the equilibrium vapor pressure and liquid temperature for alcohol and hydrocarbon fuels respectively, whereT1l
indicates the theoretical flash point. The essentials in all the methods for
f ash point measurement exist in the accurate measurement of Tf l .
103 103 , - - - - -- - - - - - -- - - - - - - - - - - - - - ----------,
7"-- --- -------------------r
FIG.l and 2: The Relation between Equilibrium Vapor Pressure and Liquid
Fuel Temperature (from l i terature).
As predicted reasonably, there exists the boundary layer of fuel vapor concentration above liquid pool. Figure 3 shows the interferogram with He-Ne lasersource (wave length; 6328 A) and the concentration profile in the boundary layerof n-octane vapor above the liquid surface. Figure 3 shows that the equilibriumfuel vapor concentration adjacent to the pool surface agrees with that predictedfrom Fig.2. The result shown in Fig.3 suggests also that the dis turbance of fuel
vapor diffusion has a s ignif icant e f fec t on th e production of flammable concentration zone above th e pool surface and on th e measured results of flash point.
We can expect that measured flash point approaches to the theoretical value Tf leven by the open cup method, i f the ignition source is placed c l ? s e l ~ to the poolsurface and disturbing air blow is prevented. Also the flash p o ~ n t to be measured as higher value with increase of the distance between the ignition source
and th e pool surface (6,16).
218

7/27/2019 1-217
http://slidepdf.com/reader/full/1-217 3/10
FIG.4: Schematic Drawing of The Measurementapparatus of Flash and Fire Points a t OpenCup System with Electric Spark Ignition Source.
FIG.3: Interferograms (a) and (b) of Concentrat ion Boundary Layer, and Calculated Concentration Profile (c) above n-octane poolat 14 ·C.
Figure 4 shows the measurementapparatus in the present study offlash and f ire points with opencup and spark ignition source. The
fuel was fi l led up to the liplevel of the container cup (diameter 50 mm, depth 20 mm) and thefuel temperature was maintainedconstant by the temperature cont rol led cup. Phototransistor wasused fo r the detection o f flamewhen the flash phenomenon occurred, and thermocouple (C-A, 0.1 mm
dia.) was taken for monitoringthe fuel surface temperature.Spark electrode position above
pool surface is accurately set ata height by a cathetometer, sparkgap is 3 mm, and spark duration
was set at 0.3 sec by relay circuit apparatus. Then, spark energy, approximately 100-300 mJ generated by the induction coil , issufficient as the ignition source.For avoiding the dis turbance offuel vapor diffusion by externalair blow, most of measurementequipments were enclosed in the
windshield with PMMA plates.16 mm movie was taken for observing the aspect of flash phenomenonin detail .
PRE-FLASH, FLASH AND FIRE PHENOM
ENA
In the present study, typicalhydrocarbons and al cohol s of whichflash points are not so far fromthe room temperature were chosenfrom the view point of accurate
measurement in the experiment.The "pre-flash" phenomenon can beobserved for some fuels at a l i t -
t le lower liquid temperature thanthe flash po in t. I t is instantaneous and faint but clear propagating appearence of a flamelet,and is due to local flame propagation through the strat i f ied fuelvapor layer adjacent to the poolsurface.
Figure 5 shows the pre-flashphenomenon on the pool surface ofn-nonane, where a propagatingstretch of flamelet appears in thepicture No,2. Pre-flash is clearly different from the flame appearance such as small blue "halo"
.Therrnocouple (C-A)
C ~ n t a i n e rI
---------t---OI 16mm CineI Camera
II
r-------- ---
...
--
219

7/27/2019 1-217
http://slidepdf.com/reader/full/1-217 4/10
of the burning fuel vapor which surrounds the pilot ignition flame as often observed in usual flash point measurements (e.g. Tag Closed Cup and Pensky-Martensmethods), and such blue halo would not propagate across the pool surface.Figures 6 and 7 show the flash and fire phenomena on the n-nonane pool respec
t ively, which follow after the pre-flash. Flame propagation area above the poolsurface in the flash is clearly larger than that in the pre-flash. Although thefull interpretation of "pre-flash" phenomenon, especially the reason why theflamelet propagates locally only above some part of pool surface and why i t isextinguished on th e way, can not be given in the present stage of this study, wecan consider some important factors as that the position of ignition source (spark
electrode) is the center of fuel pool surface of the tray, and there must existthe considerable escape of generated fuel vapor by outer diffusion near the periphery of tray. Fire phenomenon was determined as the flame sustaining of atleast five seconds above the pool after the flash phenomenon. In these figures,a generated spark is imaged by halation shown as the small bright point. Flashphenomenon is in i t sel f the ignition and flame propagation in gas phase where th efuel vapor concentration gradient exists, and the flame propagates through only
the thin stratified gas layer close to the pool surface (27-30).Then, th e scale of flame appearance on the pool surface should be specified
additionally in the usual methods of flash point measurement. On the other hand,for alcohol fuels (n-butanol and iso-butanol), such pre-flash and flash phenomenacould not be observed. Glassman et a l. also discussed the experimental resultthat the flash and f i re phenomena occur at the same liquid temperature fo r alcoholfuels( 16) .
Table 1 shows the fuel temperatures at which pre -f la sh , f la sh and fire phenomena occurred, with th e relation to the height of spark electrode above fuelsurface. Table 2 shows the measured results of flash point by usual methods, TagClosed Cup and Pensky-Martens methods, and theore tica l f lash point determined bythe condition of lower flammability l imit concentration on th e curve of equilib
rium vapor pressure. As shown in these tables, except alcohol fuel, the pre-flashpoint is 1-3'C lower than th e f la sh poin t, and the fire point is 3-7 'C higher than
the flash point when the spark position is 3 mm above pool. For alcohol fuel,although i t was very difficul t to distinguish between flash and fire points inthe present spark method, the fire point is , however, shown about .10'C higher than
the flash point by Tag Closed Cup method. For o-xylene, a bright flame and sootformation can be observed not only in the fire phenomenon but also even in thepre-flash and flash phenomena, which are usually observed for such fuels as aromatic compounds.
As evident from these tables, flash points by open cup method with sparkignition source are higher than those by Tag Closed Cup method. This is , asoften discussed for closed cup method, due to the local heating of pool surface
by small pilot ignition flame and the incre ase of air entrainment by th e inducedconvection. On the other hand, fire points by the open cup method with spark
ignition source are lower than those by Tag Closed Cup method, which is probablybecause the air entrainment is sufficient at open cup system but poor at closedcup system.
The heigh ts of small pilot ignition flame (about 4 mm dia.) above pool surface are specified as 27-29 mm in Tag Closed Cup method (ASTM D-56), 19-21 mm inPensky-Martens method (ASTM 0-93) and 9-11 mm in Cleaveland Open Cup method (ASTM D-92). They are very higher than the positions of spark ignition source inthe present study, but the thermal energy of spark ignition source is very smallerthan that of pilot flame. Then, the effect of local heating of pool surface byspark and/or thermocouple can be neglected in th e p resen t study.
Pre -f la sh , f al sh and f i re points rise 1-3, 2-5 and 2-10 ·C respectively withincrease of the height of spark ignition source. When the height was lower than
3 mm, i t was often impossible to ignite the fuels in th e p re sent study. Theseresults suggest lucidly that flash phenomenon occurs only when tne flammablemixture was produced around the ignition source, and the quenching layer above
220

7/27/2019 1-217
http://slidepdf.com/reader/full/1-217 5/10
~ 0J
ro-- l
I\ )
I\ )...
U1
FIGURE 5: Direct Movie Photographs (48 p ps ) at Pre-FlashPoint (37°C) of n -Non an e, Sp ark Position is 3 mm above Pool.
~FIGURE 6: Direct Movie Photographs (24 p ps ) at Flash Point(38·C) of n -Non an e, Sp ark Position is 3 mm above Pool.

7/27/2019 1-217
http://slidepdf.com/reader/full/1-217 6/10
NNN
FIGURE 7: Direct Movie Photographs (24 pps) at Fire Point
(42'C) of n-Nonane, Spark Position is 3 mm above Pool.

7/27/2019 1-217
http://slidepdf.com/reader/full/1-217 7/10
TABLE 1: Measured Fuel Temperatures at Pre-flash, Flash andFire Phenomena with The Relation to The Height of Spark Electrodeabove Pool Surface.
- - - - - ~ ~ - ,Pre-f lash Po in t (Oe) Fire Po in t (OC)
FuelA A
n-oceene 16.6 14 . B 17. B 20.4 12 20.8 17 .6 23.0 B
n-nonane 36.3 34 .0 35 .9 40.1 31 42.2 44.6 44.7 47.1
n-Decane 51 . 0 51.0 56.4 59.1 .6 60.6 62.4 64.2 65.2
n- C4HgOH
29 38.1 42.9 44.7 48.7
i so-C4HgOH
28 28.8 32.3 35.7 38.5
a-Xylene 34.3 34.5 34.6 39.0 32 41.5 48.2 50.1 51 . 0
Spark e lec t rode posi t ion above l iq u id s ur fa ce : A= 3, B"" 5 , C= 7, D= 9 (mm)
E : Value from l i t e r a t u r e (Closed Cup method)
TABLE 2: Measured Flash and Fire Points by TagClosed Cup and Pensky-Martens Methods.
FuelFlash poin t (0C) Fire Poin t (OC)
Tn (OC)
c.c, p.M. C.C. P.M.
n-oct.ane 17,1 28,0 24.5 37.0 13
n-Nonane 33 .5 40.5 43.0 56.0 29
n-uecene 50.0 57,0 67,5 77 .0 .6
n- C4HgOIl 37.0 46.0 48 .0 56 .0 32
iSO-C4H gOH
30.3 - 38 . a - 26
a-Xylene 31.8 - 43.3 - 29
c . c . : Ta g Closed Cup Method
P.M. : Pensky-Martens Method
T n : Theo r e t i c a l Flash poin t b y Low er Flammabi l i ty
Limi t on vapor Pressure Curve
fuel pool where the flame can no t propagate certainly exists. Glassman et a l.reported that the quenching distance above liquid surface is very small (below0.3 mm) for some alcohols and very large (about 3 mm) for some hydrocarbons(l6).
Therefore,from the different measuring methods of flash point and consequent
different measured results as mentioned above, the significance and/or applicationof flash and fire poin ts data to the investigation of such problems as flame spread
mechanism across the liquid surface, ignition of liquid droplet and ignition hazardclassification of liquid fuels should be discussed separately.
PREDICTION OF FLASH POINT OF LIQUID FUEL MIXTURE
I t is well known that the lower and upper flammability l imit concentrations
of multicomponent fuel vapor mixture can be estimated approximately by Le Chate
l ie r ' s law. There are, however, hypothetical limiting conditions in Le Chate
l ie r ' s law as that each component in the vapor mixture has the same activationenergy, and each activation probability which is proportional to the concentrationhas the same proportional constant .For the liquid mixture, i t is very difficult to estimate the flash point because
the composition of vapor mixture above liquid surface varies with the liquidtemperature, although the flammable limit concentra tion of the equilibrium vapormixture above liquid pool at i ts certain temperature can be calculated by LeChatelier's law. On the other hand, for multicomponent liquid mixtures such askerosene and JP-4, i t has been suggested that the flash point is determined only
223

7/27/2019 1-217
http://slidepdf.com/reader/full/1-217 8/10
by very small concentartion of dissolved highly volatile component (10,21). Inthe present study, theoretical prediction of the flash point for the l iquid fuelmixture in which each component has largely different volatil i ty was tried.
Table 3 shows the fl ash point s, by Tag Closed Cup method, of the mixtures ofn-butanol and n-decane , and of n-hept.ane e- > n-dodecane with various mixing ratios,where the predicted flash points were determined by the partial vapor pressure ofthe most volatile component corresponding to the lower flammability limit concentration. I t was assumed that the flash phenomenon is ascribed only to the mostvolatile component. As shown in the results, the predicted flash points by suchthe assumption are not necessarily valid, except that the mixture dissolves highlyvolatile component compared with other ones.
The flash point of the binary mixture of liquid fue ls of the same kind, ofwhich vapor pressures are largely different, can be calculated theoretical ly asfollows, on the assumption that the liquid mixture is an ideal solution and thenRaoult's law can be applied.
1 ) (1 )
where, P is the inherent vapor pressure of the component, r is the mole fraction of the component in the liquid mixture, p is the partial vapor pressure ofthe component in the equil ibrium vapor mixture above liquid, and subscripts 1 and2 indicate the components 1 and 2 in the liquid mixture respectively.
Assuming that flash phenomenon is ascribed only to PI' the partial vaporpressure of the more volatile and flammable component is estimated by ClausiusClapeyron's law as follows, although the total equilibrium vapor pressure of the
liquid mixture is PI + P2'
-l(' 6 HIPI C exp (---
*Tl
For the temperature T of the liquid mixture,
* * * *PI = r lP
lat T = Tl
, PI = PI at T = Tl
+ 6T
(2)
*here, PI is the vapor pressure corresponding to the lower flammability limitconcentration, TI is the flash point of component 1, 6H
lis the latent heat of
vaporization, C lS the constant, R is the gas constant, 6T is the e leva tion offlash point due to the solubilization of less volatile component 2.
Consequently,
6 HI 6 HI *exp (-*
rl
C exp (-*
a t T Tl
+ 6T. (3 )
R\ R (Tl
+ 6T)
Therefore,
* ( - } - R )-1 . (4)1
+ 6T = + In rl
Tl
6Hl
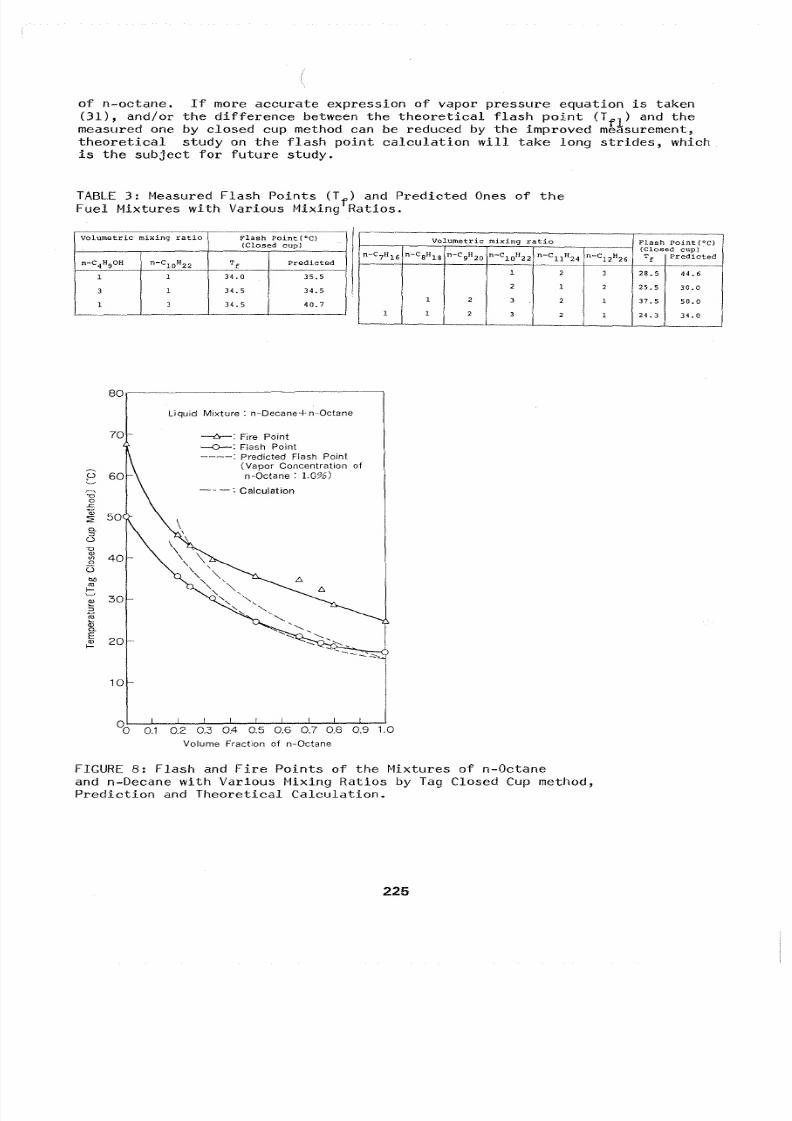
Fugure 8 shows the measured results of flash and fire points of the mixture
of n-octane and n-decane, the calcula ted f lash point is by the equation (4) wheren-octane is the component 1, and the predicted flash point is by the partialvapor pressure of n-octane corresponding to the lower flammability limit (1.0vol%) calculated by Raoult's law. As shown in these results, predicted flashpoint agrees well with the measured one i f the volume fraction of n-decane isbelow about 0.7, but the calcula ted flash point is reliable only at high fraction
224
7/27/2019 1-217
http://slidepdf.com/reader/full/1-217 9/10
of n-octane. If more accurate expression of vapor pressure equation is taken
(31), and/or the d if fe rence between the theoretical fla sh point (Tf l)
and th emeasured one by closed cup method can be reduced by the improved measurement,theoretical study on the flash point calculation will take long strides, which
is the subject for future study.
TABLE 3: Measured Flash Points (Tf)
and Predicted Ones of theFuel Mixtures with Various Mixing Ratios.
Volume tr i c mixing r a t io Flash Point(QC) I Volumetr ic mix ing ra t io Flash Poin t ( "c )(Closed cup)(Closed cup)
Predicted I n-C7U16 n-Cau l s n-C gH2 0
n-C1OH22
n- CU
U24
n-C12H26
Tf
Predic tedn-C
4HgOH n- C1OH22
Tf
1 1 l;0 35.5
I1 2 3 28.5 44.6
3 1 34.5 34.52 1 2 25.5 30.0
3 34.5 40.71 2 3 2 1 37.5 50.0
1
1 1 2 3 2 1 24.3 34.0
80
70
30
20
10
Liquid Mixture: n-Decane+n-Octane
- - -6 - : Fire Point
-0-: Flash PointPredicted Flash Point
(Vapor Concentration ofn-Ocfane : 1.0%)
- - - : Calculation
00 0.1 0.2 0.3 0.4 0.5 0.6 0.7 0.8 0.9 1.0
Volume Fraction of n-Octane
FIGURE 8: Flash and Fire Points of the Mixtures of n-Octane
and n-Decane with Various Mixing Ratios by Tag Closed Cup method,Prediction and Theoretical Calculation.
225

7/27/2019 1-217
http://slidepdf.com/reader/full/1-217 10/10
CONCLUDING REMARKS
Above the pool surface of some liquid hydrocarbon fuels filled in the opencup, with spark ignition source in a quiescent atmosphere, "Pre-flash" phenomenon
occurs at a l i t t le lower liquid temperature than the flash point. In pre-flashphenomenon, instantaneous faint but clear flamelet appears, and i t propagateslocally above pool surface,but is quenched on the way. Then, the scale of flameappearance above the liquid should be specified additionally in the usual methodsof flash point measurement. The prediction of flash point of multicomponentliquid mixture by the partial vapor pressure of the most volatile and flammablecomponent is not necessarily reliable, except the binary mixture. Comparing thecalcula ted f lash point of the binary hydrocarbon mixture by Clausius-Clapeyron's
and Raoult's laws with the measured one suggested that the more accurate analysisof vapor pressure and the improvement of measuring method of the flash point areneeded.
ACKNOWLEDGMENT
The authors express their sincere thanks to Mr. M. Kano for his great helpin conducting the experiment. The authors wish also to acknowledge the help ofdrawing figures by Mr. S. Aoyagi.
REFERENCES
1) J.H. Burgoyne and J.F. Richardson; Fuel, 28, 150 (1949).
2) J.H. Burgoyne and G. Williams-Leir; Fuel, 28, 145 (1949).3) J. B. Fenn; Ind. and Eng. Chemistry, 43, 2865 (1951).4) R.M. Butler, et al . ; Ind. and Eng. C h e m i s t r y , ~ , 808 (1956).5) W.A. Affens; J. of Chem. and Eng. Data, Jll, 197 (1966).6) J.H. Burgoyne, et al . ; J. of the Inst. of P e t r o l e u m , ~ , 338 (1967).
7) S.S.Penner and B.P. Mullins; Explosions, Detonations, Flammability and Ignition(AGARDograph NO.31, Pergamon Press, 1959), Part II .
8) M.G. Zabetakis;U.S. Bureau of Mines Blletine, NO.627 (1966).9) J.T. Dehn; Comb. and Flame, 24, 231 (1975).10) W.A. Affens and G.W. McLaren; J. of Chem. and Eng. Data, 12, 482 (1972).11) W.A. Affens, et al . ; J. of Fire and FlammabilitY,lL 141,152 (1977).12) G.L. Nelson and J.L. Webb; ibid., ~ 210 (1973).13) A.M. Kanury; Comb. Sci. & Tech., -1l, 297 (1983). 14) J.E. Anderson and M.W.Magyagi; ibid. , 21, 193 (1984). 15) K. Akita; Proc. of 14th Symp. on Comb.(Int'l)1075 (1972). 16) I . Glassman and F.L. Dryer; Fire Safety J . , ~ , 1 2 3 (1980/81).17) H. Ishida and A. Iwama; Comb. Sci. & Tech.,2§.., 51 (1984).
18) J.H. Burgoyne, et al . ; Proc.Roy.Soc., A308, 39, 55, 69 (1968).
19) A.F. Roberts and B.W. Quince; Comb. and Flame, ~ 245 (1973).20) A.F. Roberts; Proc. of 15th Symp. on Comb.(Int'l) 305 (1974).21) J.T. Bryant; Comb. Sci. & Tech., 10, 185 (1975).
22) M.M. EL-Wakil and M.I. Abdou; Fuel, i2, 177, 188, 199 (1966).23) G.S. Scott, et al . ; Analytical Chem., 20, 238 (1948).24) L. Delfosse, e t al . ; Comb. and Flame, 54, 203 (1983).
25) Z. Tamura and Y. Tanazawa; Proc. of 7th Symp. on Comb. (Int ' l ) , 509 (1958).26) W-J Yang; Inst.of Space & Aeronaut.Sci. Univ.of Tokyo Report, 535 (1975).27) I . Liebman, et al . ; Comb.Sci.& Tech., Jl, 257 (1970). 28) C.C. Feng, et al . ;
ibid.,..l.Q, 59 (1975). 29) M. Kaptain and C.E. Hermance; Proc.of16th Symp. onComb.(Int'l), 1295 (1976). 30) T. Hirano, et al . ; ibid., 1307 (1976).31) R.C. Reid, J.M. Prausnitz, T.K. Sherwood; The Properties of Gases and Liquids,
3rd ed., (McGraw-Hill, New York, 1977).
226