1. 2. - norfolkcommunityhealthandcare.nhs.uk · 44 of these relate to pressure ulcers acquired...
TRANSCRIPT

Quality Assurance & Risk Report Page 1 of 27
Date of Meeting 25th February Board Title of Report Quality Assurance & Risk Report – January 2015 activity Summary
This attached report was presented to the Quality & Risk Assurance Committee on 19 February 2015. The report provides a summary of the patient safety and quality indicators used by the Trust and external agencies to monitor the quality of care, patient experience and the management of risk. The report covers the incidents reported (not necessarily occurring) during the period 1 January to 31 January 2015. Information is given over time where available, to enable comparisons in reporting levels, improved analysis and identification of themes, trends and learning to improve the safety and quality of care delivery. Key areas to highlight in this month’s report are as follows:
1. PWC BAF & Risk Management internal audit 2. Care Quality Commission Compliance Action plan 3. Quality Goals – Quarter 3 report
Risks and benefits of proposed action
Recommendation
The Board are asked to receive the report
Presented by Dr Rosalyn Proops, Medical Director Previous consideration by Board Committee or EDT
Appendices 1) Quarter 3 - Quality Goals spreadsheet
2) Safe Staffing report (January Data)
Enclosure: H
Quality Assurance & Risk Report Page 2 of 27
Quality Assurance & Risk Report for January 2015
CONTENTS 1. PATIENT SAFETY 1.1 Serious Incidents Requiring Investigation (SIRIs) 1.2 Incidents reported during January 2015 1.3 Mortality Review 1.4 Quality Issue Reports (QIRs) 2. HARM FREE CARE 2.1 Safety Thermometer 2.2 Venous Thromboembolism (VTE) 2.3 Patient Falls 2.4 Pressure Ulcers 2.5 Infection Prevention and Control 3. PATIENT EXPERIENCE 3.1 Friends and Family Test summary 3.2 Complaints 3.3 Claims 3.4 Compliments 4. QUALITY GOALS 4.1 Quarter 3 summary 5. CARE QUALITY COMMISSION (CQC) 5.1 CQC compliance action plan update 6. RISK MANAGEMENT 6.1 Board Assurance Framework & Risk Management internal audit 6.2 Corporate Risk Register 6.3 Risks overdue review 6.4 action plan

Quality Assurance & Risk Report Page 3 of 27
1. PATIENT SAFETY 1.1 Serious Incidents Requiring Investigation (SIRI 1.1.1 New SIRIs 47 new serious incidents requiring investigation (SIRIs) were reported to the Commissioning Support Unit (CSU) during January 2015. Of these 27 were reported to CSU within 2 working days of the incident occurring and 20 outside of this timescale. 44 of these relate to pressure ulcers acquired within the care of NCH&C, 39 acquired while the patient was under the care of Integrated Community teams and 5 while the patient was under the care of an inpatient unit. The remaining 3 SIRIs reported were:-
• Fall resulting in fracture (Patient) (32615.2015) reported by Priscilla Bacon Lodge. Patient was mobilising with frame and fell.
• Fall resulting in fracture (Patient) (1037.2015) reported by Kelling hospital.
• Fall resulting in fracture (Patient) (2296.2015) reported by Kelling hospital. Patient was
been mobilising without frame and fell.
1.1.2 SIRI reporting trends The following graph shows the number of SIRIs reported to the CSU each month from February 2014 to January 2015
The following graph shows the type of SIRI (excluding pressure ulcers) reported from February 2014 to January 2015

Quality Assurance & Risk Report Page 4 of 27
1.1.3 3 day reports submitted to the Commissioning Support Unit (CSU) Forty, 3 day reports were submitted to the CSU in January 2015, 27 were submitted within agreed timescale and 13 submitted outside agreed timescales due to delays in reports being completed by the operational teams. 1.1.4 45 day RCA reports submitted to the CSU Twenty-seven (all related to pressure ulcers), 45 day reports were submitted to the CSU during January 2015, 26 were submitted within timescale and 1 outside of timescale due to a delay in the report being completed by the operational team. 1.1.5 Outstanding 45 day RCAs There are currently no RCAs overdue. 1.1.6 Pressure Ulcer Validation Group (PUVG) The PUVG continues to meet on a fortnightly basis to review PU RCAs and validate the avoidable/unavoidable decision. The PUVG also identifies learning points which will be included within the overarching Pressure Ulcer Action Plan. The action and learning points arising from the PUVG during January 2015 are:-
• Need to ensure that trained staff undertake first visit and undertake a full holistic assessment and patients are regularly reviewed by trained staff.
• Capacity within teams
1.1.7 Root Cause Analysis (RCA) – outcomes There were no non pressure ulcers RCAs submitted to the CSU during January 2015

Quality Assurance & Risk Report Page 5 of 27
1.1.8 Open SIRIs There are currently 111 open SIRIs, the table below shows the status of these SIRIs.
Pressure Ulcer SIRIs
All other SIRIs
Total
Investigation reports sent to CSU - awaiting feedback
47 1 48
With NCH&C – within timescale 59 4 53
With NCH&C - 45 day reports overdue
0 0 0
TOTAL 106 5 111
1.2 Incidents reported January 2015 1.2.1 The total number of incidents reported during January 2015 was 877 (of which 734 affected patients) The graph below details the number of incidents reported by each Locality / Directorate where the severity is moderate harm, severe harm or death. Of the 134 incidents, 130 affected patients.
Quality Assurance & Risk Report Page 6 of 27
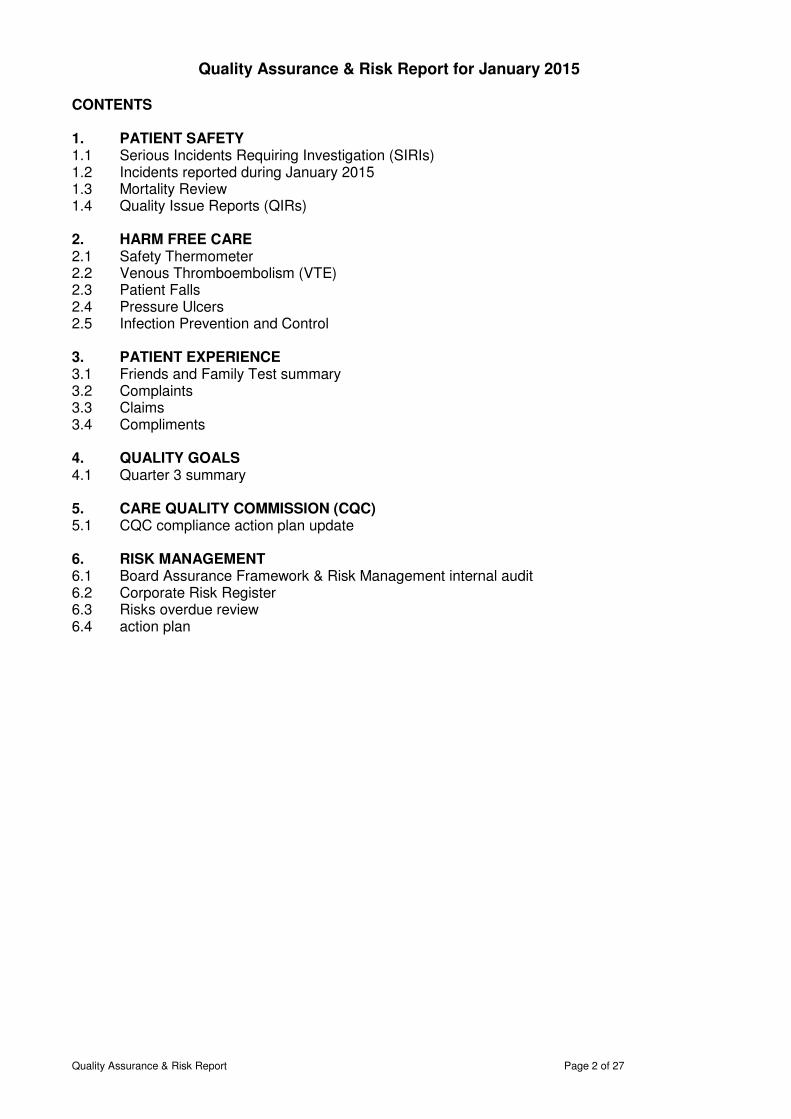
The following graph shows the number of moderate, severe and unexpected death
incidents reported from 1 February 2014 to 31 January 2015
The Integrated community nursing teams reported 492 incidents and the Inpatient units 251 incidents and continue to be the highest reporters. These are the areas where the highest numbers of contacts with patients are made. The top three incident reporting categories for each of these services within January 2015 are detailed below: Integrated Community Teams (ICT)
• Pressure Ulcers –292 incidents (59%)
• Communication / referral issues – 28 incidents (68%)
• Staffing incidents - 23 incidents (5%) Inpatient units
• Slips / Trips & Falls (patients) – 72 incidents (29%)
• Pressure Ulcers – 48 (19%)
• Staffing levels / skill mix – 17 incidents (7%) of which 3 were Inpatient - Safer Staffing Breach
Quality Assurance & Risk Report Page 7 of 27
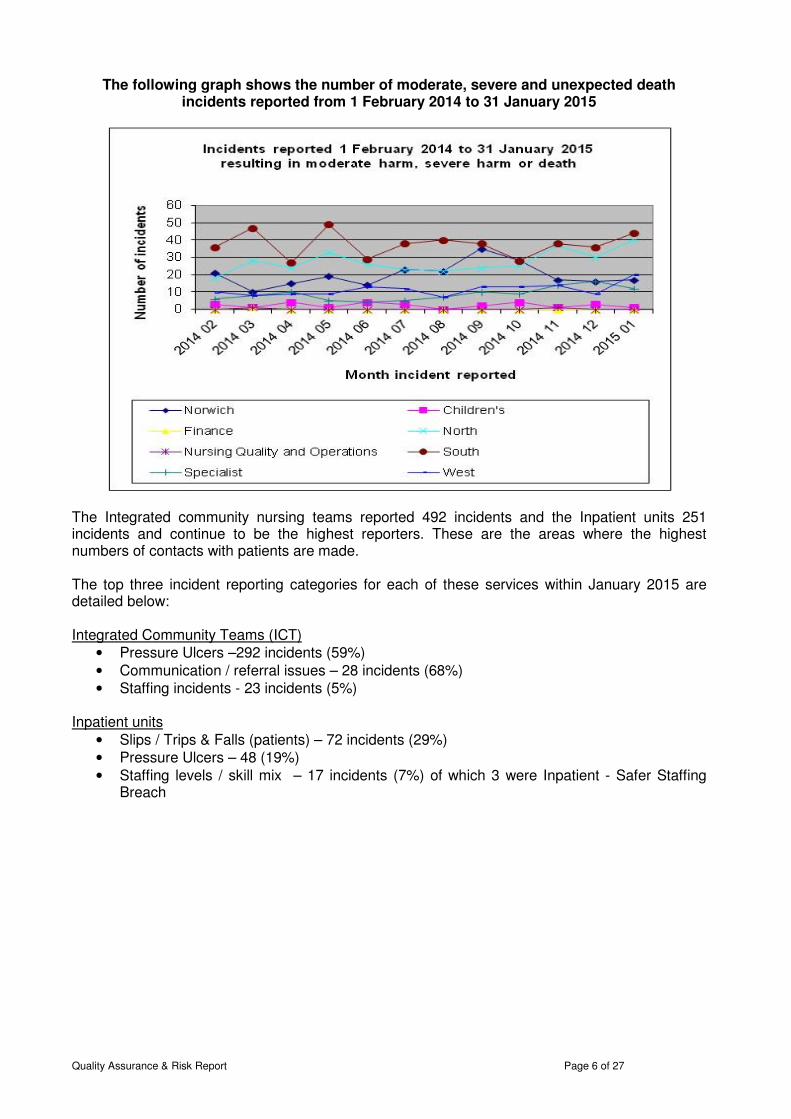
1.2.2 Incidents reported by Degree of Harm The graph below shows ALL incidents reported by degree of harm from 1 February 2014 to 31 January 2015
Moderate Harm incidents (NPSA definition: short term harm, patient(s) required further treatment or procedure)
125 (14%), incidents reported in January 2015 (122 of these affected patients) resulted in moderate harm, 84 of these incidents relate to Grade 3 Pressure Ulcers (42 acquired within the care of NCH&C and 42 acquired outside the care of NCH&C). All Grade 3 pressure ulcers acquired within the care of NCH&C are reported to CSU as SIRIs. 7 related to deterioration in the patients medical condition whilst the patient was within an inpatient setting and was subsequently returned to an acute hospital for further assessment / treatment. The remaining 34 incidents cover a wide range of incident types. Where a specific issue is identified, staff with additional expertise (e.g. Head of Medicines Management, Adult & Children Safeguarding leads, Health & Safety, Infection Control etc) are made aware of them and take appropriate action to support their local management. Themed incidents are also reported to the relevant committee e.g. Medicines Management, Information Governance. Severe harm incidents (NPSA definition: permanent or long term harm)
5 (less than 1%) incidents reported in January 2015 resulted in severe harm:-
o 3 x Grade 4 Pressure Ulcer acquired within the care of NCH&C, which will be reported and investigated through the SIRI process.
o 1 x patient fall which has been reported as a SIRI, please refer to section 1.1.1. o 1 x Adult Safeguarding – this incident is currently being reviewed to ascertain the actual
degree of harm of this incident and onward reporting requirements.
Unexpected Deaths There was one unexpected death reported by a community team within the West Locality in January 2015. The incident describes issues with a referral from an acute hospital and is currently being reviewed to ascertain the actual degree of harm resulting from this referral issue.
Quality Assurance & Risk Report Page 8 of 27
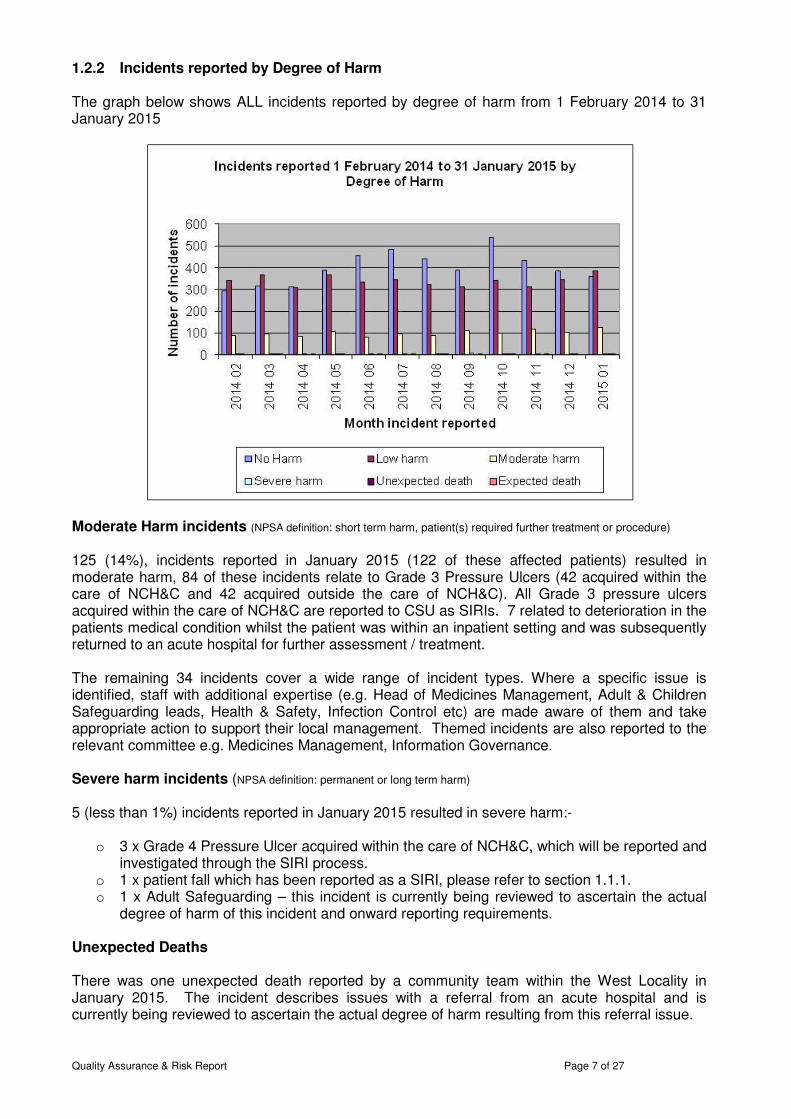
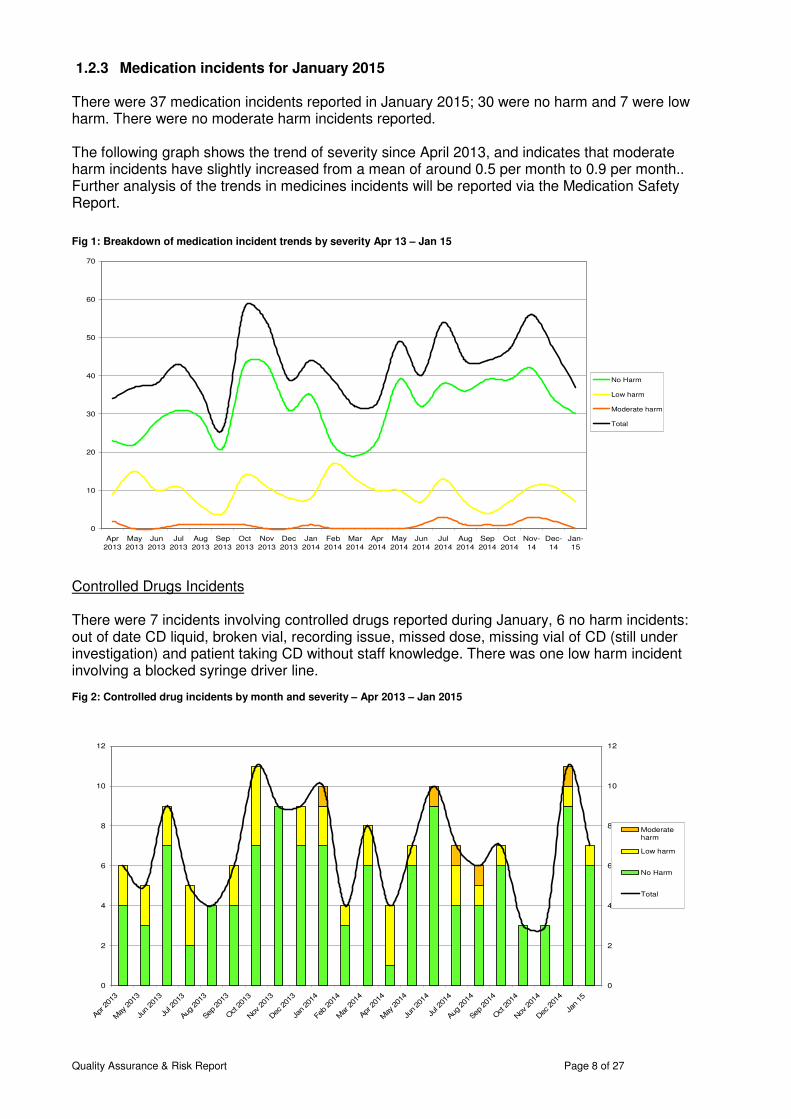
1.2.3 Medication incidents for January 2015 There were 37 medication incidents reported in January 2015; 30 were no harm and 7 were low harm. There were no moderate harm incidents reported. The following graph shows the trend of severity since April 2013, and indicates that moderate harm incidents have slightly increased from a mean of around 0.5 per month to 0.9 per month.. Further analysis of the trends in medicines incidents will be reported via the Medication Safety Report. Fig 1: Breakdown of medication incident trends by severity Apr 13 – Jan 15
Controlled Drugs Incidents There were 7 incidents involving controlled drugs reported during January, 6 no harm incidents: out of date CD liquid, broken vial, recording issue, missed dose, missing vial of CD (still under investigation) and patient taking CD without staff knowledge. There was one low harm incident involving a blocked syringe driver line. Fig 2: Controlled drug incidents by month and severity – Apr 2013 – Jan 2015
0
10
20
30
40
50
60
70
Apr
2013
May
2013
Jun
2013
Jul
2013
Aug
2013
Sep
2013
Oct
2013
Nov
2013
Dec
2013
Jan
2014
Feb
2014
Mar
2014
Apr
2014
May
2014
Jun
2014
Jul
2014
Aug
2014
Sep
2014
Oct
2014
Nov-
14
Dec-
14
Jan-
15
No Harm
Low harm
Moderate harm
Total
0
2
4
6
8
10
12
Apr
201
3
May
201
3
Jun 20
13
Jul 2
013
Aug
201
3
Sep
201
3
Oct 201
3
Nov
201
3
Dec
201
3
Jan 20
14
Feb 20
14
Mar
201
4
Apr
201
4
May
201
4
Jun 20
14
Jul 2
014
Aug
201
4
Sep
201
4
Oct 201
4
Nov
201
4
Dec
201
4
Jan 15
0
2
4
6
8
10
12
Moderateharm
Low harm
No Harm
Total

Quality Assurance & Risk Report Page 9 of 27
1.3 Mortality Reviews Deaths across each of the units for Q1, Q2 , Q3 for 2014 and January 2015 were as follows
2014/2015 Qtr 1 Qtr 2 Qtr 3 January Total
Hospital Measure All
Excl
Pall All Excl
Pall All
Excl
Pall All
Excl
Pall All
Excl
Pall
Discharges 78 71 71 65 92 86 31 31 272 253
Deaths 8 3 7 3 9 3 2 2 26 11
% Deaths 10.3% 4.2% 9.9% 4.6% 9.8% 3.5% 6.5% 6.5% 9.6% 4.3%
Discharges 66 55 47 41 64 54 16 13 193 163
Deaths 9 1 7 1 9 1 3 1 28 4
% Deaths 13.6% 1.8% 14.9% 2.4% 14.1% 1.9% 18.8% 7.7% 14.5% 2.5%
Discharges 40 36 52 46 50 46 20 18 162 146
Deaths 5 1 7 2 1 1 2 0 15 4
% Deaths 12.5% 2.8% 13.5% 4.3% 2.0% 2.2% 10.0% 0.0% 9.3% 2.7%
Discharges 88 82 83 74 76 71 27 27 274 254
Deaths 6 1 5 0 5 2 0 0 16 3
% Deaths 6.8% 1.2% 6.0% 0.0% 6.6% 2.8% 0.0% 0.0% 5.8% 1.2%
Discharges 109 104 92 87 116 105 26 24 343 320 Deaths 4 0 8 6 9 3 3 1 24 10
% Deaths 3.7% 0.0% 8.7% 6.9% 7.8% 2.9% 11.5% 4.2% 7.0% 3.1%
Discharges 81 69 76 70 77 66 19 14 253 219 Deaths 9 0 6 1 9 3 4 0 28 4
% Deaths 11.1% 0.0% 7.9% 1.4% 11.7% 4.5% 21.1% 0.0% 11.1% 1.8%
Discharges 52 44 65 56 56 50 22 18 195 168
Deaths 10 2 8 0 5 0 3 0 26 2
% Deaths 19.2% 4.5% 12.3% 0.0% 8.9% 0.0% 13.6% 0.0% 13.3% 1.2%
Discharges 95 89 48 45 91 83 21 19 255 236
Deaths 4 1 2 0 6 0 1 0 13 1
% Deaths 4.2% 1.1% 4.2% 0.0% 6.6% 0.0% 4.8% 0.0% 5.1% 0.4%
Discharges 67 67 64 64 75 75 21 21 227 227
Deaths 1 1 0 0 0 0 2 2 3 3
% Deaths 1.5% 1.5% 0.0% 0.0% 0.0% 0.0% 9.5% 9.5% 1.3% 1.3%
Discharges 22 22 15 15 15 15 6 6 58 58 Deaths 0 0 0 0 0 0 0 0 0 0
% Deaths 0.0% 0.0% 0.0% 0.0% 0.0% 0.0% 0.0% 0.0% 0.0% 0.0%
Discharges 0 0 0 0 0 0 0 0 0 0
Deaths 0 0 0 0 0 0 0 0 0 0
% Deaths 0.0% 0.0% 0.0% 0.0% 0.0% 0.0% 0.0% 0.0% 0.0% 0.0%
Discharges 34 34 26 26 37 37 10 10 107 107 Deaths 0 0 0 0 0 0 0 0 0 0
% Deaths 0.0% 0.0% 0.0% 0.0% 0.0% 0.0% 0.0% 0.0% 0.0% 0.0%
Discharges 80 0 64 0 90 0 25 0 259 0
Deaths 42 0 39 0 52 0 14 0 147 0
% Deaths 52.5% 0.0% 60.9% 0.0% 57.8% 0.0% 56.0% 0.0% 56.8% 0.0%
Discharges 812 673 703 589 839 688 244 201 2598 2151
Deaths 98 10 89 13 105 13 34 6 326 42
% Deaths 12.1% 1.5% 12.7% 2.2% 12.5% 1.9% 13.9% 3.0% 12.5% 2.0%
Discharges 732 673 639 589 749 688 219 201 2339 2151
Deaths 56 10 50 13 53 13 20 6 179 42
% Deaths 7.7% 1.5% 7.8% 2.2% 7.1% 1.9% 9.1% 3.0% 7.7% 2.0%
Total (excl PBC)
Cranmer House
Kelling
North Walsham
Priscilla Bacon
Centre
Pine Cottage
Swaffham
Alder Ward
Beech Ward
Total of ALL
Caroline House
Long Stay &
Respite
Ogden Court
Benjamin Court
Dereham
Caroline House
Quality Assurance & Risk Report Page 10 of 27
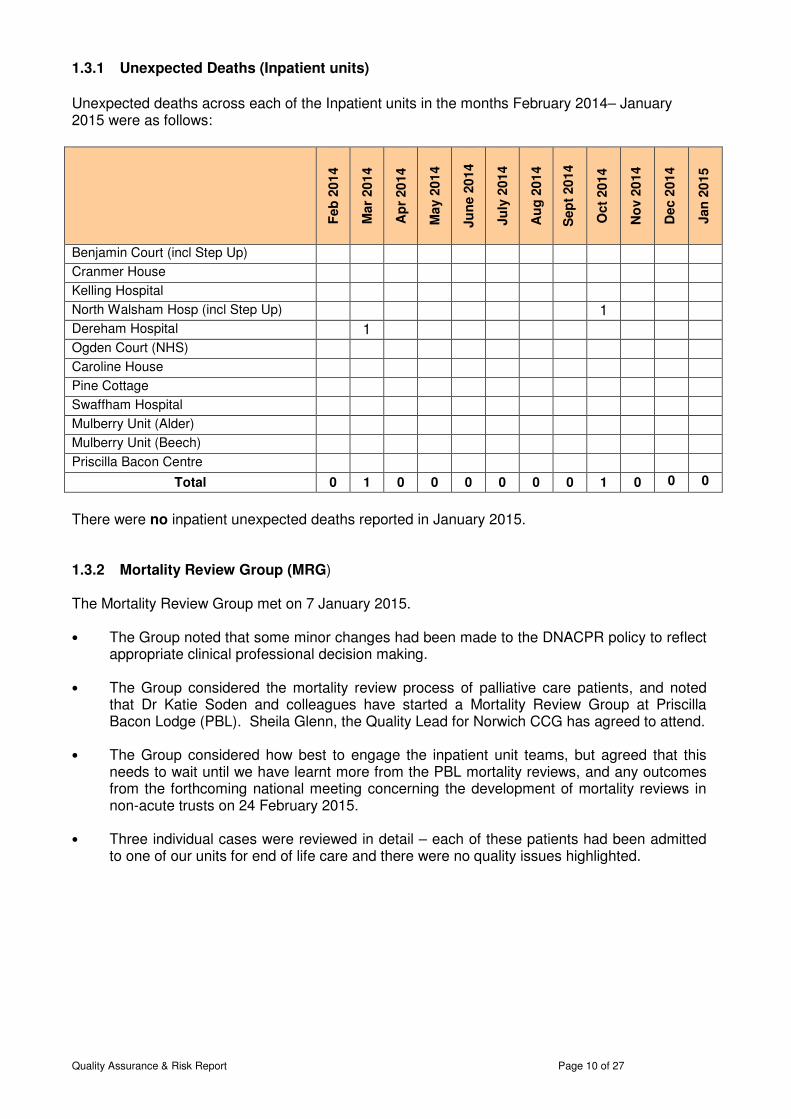
1.3.1 Unexpected Deaths (Inpatient units)
Unexpected deaths across each of the Inpatient units in the months February 2014– January 2015 were as follows:
Feb
201
4
Mar
201
4
Ap
r 20
14
May 2
01
4
Ju
ne 2
014
Ju
ly 2
014
Au
g 2
01
4
Sep
t 20
14
Oct
2014
No
v 2
014
Dec 2
014
Jan
20
15
Benjamin Court (incl Step Up) Cranmer House Kelling Hospital North Walsham Hosp (incl Step Up) 1 Dereham Hospital 1 Ogden Court (NHS) Caroline House Pine Cottage Swaffham Hospital Mulberry Unit (Alder) Mulberry Unit (Beech) Priscilla Bacon Centre
Total 0 1 0 0 0 0 0 0 1 0 0 0
There were no inpatient unexpected deaths reported in January 2015. 1.3.2 Mortality Review Group (MRG) The Mortality Review Group met on 7 January 2015. • The Group noted that some minor changes had been made to the DNACPR policy to reflect
appropriate clinical professional decision making. • The Group considered the mortality review process of palliative care patients, and noted
that Dr Katie Soden and colleagues have started a Mortality Review Group at Priscilla Bacon Lodge (PBL). Sheila Glenn, the Quality Lead for Norwich CCG has agreed to attend.
• The Group considered how best to engage the inpatient unit teams, but agreed that this
needs to wait until we have learnt more from the PBL mortality reviews, and any outcomes from the forthcoming national meeting concerning the development of mortality reviews in non-acute trusts on 24 February 2015.
• Three individual cases were reviewed in detail – each of these patients had been admitted
to one of our units for end of life care and there were no quality issues highlighted.

Quality Assurance & Risk Report Page 11 of 27
1.4 Quality Issue Reports (QIRs) The following 25 QIRs have been received from CSU during January 2015
No
rth
So
uth
West
Sp
ecia
list
No
rwic
h
To
tal
Hub services 3 1 4 Medication issue 1 1 Staffing issue 1 5 6 INR not carried out 1 1 2 Total 5 0 5 2 1 13
Each QIR is being investigated by the appropriate Locality, a response will be submitted to the CSU which includes any actions required to address these issues. The implementation of action plans will be monitored at locality governance meetings. Twenty-seven responses were submitted to CSU during January 2015, 14 within 25 day timescale and 13 outside the timescale. There are currently 12 QIRs where the response to CSU is overdue. The following graph shows the number of QIRs received from July 2014 to January 2015
During the month of January 2015, 13 QIRs were raised by NCH&C and submitted to CSU for investigation and feedback, responses will be shared with the teams who initially reported the incidents.
Locality - North
Locality - South
Locality - West
Total
Access, Admission, Transfer, Discharge 2 3 0 5
Clinical Assessment and Treatment 1 1 1 3
Equipment issues 1 0 0 1
Medication 2 0 0 2
Communication / Referrals 0 1 1 2
Totals: 6 5 2 13
Quality Assurance & Risk Report Page 12 of 27
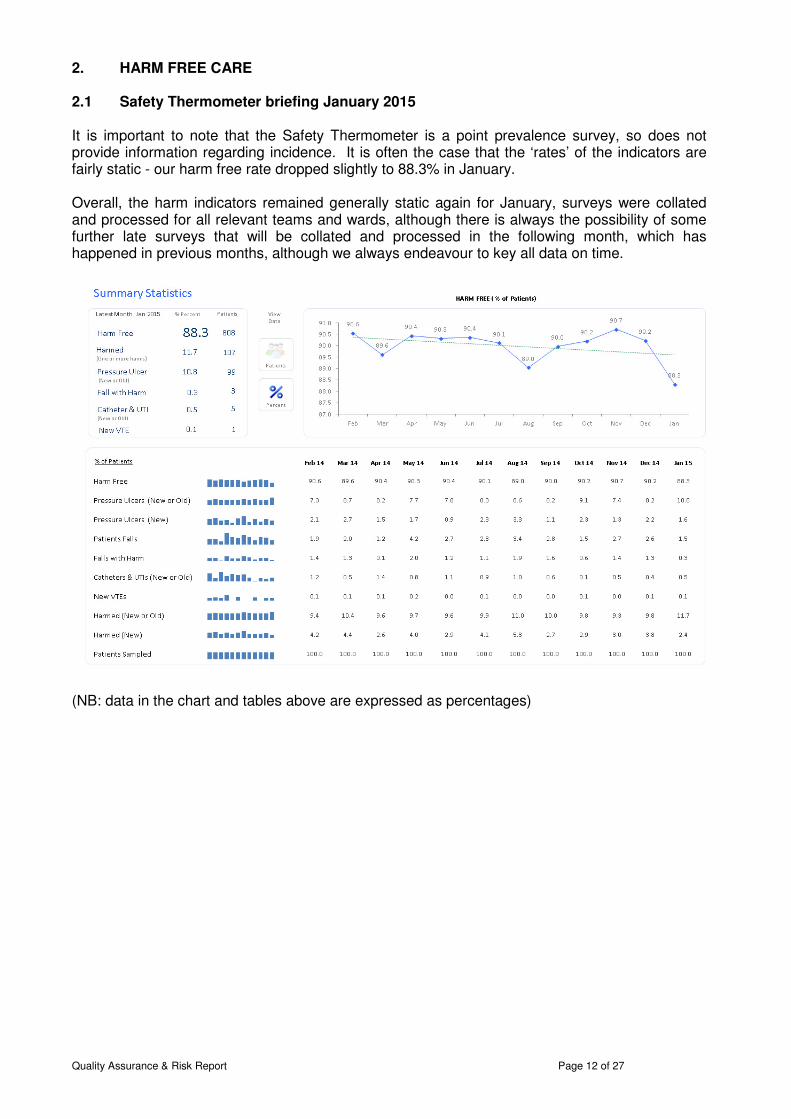
2. HARM FREE CARE 2.1 Safety Thermometer briefing January 2015 It is important to note that the Safety Thermometer is a point prevalence survey, so does not provide information regarding incidence. It is often the case that the ‘rates’ of the indicators are fairly static - our harm free rate dropped slightly to 88.3% in January. Overall, the harm indicators remained generally static again for January, surveys were collated and processed for all relevant teams and wards, although there is always the possibility of some further late surveys that will be collated and processed in the following month, which has happened in previous months, although we always endeavour to key all data on time.
(NB: data in the chart and tables above are expressed as percentages)
Quality Assurance & Risk Report Page 13 of 27
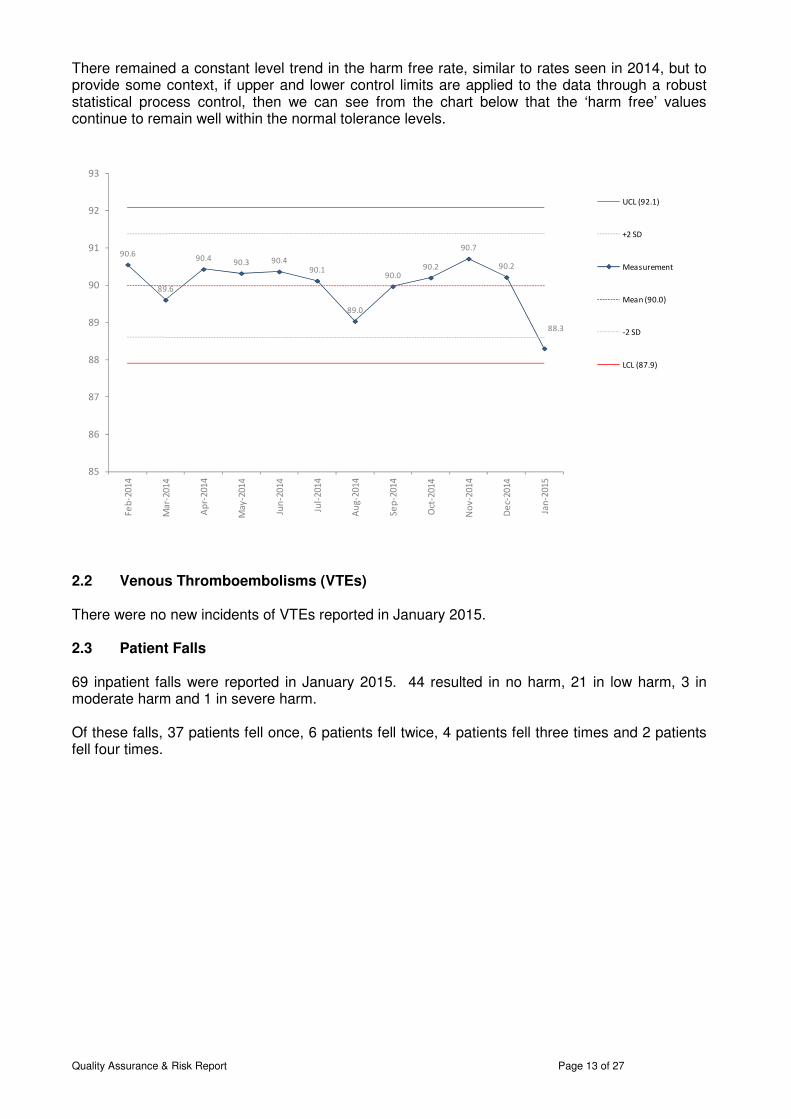
There remained a constant level trend in the harm free rate, similar to rates seen in 2014, but to provide some context, if upper and lower control limits are applied to the data through a robust statistical process control, then we can see from the chart below that the ‘harm free’ values continue to remain well within the normal tolerance levels.
2.2 Venous Thromboembolisms (VTEs) There were no new incidents of VTEs reported in January 2015. 2.3 Patient Falls 69 inpatient falls were reported in January 2015. 44 resulted in no harm, 21 in low harm, 3 in moderate harm and 1 in severe harm. Of these falls, 37 patients fell once, 6 patients fell twice, 4 patients fell three times and 2 patients fell four times.
90.6
89.6
90.490.3 90.4
90.1
89.0
90.090.2
90.7
90.2
88.3
85
86
87
88
89
90
91
92
93
Fe
b-2
01
4
Ma
r-2
01
4
Ap
r-2
01
4
Ma
y-2
01
4
Jun
-20
14
Jul-
20
14
Au
g-2
01
4
Se
p-2
01
4
Oct
-20
14
No
v-2
01
4
De
c-2
01
4
Jan
-20
15
UCL (92.1)
+2 SD
Measurement
Mean (90.0)
-2 SD
LCL (87.9)
Quality Assurance & Risk Report Page 14 of 27
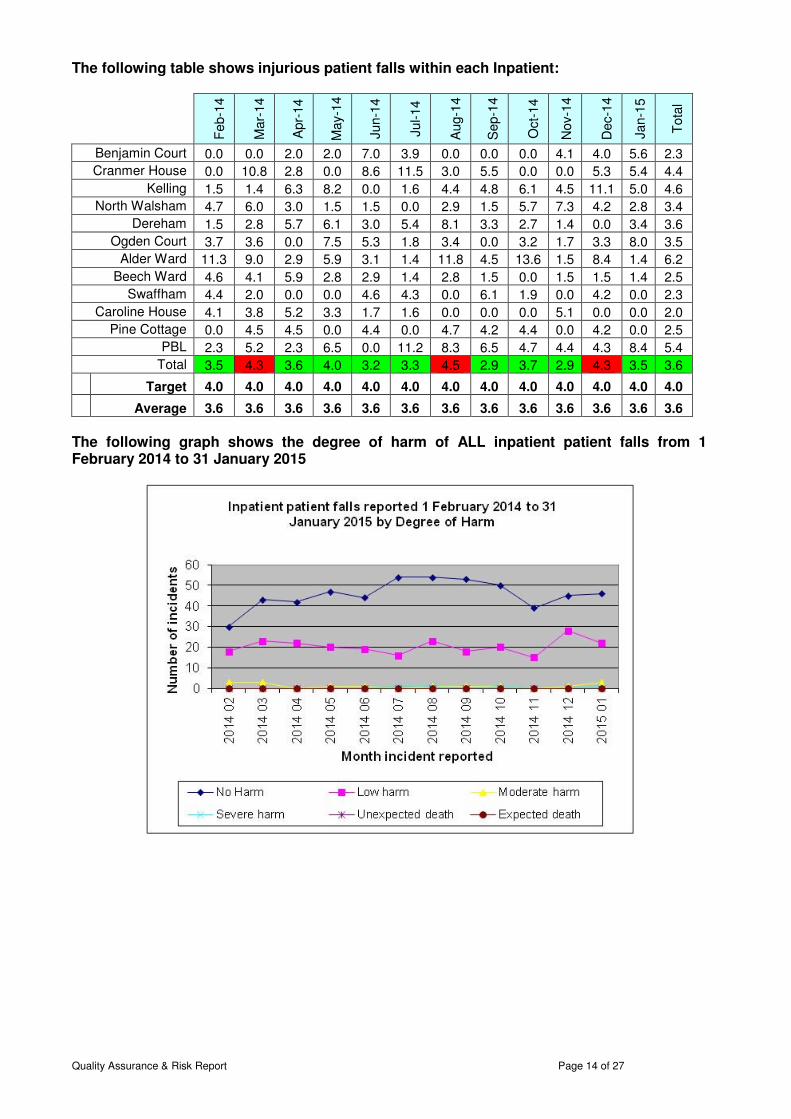
The following table shows injurious patient falls within each Inpatient:
Feb-1
4
Mar-
14
Apr-
14
May-1
4
Jun-1
4
Jul-14
Aug-1
4
Sep-1
4
Oct-
14
Nov-1
4
Dec-1
4
Jan-1
5
Tota
l
Benjamin Court 0.0 0.0 2.0 2.0 7.0 3.9 0.0 0.0 0.0 4.1 4.0 5.6 2.3
Cranmer House 0.0 10.8 2.8 0.0 8.6 11.5 3.0 5.5 0.0 0.0 5.3 5.4 4.4
Kelling 1.5 1.4 6.3 8.2 0.0 1.6 4.4 4.8 6.1 4.5 11.1 5.0 4.6
North Walsham 4.7 6.0 3.0 1.5 1.5 0.0 2.9 1.5 5.7 7.3 4.2 2.8 3.4
Dereham 1.5 2.8 5.7 6.1 3.0 5.4 8.1 3.3 2.7 1.4 0.0 3.4 3.6
Ogden Court 3.7 3.6 0.0 7.5 5.3 1.8 3.4 0.0 3.2 1.7 3.3 8.0 3.5
Alder Ward 11.3 9.0 2.9 5.9 3.1 1.4 11.8 4.5 13.6 1.5 8.4 1.4 6.2
Beech Ward 4.6 4.1 5.9 2.8 2.9 1.4 2.8 1.5 0.0 1.5 1.5 1.4 2.5
Swaffham 4.4 2.0 0.0 0.0 4.6 4.3 0.0 6.1 1.9 0.0 4.2 0.0 2.3
Caroline House 4.1 3.8 5.2 3.3 1.7 1.6 0.0 0.0 0.0 5.1 0.0 0.0 2.0
Pine Cottage 0.0 4.5 4.5 0.0 4.4 0.0 4.7 4.2 4.4 0.0 4.2 0.0 2.5
PBL 2.3 5.2 2.3 6.5 0.0 11.2 8.3 6.5 4.7 4.4 4.3 8.4 5.4
Total 3.5 4.3 3.6 4.0 3.2 3.3 4.5 2.9 3.7 2.9 4.3 3.5 3.6
Target 4.0 4.0 4.0 4.0 4.0 4.0 4.0 4.0 4.0 4.0 4.0 4.0 4.0
Average 3.6 3.6 3.6 3.6 3.6 3.6 3.6 3.6 3.6 3.6 3.6 3.6 3.6
The following graph shows the degree of harm of ALL inpatient patient falls from 1 February 2014 to 31 January 2015

Quality Assurance & Risk Report Page 15 of 27
The table below shows the number of patient injurious falls by 1,000 occupied bed days
2.4 Pressure Ulcers – (maintain zero avoidable within inpatients) The following table shows the number of avoidable Grade2, 3 & 4 pressure ulcers broken down by Inpatient / Community acquired. Breakdown of avoidable pressure ulcers (Grades 2, 3 and 4)
No
v-1
3
De
c-1
3
Jan
-14
Fe
b-1
4
Ma
r-1
4
Ap
r-1
4
Ma
y-1
4
Jun
-14
Jul
20
14
Au
g 1
4
Se
p
14
Oct
20
14
No
v 2
01
4
De
c 2
01
4
Jan
20
15
Inpatient 0 0 0 0 1 0 0 0 0 0 0 1* 0 1 0
Community - Patients
Home 1 7 6 11 7
5
7
4
5
5
4
2
5
3 2
Community - Residential
Home 10 3 12 8 8
5
8
3
3
6
4
3
2
6 4
Total 11 10 18 19 16 10 15 7 8 11 8 6 7 10 6
* Not yet validated The following tables shows the number of avoidable ulcers, broken down by grade of pressure ulcer
2013
11
2013
12
2014
01
2014
02
2014
03
2014
04
2014
05
2014
06
2014
07
2014
08
2014
09
2014
10
2014
11
2014
12
2015
01
Grade 2 5 6 10 15 10 6 12 5 4 4 3 2 1 5 14
Grade 3 3 4 8 4 6 4 3 2 4 7 4 3 6 4 4
Grade 4 3 0 0 0 0 0 0 0 0 0 1 1 0 1 1
Totals: 11 10 18 19 16 10 15 7 8 11 8 6 7 10 6
Quality Assurance & Risk Report Page 16 of 27
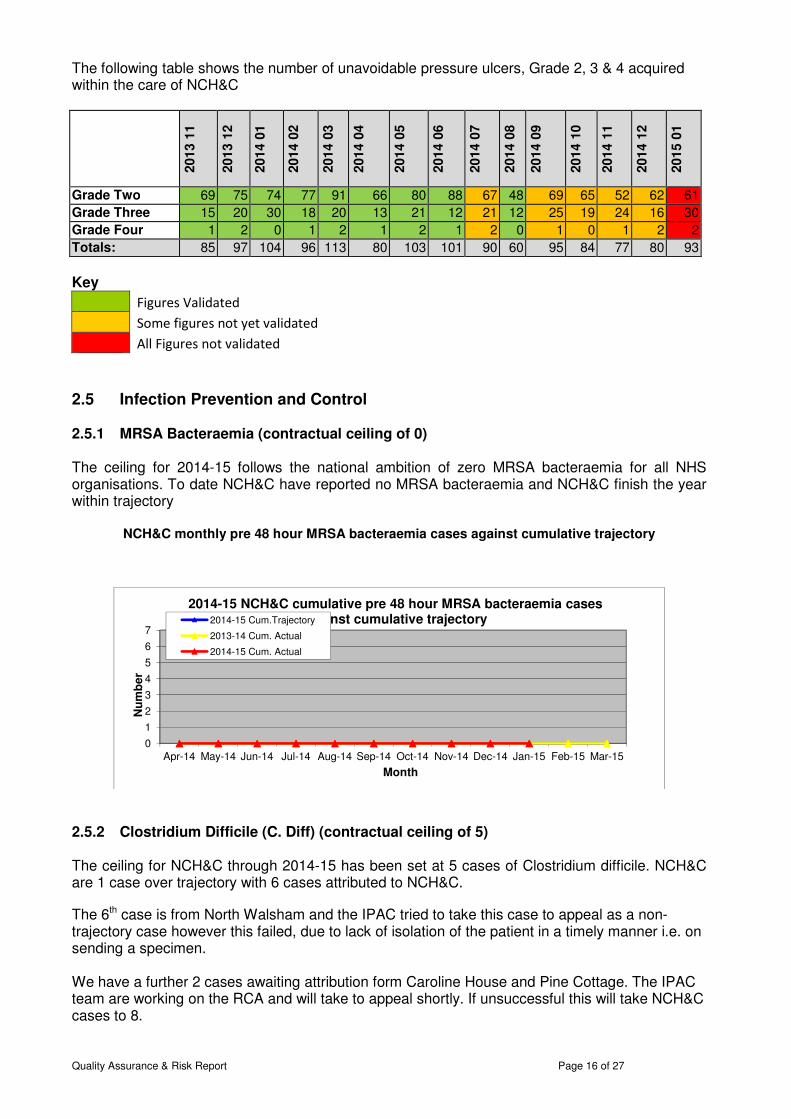
The following table shows the number of unavoidable pressure ulcers, Grade 2, 3 & 4 acquired within the care of NCH&C
2013
11
2013
12
2014
01
2014
02
2014
03
2014
04
2014
05
2014
06
2014
07
2014
08
2014
09
2014
10
2014
11
2014
12
2015
01
Grade Two 69 75 74 77 91 66 80 88 67 48 69 65 52 62 61
Grade Three 15 20 30 18 20 13 21 12 21 12 25 19 24 16 30
Grade Four 1 2 0 1 2 1 2 1 2 0 1 0 1 2 2
Totals: 85 97 104 96 113 80 103 101 90 60 95 84 77 80 93
Key
Figures Validated
Some figures not yet validated
All Figures not validated
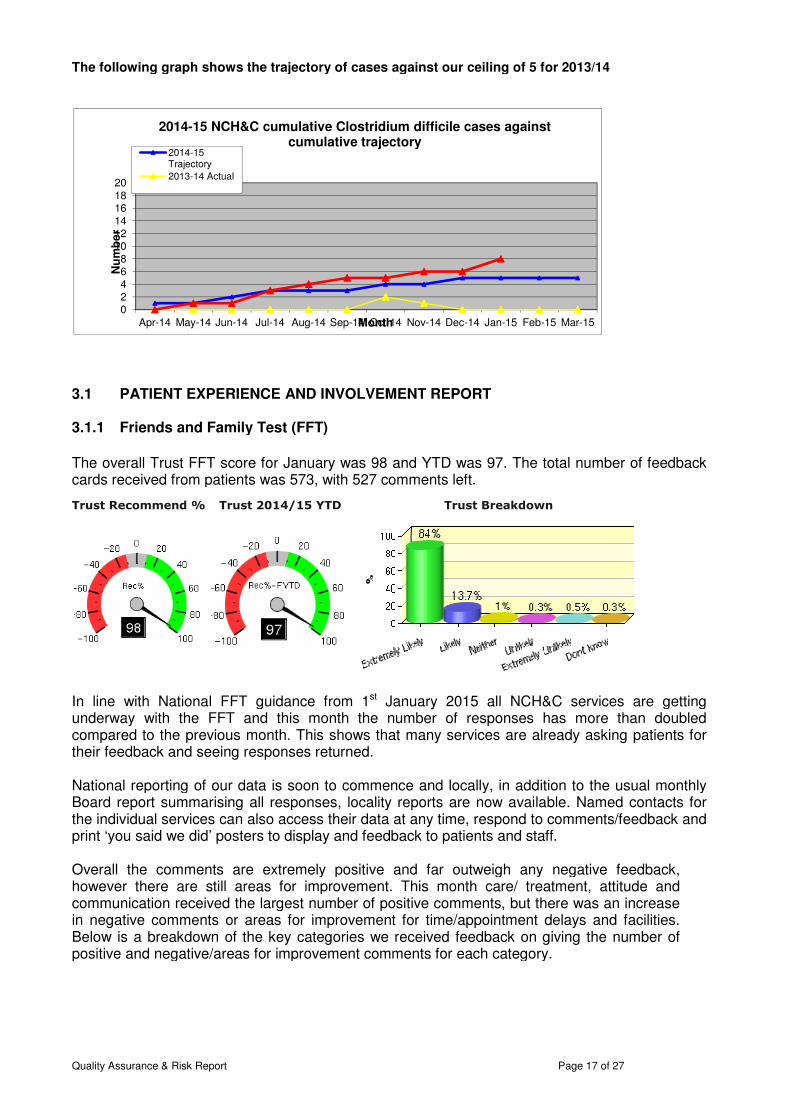
2.5 Infection Prevention and Control 2.5.1 MRSA Bacteraemia (contractual ceiling of 0) The ceiling for 2014-15 follows the national ambition of zero MRSA bacteraemia for all NHS organisations. To date NCH&C have reported no MRSA bacteraemia and NCH&C finish the year within trajectory
NCH&C monthly pre 48 hour MRSA bacteraemia cases against cumulative trajectory
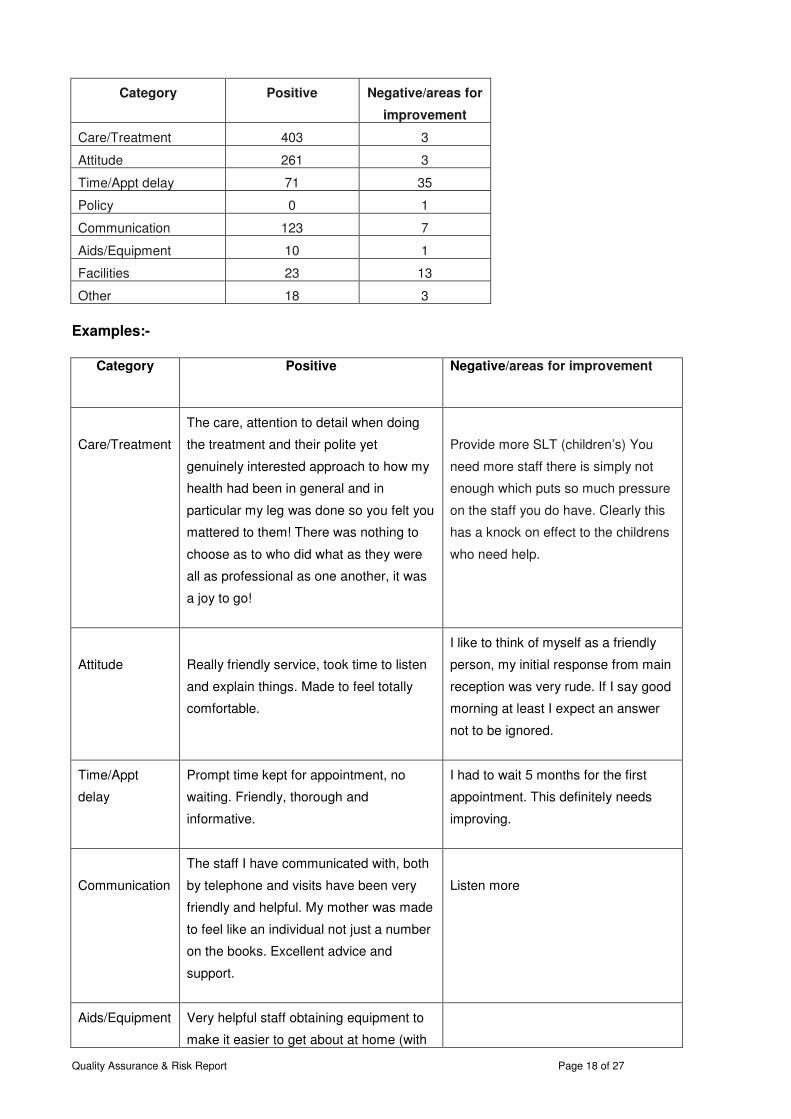
2.5.2 Clostridium Difficile (C. Diff) (contractual ceiling of 5) The ceiling for NCH&C through 2014-15 has been set at 5 cases of Clostridium difficile. NCH&C are 1 case over trajectory with 6 cases attributed to NCH&C.
The 6th case is from North Walsham and the IPAC tried to take this case to appeal as a non-trajectory case however this failed, due to lack of isolation of the patient in a timely manner i.e. on sending a specimen. We have a further 2 cases awaiting attribution form Caroline House and Pine Cottage. The IPAC team are working on the RCA and will take to appeal shortly. If unsuccessful this will take NCH&C cases to 8.
0
1
2
3
4
5
6
7
Apr-14 May-14 Jun-14 Jul-14 Aug-14 Sep-14 Oct-14 Nov-14 Dec-14 Jan-15 Feb-15 Mar-15
Nu
mb
er
Month
2014-15 NCH&C cumulative pre 48 hour MRSA bacteraemia cases against cumulative trajectory2014-15 Cum.Trajectory
2013-14 Cum. Actual
2014-15 Cum. Actual
Quality Assurance & Risk Report
The following graph shows the trajectory of cases again
3.1 PATIENT EXPERIENCE AND INVOLVEMENT REPORT 3.1.1 Friends and Family Test (FFT)
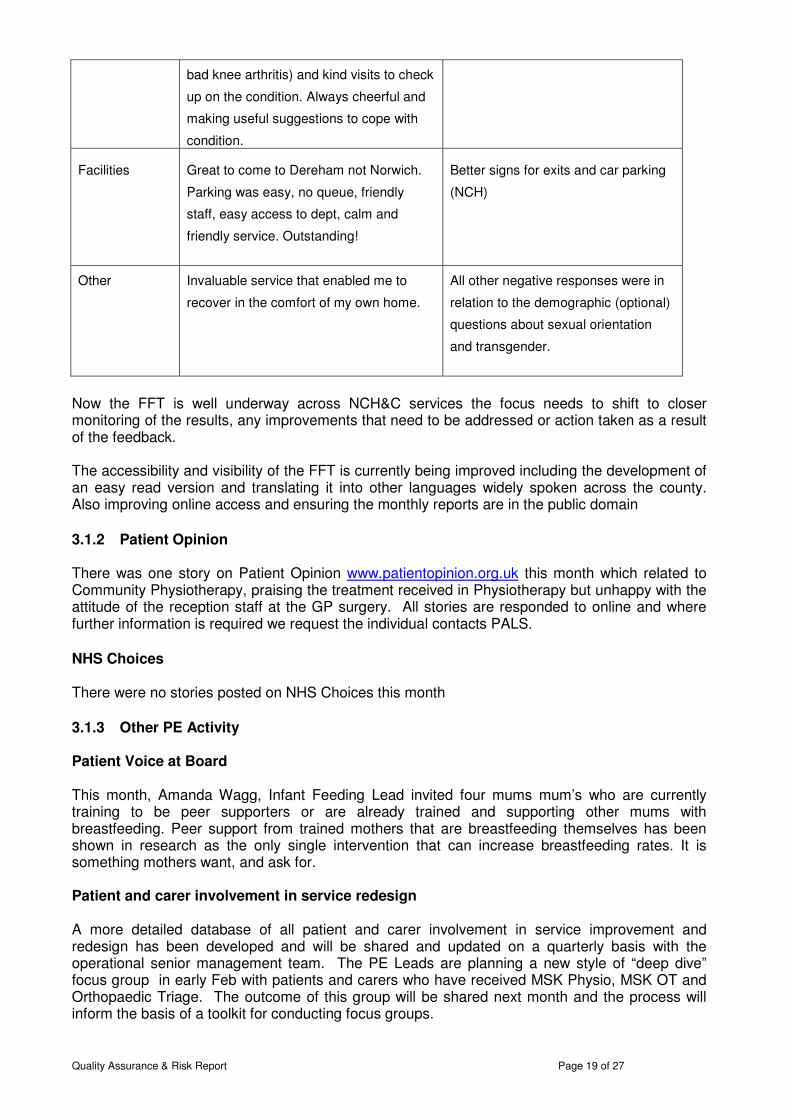
The overall Trust FFT score for January was 98 and YTD was 97. cards received from patients was 573, with 527 comments left.
Trust Recommend % Trust 2014/15 YTD
In line with National FFT guidance from 1underway with the FFT and this month the number of responses has more than doubled compared to the previous month. This shows that many services are already asking patients for their feedback and seeing responses returned. National reporting of our data is soon to commence and locally, in addition to the usual monthly Board report summarising all responses, locality reports are now available. Named contacts for the individual services can also access their data at any time, respond tprint ‘you said we did’ posters to display and feedback to patients and staff. Overall the comments are extremely positive and far outweigh any negative feedback, however there are still areas for improvement. This month care/ treacommunication received the largest number of positive comments, but there was an increase in negative comments or areas for improvement for time/appointment delays and facilities. Below is a breakdown of the key categories we received fpositive and negative/areas for improvement comments for each category.
02468
101214161820
Apr-14 May-14 Jun-14 Jul-14
Nu
mb
er
2014-15 NCH&C cumulative Clostridium difficile cases against
2014-15 Trajectory
2013-14 Actual
Page
The following graph shows the trajectory of cases against our ceiling of 5 for 2013/14
AND INVOLVEMENT REPORT
Friends and Family Test (FFT)
The overall Trust FFT score for January was 98 and YTD was 97. The total number of feedback cards received from patients was 573, with 527 comments left.
Trust 2014/15 YTD Trust Breakdown
In line with National FFT guidance from 1st January 2015 all NCH&C services are getting underway with the FFT and this month the number of responses has more than doubled compared to the previous month. This shows that many services are already asking patients for their feedback and seeing responses returned.
reporting of our data is soon to commence and locally, in addition to the usual monthly Board report summarising all responses, locality reports are now available. Named contacts for the individual services can also access their data at any time, respond to comments/feedback and print ‘you said we did’ posters to display and feedback to patients and staff.
Overall the comments are extremely positive and far outweigh any negative feedback, however there are still areas for improvement. This month care/ treatment, attitude and communication received the largest number of positive comments, but there was an increase in negative comments or areas for improvement for time/appointment delays and facilities. Below is a breakdown of the key categories we received feedback on giving the number of positive and negative/areas for improvement comments for each category.
Aug-14 Sep-14 Oct-14 Nov-14 Dec-14 Jan-15 Feb-15 MarMonth
15 NCH&C cumulative Clostridium difficile cases against cumulative trajectory
Page 17 of 27
st our ceiling of 5 for 2013/14
The total number of feedback
C services are getting underway with the FFT and this month the number of responses has more than doubled compared to the previous month. This shows that many services are already asking patients for
reporting of our data is soon to commence and locally, in addition to the usual monthly Board report summarising all responses, locality reports are now available. Named contacts for
o comments/feedback and
Overall the comments are extremely positive and far outweigh any negative feedback, tment, attitude and
communication received the largest number of positive comments, but there was an increase in negative comments or areas for improvement for time/appointment delays and facilities.
eedback on giving the number of
Mar-15
Quality Assurance & Risk Report Page 18 of 27
Category
Positive
Negative/areas for
improvement
Care/Treatment 403 3
Attitude 261 3
Time/Appt delay 71 35
Policy 0 1
Communication 123 7
Aids/Equipment 10 1
Facilities 23 13
Other 18 3
Examples:-
Category
Positive
Negative/areas for improvement
Care/Treatment
The care, attention to detail when doing
the treatment and their polite yet
genuinely interested approach to how my
health had been in general and in
particular my leg was done so you felt you
mattered to them! There was nothing to
choose as to who did what as they were
all as professional as one another, it was
a joy to go!
Provide more SLT (children’s) You
need more staff there is simply not
enough which puts so much pressure
on the staff you do have. Clearly this
has a knock on effect to the childrens
who need help.
Attitude
Really friendly service, took time to listen
and explain things. Made to feel totally
comfortable.
I like to think of myself as a friendly
person, my initial response from main
reception was very rude. If I say good
morning at least I expect an answer
not to be ignored.
Time/Appt
delay
Prompt time kept for appointment, no
waiting. Friendly, thorough and
informative.
I had to wait 5 months for the first
appointment. This definitely needs
improving.
Communication
The staff I have communicated with, both
by telephone and visits have been very
friendly and helpful. My mother was made
to feel like an individual not just a number
on the books. Excellent advice and
support.
Listen more
Aids/Equipment
Very helpful staff obtaining equipment to
make it easier to get about at home (with
Quality Assurance & Risk Report Page 19 of 27
bad knee arthritis) and kind visits to check
up on the condition. Always cheerful and
making useful suggestions to cope with
condition.
Facilities
Great to come to Dereham not Norwich.
Parking was easy, no queue, friendly
staff, easy access to dept, calm and
friendly service. Outstanding!
Better signs for exits and car parking
(NCH)
Other
Invaluable service that enabled me to
recover in the comfort of my own home.
All other negative responses were in
relation to the demographic (optional)
questions about sexual orientation
and transgender.
Now the FFT is well underway across NCH&C services the focus needs to shift to closer monitoring of the results, any improvements that need to be addressed or action taken as a result of the feedback. The accessibility and visibility of the FFT is currently being improved including the development of an easy read version and translating it into other languages widely spoken across the county. Also improving online access and ensuring the monthly reports are in the public domain
3.1.2 Patient Opinion There was one story on Patient Opinion www.patientopinion.org.uk this month which related to Community Physiotherapy, praising the treatment received in Physiotherapy but unhappy with the attitude of the reception staff at the GP surgery. All stories are responded to online and where further information is required we request the individual contacts PALS.
NHS Choices There were no stories posted on NHS Choices this month
3.1.3 Other PE Activity Patient Voice at Board This month, Amanda Wagg, Infant Feeding Lead invited four mums mum’s who are currently training to be peer supporters or are already trained and supporting other mums with breastfeeding. Peer support from trained mothers that are breastfeeding themselves has been shown in research as the only single intervention that can increase breastfeeding rates. It is something mothers want, and ask for. Patient and carer involvement in service redesign A more detailed database of all patient and carer involvement in service improvement and redesign has been developed and will be shared and updated on a quarterly basis with the operational senior management team. The PE Leads are planning a new style of “deep dive” focus group in early Feb with patients and carers who have received MSK Physio, MSK OT and Orthopaedic Triage. The outcome of this group will be shared next month and the process will inform the basis of a toolkit for conducting focus groups.

Quality Assurance & Risk Report Page 20 of 27
3.1.4 PALS
The Patient Experience team manage all PALS enquiries via telephone, email, comment form and web. In summary for the month of January PALS received 2 comments, 8 concerns, 8 complaints received initially in PALS and transferred to Complaints Officer, 122 compliments and 35 guidance related enquiries (171 ‘contacts’) Concerns The concerns received this month included the following:-
• A patient finding it difficult to choose the correct PALS on the internet, as so many options for PALS came up. (i.e. NNUH PALS etc ) People do not always seem to understand there is more than one PALS and this can be confusing for them.
• Signage at Kelling Hospital was felt to be inadequate (no sign pointing to the clinic reported) however the service they felt was good
• A concern through Norman Lamb (he had received a letter from a constituent) regarding volunteer driving expenses being reduced.
• Data sharing between district nurse and care homes was raised as a concern as the care home felt relevant information was not being shared with them and felt this impacted on patient care
• A discrepancy with payment for a care home bill for one week stay which the family thought was for “admission avoidance”
• Communication about the transfer of a patient from NNUH to Foxley ward at Dereham Hospital
• The temperature in a patient’s room. This was dealt with on the day by estates Guidance The guidance included appointment enquiries – this has been a theme and we have spoken to central booking about providing an email address or having an answer phone that patients can call out of hours/be able to leave a message. Central Booking have an email address but it is not widely published. A number of our enquiries include requests for various numbers such as dental or childcare groups etc. Many guidance enquiries received in PALS are unrelated to any NCH&C service but information is given for other NHS Trust PALS, NHS England or other organisations
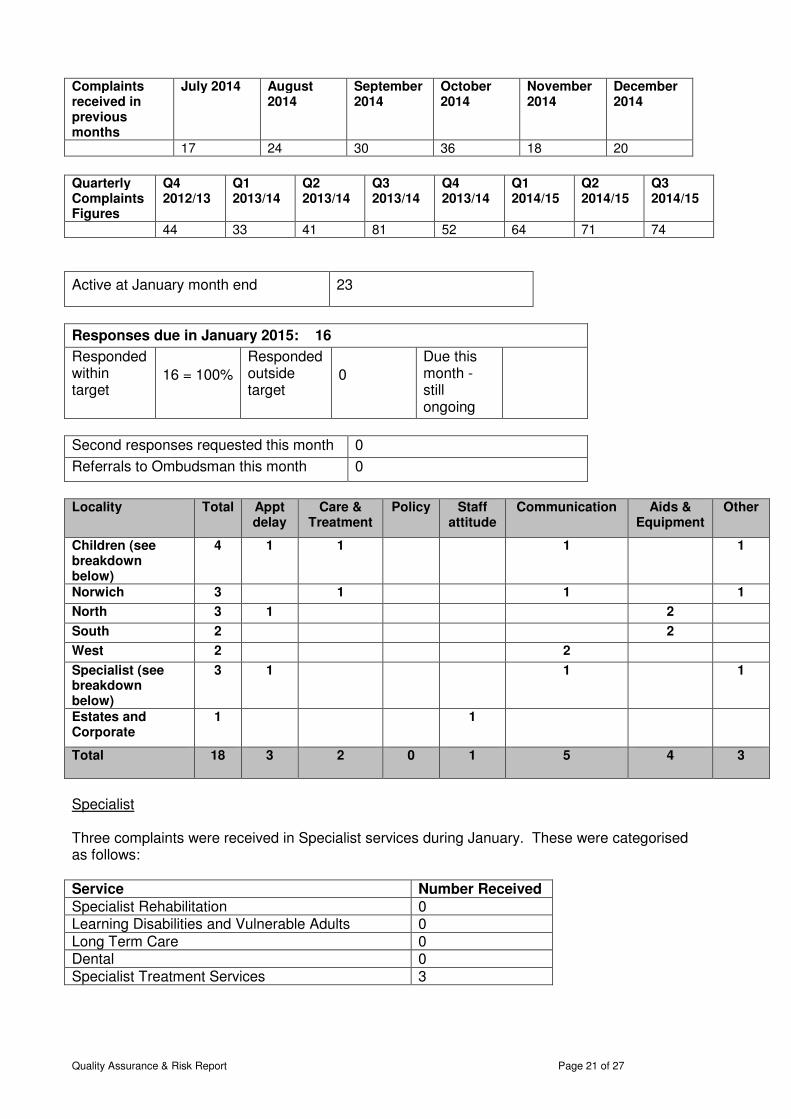
3.2 Complaints and Claims – January 2015 Key performance indicators
• 18 complaints were received during January 2015
• 100% of complaints received this month were acknowledged within 3 days.
• 100% of complaint responses due in November met the 25-day target.
• No complaints were received about the complaint process.
Changes to the type of continence products used by the Trust have recently been made, and four of the complaints were related to the continence service this month, spread across the North, Norwich and South localities. No other themes emerged.
Quality Assurance & Risk Report Page 21 of 27
Complaints received in previous months
July 2014 August 2014
September 2014
October 2014
November 2014
December 2014
17 24 30 36 18 20
Quarterly Complaints Figures
Q4 2012/13
Q1 2013/14
Q2 2013/14
Q3 2013/14
Q4 2013/14
Q1 2014/15
Q2 2014/15
Q3 2014/15
44 33 41 81 52 64 71 74
Active at January month end 23
Responses due in January 2015: 16
Responded within target
16 = 100%
Responded outside target
0
Due this month - still ongoing
Second responses requested this month 0
Referrals to Ombudsman this month 0
Locality Total Appt
delay Care &
Treatment Policy Staff
attitude Communication Aids &
Equipment Other
Children (see breakdown below)
4 1 1 1 1
Norwich 3 1 1 1
North 3 1 2
South 2 2
West 2 2
Specialist (see breakdown below)
3 1 1 1
Estates and Corporate
1 1
Total
18 3 2 0 1 5 4 3
Specialist Three complaints were received in Specialist services during January. These were categorised as follows: Service Number Received
Specialist Rehabilitation 0 Learning Disabilities and Vulnerable Adults 0 Long Term Care 0 Dental 0 Specialist Treatment Services 3

Quality Assurance & Risk Report Page 22 of 27
Childrens Four complaints were received in Children’s services during January. These were sub-divided as follows: Service Number Received
Disability and Specialist Health Pathway 4 Healthy Child Pathway 0 Example of Complaint Comments for January (these are intended to give a flavour of a sample of complaints received this month)
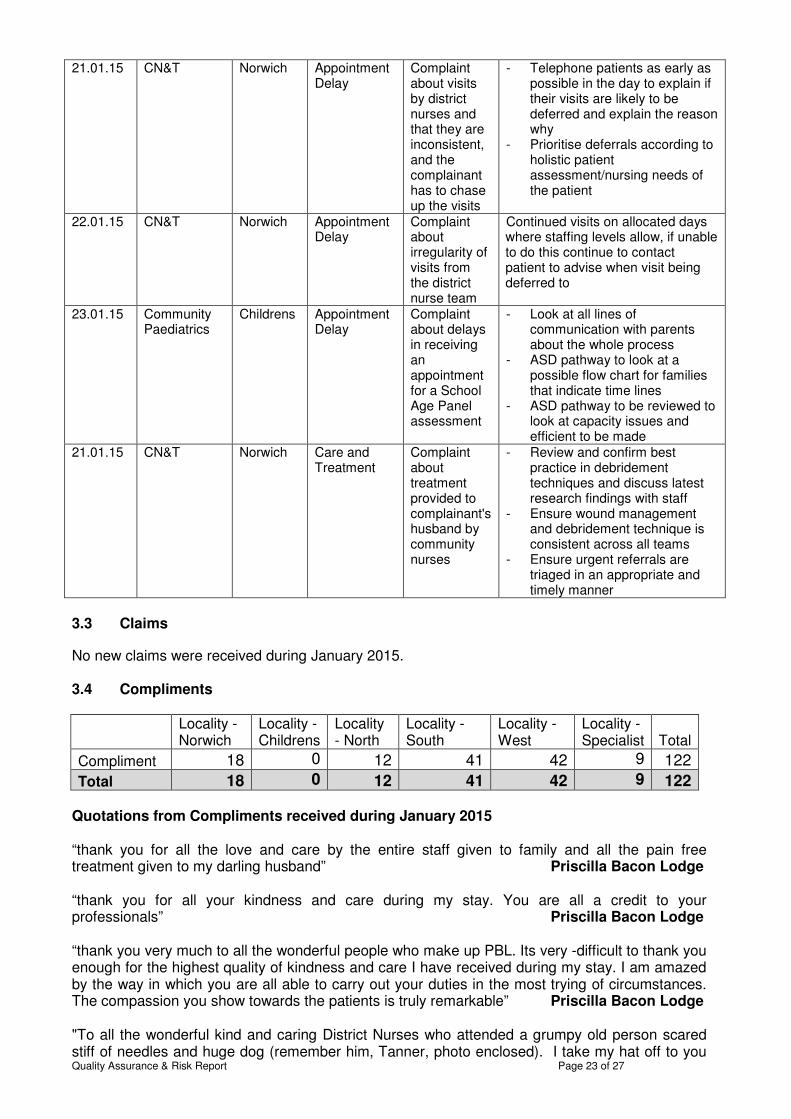
We depend so very much on the services provided by District Nurses – who I might add are absolutely marvellous. I am writing to complain about the system at operational level. Why is the same nurse not allocated to visit us every day? Why does the nurse not have an allocated area so they are not all over the place during the course of a shift? Norwich / CN&T I am writing to express my extreme displeasure with your decision to change supplier to ID since starting to use these new nappies, X has experienced two embarrassing episodes when out and about (and many more indoors) as the nappies leaked - this did not happen with the previous supplier. North / Continence I have been trying so hard to get some support/help/therapy for my child since 2009. I keep being passed from pillar to post and attending initial assessments that are getting us no where I am now on yet another waiting list for the Complex Communication Disorder Team”. Childrens Services Learnings received during January (these relate to complaints received during the preceding months) Date rec’d
Service Locality Complaint Category
Summary of Complaint
Learning
05.01.15 Health Visiting
Childrens Communication
Complaint about letter received from health visitors by his wife
- Messages from the HV answering machine to be recorded in the message book
- The duty HV to action immediately
- The antenatal sheet is removed from the antenatal book and placed in the allocated HV box clearly marked
15.01.15 School Nursing
Childrens Communication
Complaint about dealings with the school nursing team
- Importance of keeping equipment calibrated
- Working party set up to review systems and processes
19.01.15 CN&T Norwich Appointment Delay
Complaint about delay in visit from nurse once blocked catheter reported
- SOP being written to clarify the process for handover of information between the day nursing team and the out of hours nursing teams
- Ensure that all hub staff are aware of the 4 hour admission avoidance target and the importance of prioritising and allocating visits in a timely manner
- Staff are encouraged to check their ledgers after each patient in case of any changes
Quality Assurance & Risk Report Page 23 of 27
21.01.15 CN&T Norwich Appointment Delay
Complaint about visits by district nurses and that they are inconsistent, and the complainant has to chase up the visits
- Telephone patients as early as possible in the day to explain if their visits are likely to be deferred and explain the reason why
- Prioritise deferrals according to holistic patient assessment/nursing needs of the patient
22.01.15 CN&T Norwich Appointment Delay
Complaint about irregularity of visits from the district nurse team
Continued visits on allocated days where staffing levels allow, if unable to do this continue to contact patient to advise when visit being deferred to
23.01.15 Community Paediatrics
Childrens Appointment Delay
Complaint about delays in receiving an appointment for a School Age Panel assessment
- Look at all lines of communication with parents about the whole process
- ASD pathway to look at a possible flow chart for families that indicate time lines
- ASD pathway to be reviewed to look at capacity issues and efficient to be made
21.01.15 CN&T Norwich Care and Treatment
Complaint about treatment provided to complainant's husband by community nurses
- Review and confirm best practice in debridement techniques and discuss latest research findings with staff
- Ensure wound management and debridement technique is consistent across all teams
- Ensure urgent referrals are triaged in an appropriate and timely manner
3.3 Claims
No new claims were received during January 2015. 3.4 Compliments
Locality - Norwich
Locality - Childrens
Locality - North
Locality - South
Locality - West
Locality - Specialist Total
Compliment 18 0 12 41 42 9 122
Total 18 0 12 41 42 9 122 Quotations from Compliments received during January 2015 “thank you for all the love and care by the entire staff given to family and all the pain free treatment given to my darling husband” Priscilla Bacon Lodge “thank you for all your kindness and care during my stay. You are all a credit to your professionals” Priscilla Bacon Lodge “thank you very much to all the wonderful people who make up PBL. Its very -difficult to thank you enough for the highest quality of kindness and care I have received during my stay. I am amazed by the way in which you are all able to carry out your duties in the most trying of circumstances. The compassion you show towards the patients is truly remarkable” Priscilla Bacon Lodge "To all the wonderful kind and caring District Nurses who attended a grumpy old person scared stiff of needles and huge dog (remember him, Tanner, photo enclosed). I take my hat off to you
Quality Assurance & Risk Report Page 24 of 27
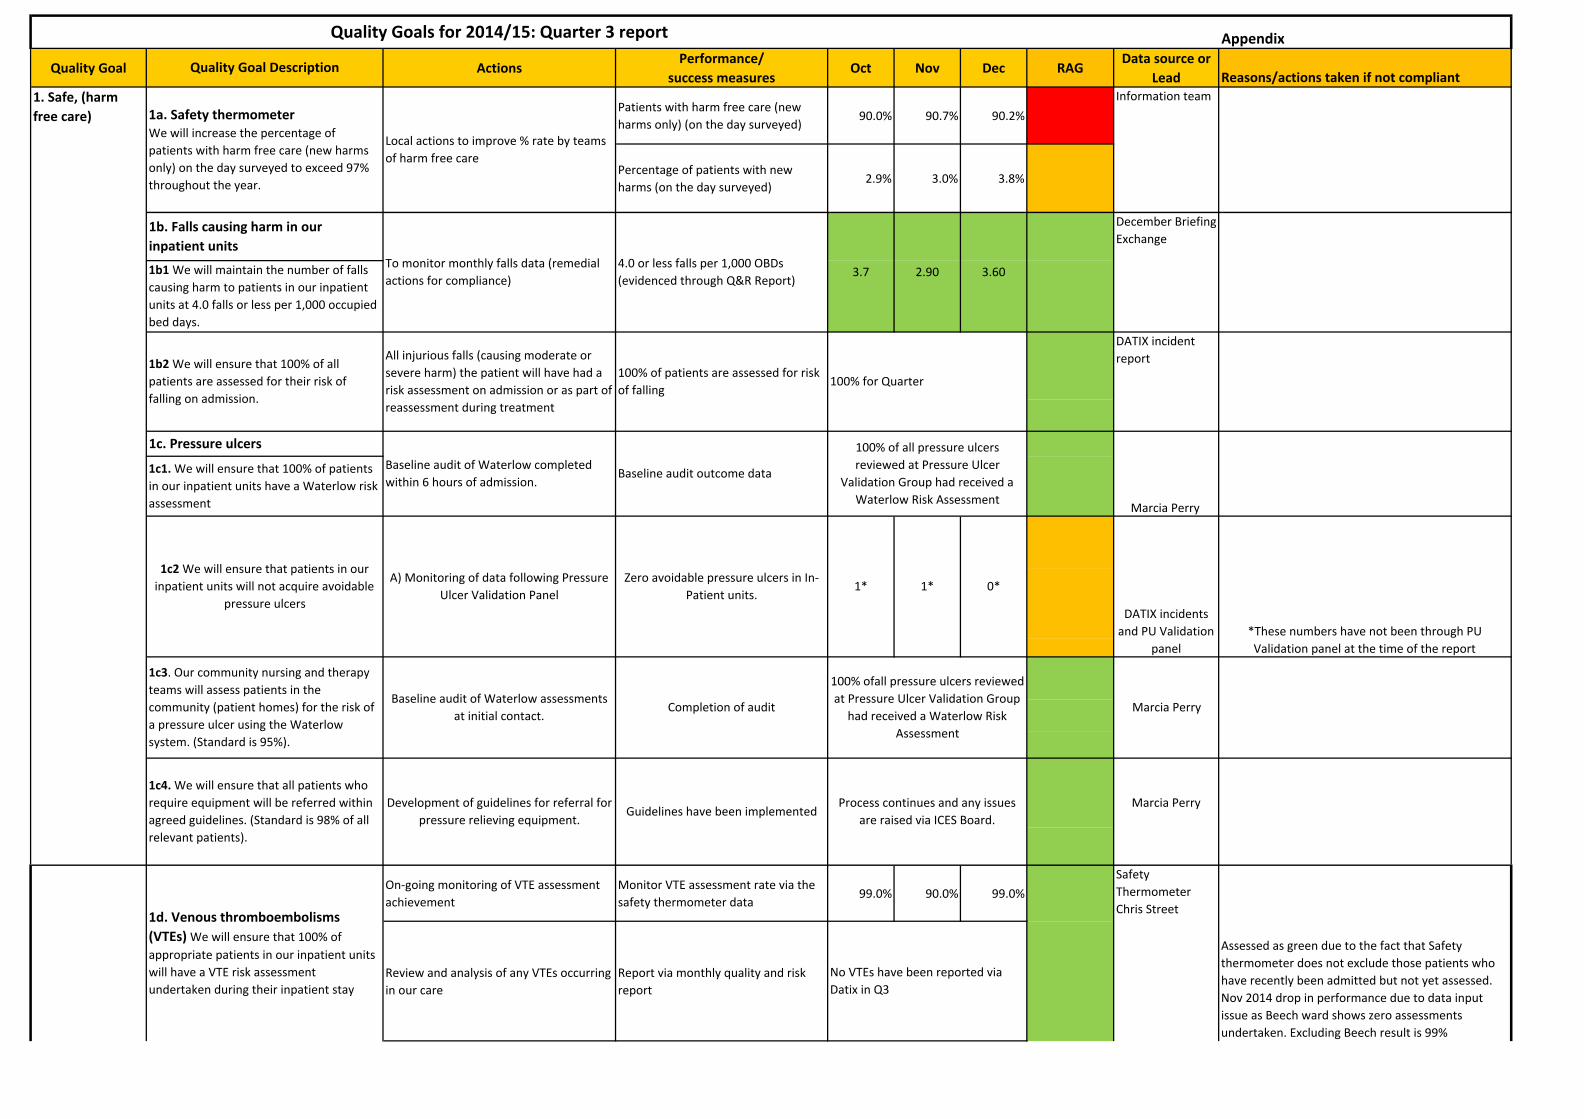
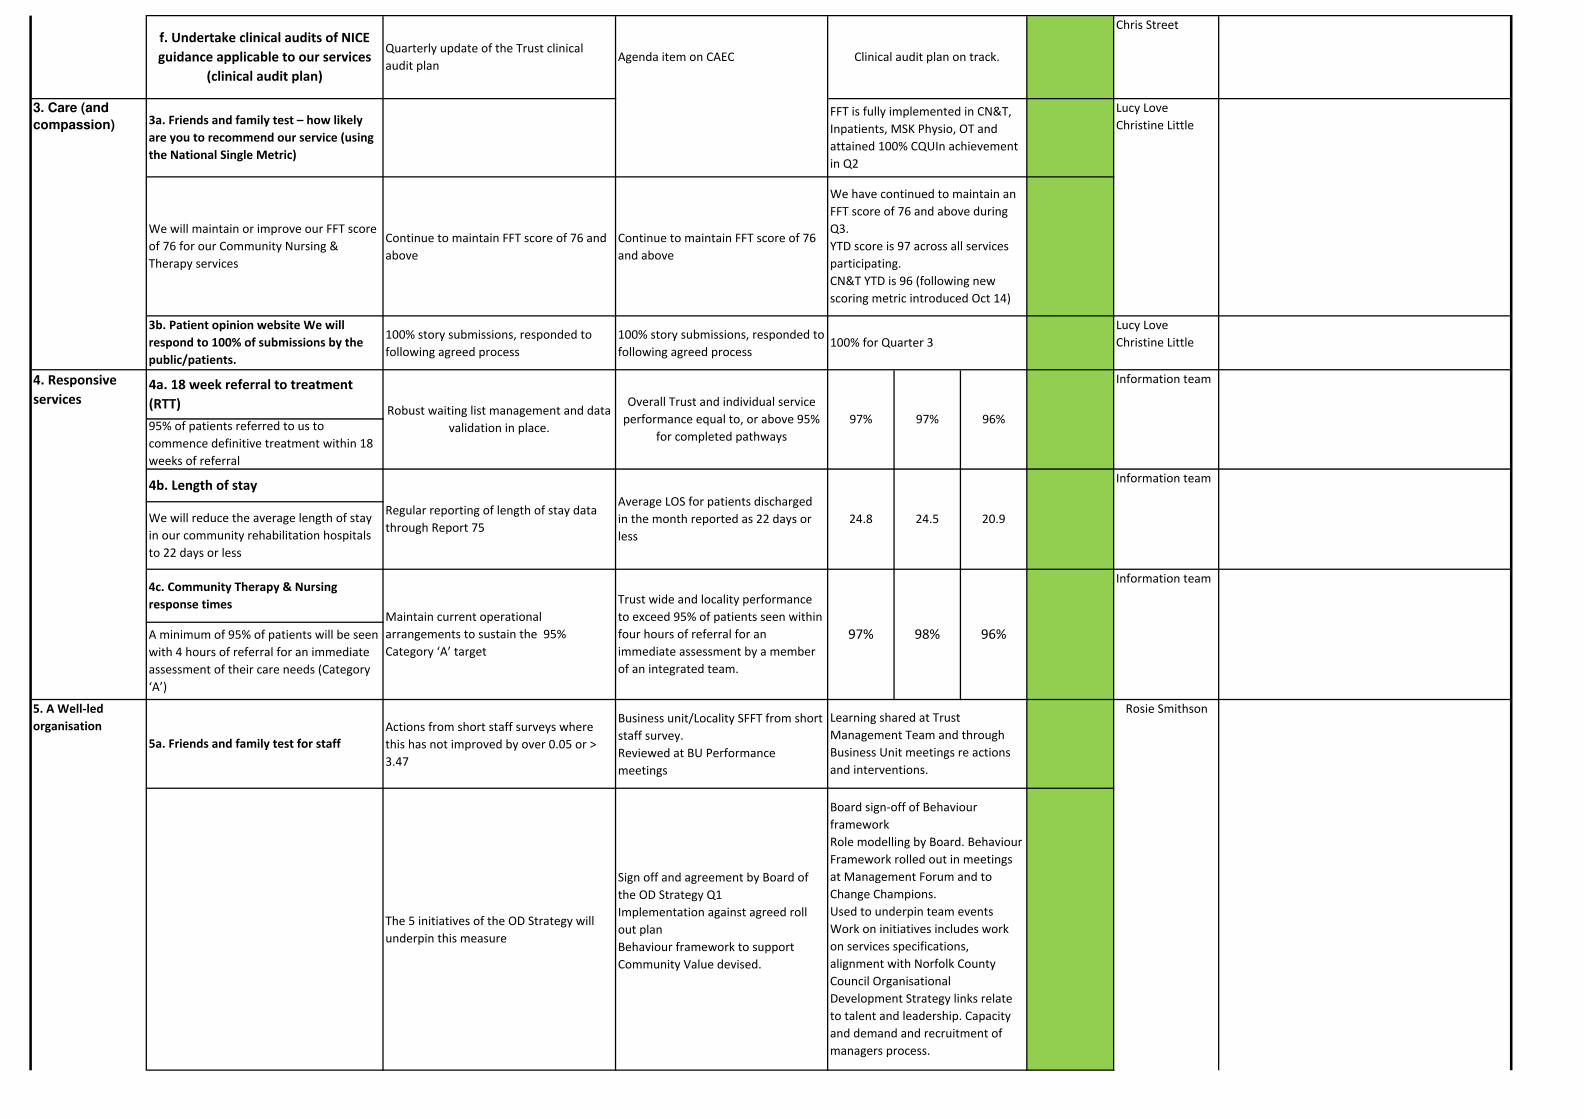
all being so brave, going 'in cold' to a patient who is perhaps the only person they see in day. You all deserve better!! You were so kind to me!! You all do a fantastic job in the Community bring succour and comfort to the vulnerable and lonely. I have written to my MP with a request my letter is forwarded to the Health Minister and spoken with the County Councillor, I shall also write to the NHS Trust and media about your plight of staff shortages. You cannot speak up yourselves but it does not stop championing your cause. ***." Kings Lynn Integrated Team "Service was impeccable and extremely beneficial and suited to the problems I had. Specifics: speed of access, length of time between referral and treatment was far to long." 4. Quality Goals – Quarter 3 summary 4.1 Summary of achievements 27 tasks for Q3 achieved their target / objective. 4.2 Of the missed targets;
1a. Safety thermometer We will increase the percentage of patients with harm free care (new harms only) on the day surveyed to exceed 97% throughout the year. 1c2 Pressure Ulcers We will ensure that patients in our inpatient units will not acquire avoidable pressure ulcers (all data is awaiting validation) 1F Effective use of medicines Audit of inpatient prescription charts and monitoring of medicines reconciliation delayed due to staff capacity issues (planned for February 2015) 5a. Friends and family test for staff North and South Localities and Children services have not met (or exceeded) 3.59 out of 6 5b1. Induction Consistently not meeting 100% target of clinical staff attending relevant mandatory training on induction to the Trust. There is a process in place by LEAD to chase Managers where staff are non-compliant. Note that there is a delay in reporting on ESD 5b2. Mandatory training Not meeting the target of at least 90% of clinical staff receiving on-going mandatory training – although we are meeting the contractual target of 80% ( 83.35% for Q3) 5b3. Safeguarding adults basic awareness training Not meeting the target of at least 90% of clinical staff receiving training in Safeguarding adults basic awareness, which includes domestic abuse and PREVENT agenda. We are meeting the contractual target of 80% 5b4 Safeguarding children training Not meeting the target of at least 90% of clinical staff receiving training in safeguarding children (also not meeting contractual 80% target)
5. Care Quality Commission 5.1 CQC Compliance action plan
Quality Assurance & Risk Report Page 25 of 27
The CQC Compliance action plan has been updated and submitted to EDT for a review. The following is a summary of actions taken up to 5/2/15. Regulation 18 Consent to care and treatment The Trust MUST ensure all clinical staff understand how the Mental Capacity Act applies to their work and develop a mechanism to monitor compliance of the MCA. These actions, which relate to mental capacity, are all complete. However it is recognised that this area requires ongoing training especially as it relates to Deprivation of Liberty Safeguards (DOLS) and the implementation of new guidance, as it becomes available. Regulation 13 Management of Medicines The Trust MUST carry out a review of medicines management to ensure there are suitable arrangements in place to safely manage medicines. Actions 1 – 6 are all complete and once 2 SOPs have been approved by Medicines Management on 10th February 2015 these actions can be fully signed off. Actions 7 – 9 relate to a Pharmacy services SLA with the NNUH. The SLA has been drafted by NCH&C and is currently with the NNUH for costing and agreement. The aim is to have an agreed and signed SLA by the end of February 2015. Regulation 9 Care and Welfare of people who use services The Trust MUST ensure that all patients have a clear care plan in place which takes account of their individual needs and ensures their welfare and safety An initial review of all inpatient care plans and audit is complete. The current assessment tool is being modified to underpin a personalised care plan and this should be complete by the end of February. The welcome pack is being updated to standardised key messages regarding individualised care planning The aim is to complete all the actions identified by the end of February 2015.
6. Risk Management 6.1 Board Assurance Framework & Risk Management Internal Audit
An internal audit was carried out by PricewaterhouseCoopers in January 2015 following the high risk opinion from the audit carried out in September 2014. The opinion from the most recent internal audit was an improvement to moderate assurance. An action plan is currently being agreed to address the areas identified within the January 2015 audit. In addition a paper was submitted to Trust Management Team on 27 January 2015, of which the following recommendations were approved:-
• Restructure of risk register owners to align with operational and corporate structures. This will mean a reduction of the current number of risk register owners from 293 to approx 120.
• Addition of details of risks closed within month into the Business Unit Performance meeting
• Implementation of an Incident and Risk exception dashboard
Quality Assurance & Risk Report Page 26 of 27
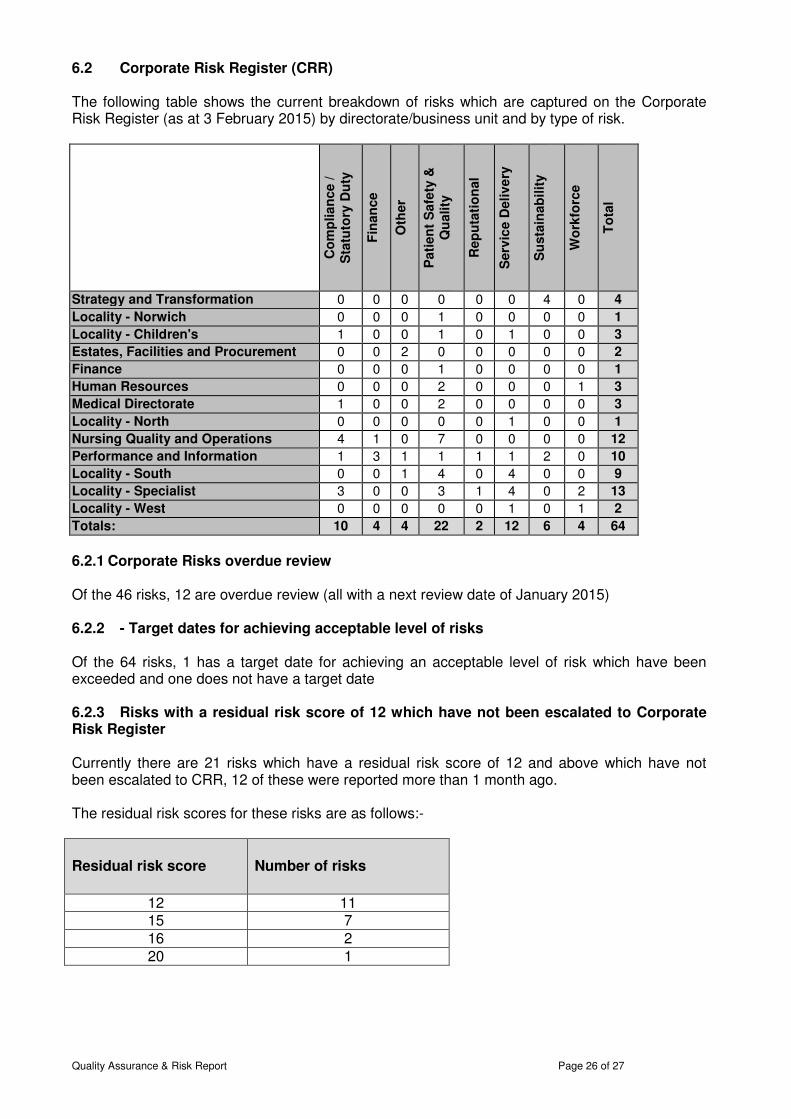
6.2 Corporate Risk Register (CRR) The following table shows the current breakdown of risks which are captured on the Corporate Risk Register (as at 3 February 2015) by directorate/business unit and by type of risk.
Co
mp
lian
ce
/
Sta
tuto
ry D
uty
Fin
an
ce
Oth
er
Pati
en
t S
afe
ty &
Q
uality
Rep
uta
tio
nal
Serv
ice D
eli
ve
ry
Su
sta
inab
ilit
y
Wo
rkfo
rce
To
tal
Strategy and Transformation 0 0 0 0 0 0 4 0 4
Locality - Norwich 0 0 0 1 0 0 0 0 1
Locality - Children's 1 0 0 1 0 1 0 0 3
Estates, Facilities and Procurement 0 0 2 0 0 0 0 0 2
Finance 0 0 0 1 0 0 0 0 1
Human Resources 0 0 0 2 0 0 0 1 3
Medical Directorate 1 0 0 2 0 0 0 0 3
Locality - North 0 0 0 0 0 1 0 0 1
Nursing Quality and Operations 4 1 0 7 0 0 0 0 12
Performance and Information 1 3 1 1 1 1 2 0 10
Locality - South 0 0 1 4 0 4 0 0 9
Locality - Specialist 3 0 0 3 1 4 0 2 13
Locality - West 0 0 0 0 0 1 0 1 2
Totals: 10 4 4 22 2 12 6 4 64
6.2.1 Corporate Risks overdue review Of the 46 risks, 12 are overdue review (all with a next review date of January 2015) 6.2.2 - Target dates for achieving acceptable level of risks Of the 64 risks, 1 has a target date for achieving an acceptable level of risk which have been exceeded and one does not have a target date 6.2.3 Risks with a residual risk score of 12 which have not been escalated to Corporate Risk Register Currently there are 21 risks which have a residual risk score of 12 and above which have not been escalated to CRR, 12 of these were reported more than 1 month ago. The residual risk scores for these risks are as follows:-
Residual risk score
Number of risks
12 11 15 7 16 2 20 1
Quality Assurance & Risk Report Page 27 of 27
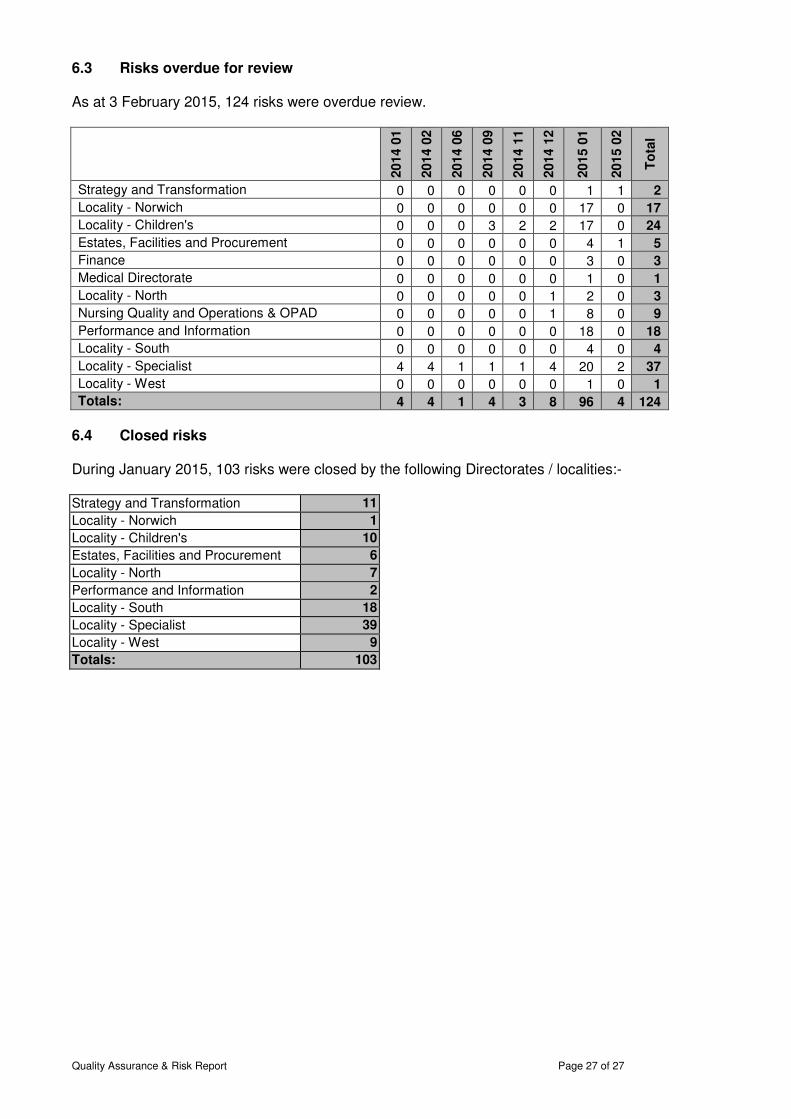
6.3 Risks overdue for review As at 3 February 2015, 124 risks were overdue review.
2014
01
2014
02
2014
06
2014
09
2014
11
2014
12
2015
01
2015
02
To
tal
Strategy and Transformation 0 0 0 0 0 0 1 1 2
Locality - Norwich 0 0 0 0 0 0 17 0 17
Locality - Children's 0 0 0 3 2 2 17 0 24
Estates, Facilities and Procurement 0 0 0 0 0 0 4 1 5
Finance 0 0 0 0 0 0 3 0 3
Medical Directorate 0 0 0 0 0 0 1 0 1
Locality - North 0 0 0 0 0 1 2 0 3
Nursing Quality and Operations & OPAD 0 0 0 0 0 1 8 0 9
Performance and Information 0 0 0 0 0 0 18 0 18
Locality - South 0 0 0 0 0 0 4 0 4
Locality - Specialist 4 4 1 1 1 4 20 2 37
Locality - West 0 0 0 0 0 0 1 0 1
Totals: 4 4 1 4 3 8 96 4 124
6.4 Closed risks During January 2015, 103 risks were closed by the following Directorates / localities:- Strategy and Transformation 11
Locality - Norwich 1
Locality - Children's 10
Estates, Facilities and Procurement 6
Locality - North 7
Performance and Information 2
Locality - South 18
Locality - Specialist 39
Locality - West 9
Totals: 103
Appendix
Quality Goal ActionsPerformance/
success measuresOct Nov Dec RAG
Data source or
Lead Reasons/actions taken if not compliant
Patients with harm free care (new
harms only) (on the day surveyed)90.0% 90.7% 90.2%
Percentage of patients with new
harms (on the day surveyed)2.9% 3.0% 3.8%
On-going monitoring of VTE assessment
achievement
Monitor VTE assessment rate via the
safety thermometer data99.0% 90.0% 99.0%
Review and analysis of any VTEs occurring
in our care
Report via monthly quality and risk
report
1d. Venous thromboembolisms
(VTEs) We will ensure that 100% of
appropriate patients in our inpatient units
will have a VTE risk assessment
undertaken during their inpatient stay
1c. Pressure ulcers
1c1. We will ensure that 100% of patients
in our inpatient units have a Waterlow risk
assessment
Baseline audit of Waterlow completed
within 6 hours of admission.Baseline audit outcome data
1b2 We will ensure that 100% of all
patients are assessed for their risk of
falling on admission.
All injurious falls (causing moderate or
severe harm) the patient will have had a
risk assessment on admission or as part of
reassessment during treatment
100% of patients are assessed for risk
of falling
December Briefing
Exchange
Information team
DATIX incident
report
Marcia Perry
100% of all pressure ulcers
reviewed at Pressure Ulcer
Validation Group had received a
Waterlow Risk Assessment
3.60
Quality Goals for 2014/15: Quarter 3 report
Quality Goal Description
1b. Falls causing harm in our
inpatient units
1b1 We will maintain the number of falls
causing harm to patients in our inpatient
units at 4.0 falls or less per 1,000 occupied
bed days.
To monitor monthly falls data (remedial
actions for compliance)
4.0 or less falls per 1,000 OBDs
(evidenced through Q&R Report)
Local actions to improve % rate by teams
of harm free care
1a. Safety thermometer
We will increase the percentage of
patients with harm free care (new harms
only) on the day surveyed to exceed 97%
throughout the year.
1. Safe, (harm
free care)
1c3. Our community nursing and therapy
teams will assess patients in the
community (patient homes) for the risk of
a pressure ulcer using the Waterlow
system. (Standard is 95%).
Development of guidelines for referral for
pressure relieving equipment.
1c2 We will ensure that patients in our
inpatient units will not acquire avoidable
pressure ulcers
Baseline audit of Waterlow assessments
at initial contact.Completion of audit
1c4. We will ensure that all patients who
require equipment will be referred within
agreed guidelines. (Standard is 98% of all
relevant patients).
A) Monitoring of data following Pressure
Ulcer Validation Panel
Zero avoidable pressure ulcers in In-
Patient units.
Safety
Thermometer
Chris Street
100% for Quarter
3.7 2.90
Guidelines have been implemented
100% ofall pressure ulcers reviewed
at Pressure Ulcer Validation Group
had received a Waterlow Risk
Assessment
0*1* 1*
No VTEs have been reported via
Datix in Q3
DATIX incidents
and PU Validation
panel
Marcia Perry
*These numbers have not been through PU
Validation panel at the time of the report
Assessed as green due to the fact that Safety
thermometer does not exclude those patients who
have recently been admitted but not yet assessed.
Nov 2014 drop in performance due to data input
issue as Beech ward shows zero assessments
undertaken. Excluding Beech result is 99%
Process continues and any issues
are raised via ICES Board.
Marcia Perry

Safety thermometer incidence of
CAUTI data for Q2
Safety
Thermometer
Marcia Perry
Create Task and Finish group including
IPAC, Continence Advisors Modern
Matron and AD Medical Directorate to
manage CAUTI
Group to meet and develop action
plan
Marcia Perry
Communicate and publicise medicines
optimisation strategy and action plan
Staff awareness and evidence of
discussion at MMG
Chris Street
Clinical audit of inpatient prescription
chartsClinical audit report
Ward Managers
Development of clinical effectiveness
strategy taking into account all of the
methods in use and new measures
identified by clinical leads
Approval of strategy Chris Street
Review of 2-3 of the quality standards Agenda item on CAEC – review and
any actions agreed
Chris Street
Delayed, due to capacity issues,
now planned for February 2015
Collation of data from all operational
managersAbility to identify gaps in supervision
Process for logging
safeguarding supervision -logged
with Safeguarding Team
To work with MASH / SystmOne / NCH&C
Performance Team to enable accurate
identification of data.
Accurate data collection
Data to be collated by Performance
Manager into a Dashboard
presented to QRAC in January 2015
2. Effectiveness
of Care
1h. Referrals to Local Authority
Children’s Services
1g. Children Safeguarding
supervision
Ensure that 100% of patients have a
medicines reconciliation undertaken
Monitoring of medicines
reconciliation results
A review of Trust services against key
NICE Quality Standards (a-e)
a. Dementia (QS1)
b. Stroke (QS2)
c. VTE prevention (QS3)
d. End of life care for adults (QS13)
e. Health and wellbeing of looked
after children and young people
(QS31)
A further 3 quality standards have
been reviewed, and quality
standards are now included in the
NICE guidance review process, so in
future will be assessed alongside
clinical guidance on publication
Implementation of strategy
1e. Catheter acquired urinary tract
infections (CAUTI)
We will reduce the incidence of CAUTIs
using the Safety Thermometer survey data
in 2013/14 as the benchmark (0.76%
average per month)
Medicines' optimisation
strategy approved and was sent
to December Board.
Action plan developed and will go
to February Medicines'
Management Group.
All clinical staff in Children’s Services will
receive safeguarding supervision in
accordance with the NCH&C Safeguarding
Children Policy
Development of a medicines optimisation
strategy in line with national guidance
Approval of strategy by medicines
management group (MMG)
Promote the availability and usage of the
Trust formularyAwareness of the Trust formulary
All staff in Children’s Services will
undertake referrals to Local Authority
Children’s Services in accordance with the
NCH&C Safeguarding Children Policy /
Norfolk Safeguarding Children Board
Policy.
1f. Effective use of Medicines
Ward Managers
100% of inpatient will have medicines
reconciliation during their inpatient stay
Anita Bagge
Catherine Knox
Awareness raised through
Medicines' Managmetn Group and
communication to prescribers to
remind them to use formulary.
Delayed, due to capacity issues,
now planned for February 2015
Group met and staff awareness
programme planned in March
2015
0.3%
Chris Street
Chris Street
Anita Bagge
Continue to maintain FFT score of 76 and
above
Continue to maintain FFT score of 76
and above
100% story submissions, responded to
following agreed process
100% story submissions, responded to
following agreed process
Lucy Love
Christine Little
Information team
Actions from short staff surveys where
this has not improved by over 0.05 or >
3.47
Business unit/Locality SFFT from short
staff survey.
Reviewed at BU Performance
meetings
The 5 initiatives of the OD Strategy will
underpin this measure
Sign off and agreement by Board of
the OD Strategy Q1
Implementation against agreed roll
out plan
Behaviour framework to support
Community Value devised.
Board sign-off of Behaviour
framework
Role modelling by Board. Behaviour
Framework rolled out in meetings
at Management Forum and to
Change Champions.
Used to underpin team events
Work on initiatives includes work
on services specifications,
alignment with Norfolk County
Council Organisational
Development Strategy links relate
to talent and leadership. Capacity
and demand and recruitment of
managers process.
Learning shared at Trust
Management Team and through
Business Unit meetings re actions
and interventions.
Robust waiting list management and data
validation in place.
Overall Trust and individual service
performance equal to, or above 95%
for completed pathways
97% 97% 96%
Average LOS for patients discharged
in the month reported as 22 days or
less
Rosie Smithson
3. Care (and
compassion) 3a. Friends and family test – how likely
are you to recommend our service (using
the National Single Metric)
We will maintain or improve our FFT score
of 76 for our Community Nursing &
Therapy services
3b. Patient opinion website We will
respond to 100% of submissions by the
public/patients.
4. Responsive
services4a. 18 week referral to treatment
(RTT)
4b. Length of stay
We will reduce the average length of stay
in our community rehabilitation hospitals
to 22 days or less
5. A Well-led
organisation
5a. Friends and family test for staff
95% of patients referred to us to
commence definitive treatment within 18
weeks of referral
4c. Community Therapy & Nursing
response times
A minimum of 95% of patients will be seen
with 4 hours of referral for an immediate
assessment of their care needs (Category
‘A’)
Quarterly update of the Trust clinical
audit planAgenda item on CAEC
f. Undertake clinical audits of NICE
guidance applicable to our services
(clinical audit plan)
Chris Street
Lucy Love
Christine Little
We have continued to maintain an
FFT score of 76 and above during
Q3.
YTD score is 97 across all services
participating.
CN&T YTD is 96 (following new
scoring metric introduced Oct 14)
Clinical audit plan on track.
Information team
Information team
Maintain current operational
arrangements to sustain the 95%
Category ‘A’ target
Trust wide and locality performance
to exceed 95% of patients seen within
four hours of referral for an
immediate assessment by a member
of an integrated team.
Regular reporting of length of stay data
through Report 75
FFT is fully implemented in CN&T,
Inpatients, MSK Physio, OT and
attained 100% CQUIn achievement
in Q2
24.8 24.5 20.9
97% 98% 96%
100% for Quarter 3

3.65%
3.32%
3.61%
3.35%
3.30%
82.0% 59.0% *37%
2 day patient centric training to be
delivered to clinical staff
Weekly reporting of business areas.
At least 90% of clinical staff will
receive on-going mandatory training.
(Meeting contractual target of 80%)
Rosie Smithson
Schedule 4
10% more staff have been booked onto this training
over last 4 weeks and the process to identify
individuals continues advising managers to chase.
Managers are reminded through performance
meetings and through business unit meetings.
Recent staffing challenges have not reduced
compliance and we continue to book on the final
22% of staff not booked on by end of March.
Staff to be booked onto Safeguarding
adults basic awareness training
Weekly reporting of business areas
90% of clinical staff will receive
training in Safeguarding adults basic
awareness
(NB meeting contractual target of
80%)
86.4% 87.4% 88.1%Safeguarding
team for Schedule
4 data
Process in place by LEAD to chase Managers where
staff are non-compliant
Staff to be booked onto safeguarding
children training
Weekly reporting of business areas
90% of clinical staff will receive
training in safeguarding children77.0% 77.0% 77.0%
Safeguarding
team for Schedule
4 data
Extensive contact with managers of low compliant
teams; message in 'Weekly Messages'
Marcia Perry
Bank
Sucess measure is to meet or exceed
3.59 out of 5.0
We will improve our summary score of
3.47 to ensure that we meet or exceed
the average for community trusts (3.59
out of 5.0 (71%)).
Monthly upload to Unify
Safer staffing report to Board bi-annually includes:
1. safe staffing by unit basis
2. overarching trends and themes.
Review of safe staffing levels using the RCN Safer
Staffing for Older People Toolkit
1. No material change in scoring.
2. Units: lowest end of acceptable
3. Rating: red for registered nursing on late shifts.
Action: creation of the fixed term discharge
coordinator role with positive results
Process in place by LEAD to chase Managers where
staff are non-compliant
*late reporting onto ESR due to
Christmas holidays and staff long
term sickness absence will affect
final %
Reported quarterly
Monitored and displayed in all
inpatient wards
Quarter 3 = 83.35%
Rosie Smithson
Schedule 4
5b3. At least 90% of clinical staff will
receive training in Safeguarding adults
basic awareness, which includes domestic
abuse and PREVENT agenda.
Develop and implement process to report
through OPAD any staff not attending
100% staff attending recruitment
from induction to the Trust.
(NB late reporting onto ESR will
affect final %)
5b2. Mandatory training - At least 90% of
clinical staff will receive on-going
mandatory training
5c. Safer staffing levels
We will ensure that daily staffing levels
and skill mix against assessed patient
acuity levels are displayed publicly on each
ward/clinical area. (Standard is 95%
reported quarterly)
Staffing levels continue to be monitored
against safer staffing toolkit and display
publicly on each ward
Standard is 95% reported quarterly)
5b4 At least 90% of clinical staff will
receive training in safeguarding children
Children services
South Locality
West Locality
North Locality
5b1. Induction - 100% of clinical staff will
receive relevant mandatory training on
induction to the Trust.
Staff recommendation of the trust as a
place to work or receive treatment (Staff
survey KF24).
Appendix 2 Safe Staffing for January 2015 This report provides information on safe staffing for the period of January 2015. The attached chart outlines the staffing activity across inpatient and respite units. During January levels have been maintained within appropriate levels. Each unit undertakes local actions to ensure safe staffing is maintained at all times. However should concerns arise, these are escalated via the Datix system. During January 4 shifts were escalated via the Datix system (see attached).

Safe staffing January 2015
Day Night Day Night
Registered midwives/nurses Care Staff
Registered midwives/nurses
Care Staff
Site Name
Total monthly
planned staff hours
Total monthly
actual staff hours
Total monthly planned
staff hours
Total monthly
actual staff hours
Total monthly planned
staff hours
Total monthly
actual staff hours
Total monthly planned
staff hours
Total monthly actual staff
hours
Average fill rate -
registered nurses/
midwives (%)
Average fill rate -
care staff (%)
Average fill rate -
registered nurses
/midwives (%)
Average fill rate -
care staff (%)
Alder Ward 1290 1270 1750 2460 630 620 330 350 98.4% 140.6% 98.4% 106.1%
Beech Ward 1840 1760 2800 2820 620 640 690 650 95.7% 100.7% 103.2% 94.2%
Benjamin Court 1240 1250 1550 1480 620 600 310 330 100.8% 95.5% 96.8% 106.5%
Cranmer House 840 785 1550 1530 310 310 310 310 93.5% 98.7% 100.0% 100.0% Kelling Hospital (Pineheath Ward) 1240 1260 3080 2840 620 610 620 610 101.6% 92.2% 98.4% 98.4%
North Walsham 1240 1280 2480 2390 620 610 620 610 103.2% 96.4% 98.4% 98.4%
Swaffham Hospital 1310 1430 1460 1310 590 560 340 380 109.2% 89.7% 94.9% 111.8% Dereham Hospital (Foxley Ward) 1860 1690 3100 2990 620 610 620 620 90.9% 96.5% 98.4% 100.0%
Ogden Court 1320 1260 2130 2030 560 640 310 330 95.5% 95.3% 114.3% 106.5%
Caroline House 1610 2210 2750 2350 630 640 610 600 137.3% 85.5% 101.6% 98.4%
Pine Cottage 920 1000 940 930 320 310 310 310 108.7% 98.9% 96.9% 100.0%
Priscilla Bacon Centre 1700 1680 2100 2250 600 620 600 760 98.8% 107.1% 103.3% 126.7%
Little Acorns 1000 1162.5 950 787.5 250 237.5 462.5 475 116.3% 82.9% 95.0% 102.7%
Mill Lodge 881.5 892.25 1236.25 1236.25 333.25 333.25 344 344 101.2% 100.0% 100.0% 100.0%
Squirrels 1100 1075 1312.5 1312.5 275 300 550 525 97.7% 100.0% 109.1% 95.5%

Safe staffing breaches reported January 2015 ID Team Category Description Action taken
33697 Benjamin Court
Inpatients - Safe Staffing Breach
staff nurse phoned in sick at 07:30 for 13.30 -21.30. Bank unable to cover with bank or agency, existing ward staff unable to assist. 13.30 hrs agency HCA did not arrive for booked duty, bank phoned agency had cancelled and unable to fill shift .This left 1 Staff Nurse and 1 HCA bank nurse
Ward Manager worked a late shift and Modern Matron worked until medication round completed. 18 patients on the ward, 4 required palliative care, 7 patient requiring 2 nurses, 2 patient required assistance with meals.
34080 Beech Ward
Inpatients - Safe Staffing Breach
Staffer staffing breech due to band 2 Health Care Assistant shift not covered by bank or ward Shift sent to bank 26/1/2015 to cover sickness
assistance from therapy and management staff
33465 Beech Ward
Inpatients - Safe Staffing Breach
Staff Nurse asked to cover Kelling Hospital on Sunday 04th Jan for a early shift by on call manager. On call manager authorised staff nurse to use a taxi due to distance to Kelling Hospital which was booked through Beech ward's budget. Ward was down HCA * 1 and RN * 1 below prescribed levels.
The staff nurse involved asked me to email ward sister to inform them of this so they were aware our ward would be down a staff nurse in the morning but we had been covered with a health care assistant from bank. Informed Sister who asked me to complete a datix.
34234 Beech Ward
Inpatients - Safe Staffing Breach
Agency member of staff did not turn up, called the agency and they said the shift was still booked and no one had called in sick, said they would call back but didn't.
One member of staff was on a therapy day so I had to ask her to come off of therapy to assist as an HCA meaning some patients did not recieve their allocated therapy for today.
