1 2 china between the 1980s and 2000s no significant ... · 1 no significant changes in topsoil...
TRANSCRIPT
1
No significant changes in topsoil carbon in the grasslands of northern 1
China between the 1980s and 2000s 2
3
Author: Shangshi Liu1,2, Yuanhe Yang1, Haihua Shen1, Huifeng Hu1, Xia Zhao,1 4
He Li1,2, Taoyu Liu1,2, Jingyun Fang1,3* 5
6
1State Key Laboratory of Vegetation and Environmental Change, Institute of Botany, Chinese 7
Academy of Sciences, Beijing 100093, China� 8
2University of Chinese Academy of Sciences, Beijing 100049, China 9
3 Department of Ecology, Key Laboratory for Earth Surface Processes of the Ministry of 10
Education, Peking University, Beijing 100871, China 11
12
13
Corresponding author: Professor Jingyun Fang, Tel: +86-10-6276 5578, Fax: 14
+86-10-6275 6560, E-mail: [email protected] 15
16
17
18
19
20
21
22
23
Biogeosciences Discuss., doi:10.5194/bg-2016-473, 2017Manuscript under review for journal BiogeosciencesPublished: 2 January 2017c© Author(s) 2017. CC-BY 3.0 License.
2
Abstract 24
The grasslands of northern China store a large amount of soil organic carbon (SOC), and the small 25
changes in SOC stock could significantly affect the regional C cycle. However, recent estimates 26
of SOC changes in this region are highly controversial. In this study, we examined the changes in 27
the SOC density (SOCD) in the upper 30 cm of the grasslands of northern China between the 28
1980s and 2000s, using an improved approach that integrates field-based measurements into 29
machine learning algorithms (artificial neural network and random forest). The random 30
forest-generated SOCD averaged 5.55 kg C m-2 in the 1980s and 5.53 kg C m-2 in the 2000s. The 31
change ranged between -0.17 and 0.22 kg C m-2 at the 95% confidence level, suggesting that the 32
overall SOCD did not change significantly during the study period. However, the change in 33
SOCD exhibited large regional variability. The topsoil of the Inner Mongolian grasslands 34
experienced a significant C loss (4.86 vs. 4.33 kg C m-2), whereas that of the Xinjiang grasslands 35
exhibited an accumulation of C (5.55 vs. 6.46 kg C m-2). In addition, the topsoil C in the Tibetan 36
alpine grasslands remained relatively stable (6.12 vs. 6.06 kg C m-2). A comparison of different 37
grassland types indicated that SOCD exhibited significant decreases in typical steppe, whereas 38
showed increases in mountain meadow, and were stable in the remaining grasslands (alpine 39
meadow, alpine steppe, mountain steppe and desert steppe). Climate change could partly explain 40
these changes in the SOCD of the different grassland types. Increases in precipitation could lead 41
to SOC increase in temperate grasslands and SOC loss in alpine grasslands, while climate 42
warming is likely to cause SOC loss in temperate grasslands. Overall, our study shows that 43
northern grasslands in China remained a neutral SOC sink between the 1980s and 2000s. 44
Keywords: alpine grasslands, artificial neural network, carbon density, climate change, 45
grassland ecosystems, random forests, soil organic carbon, temperate grasslands. 46
Biogeosciences Discuss., doi:10.5194/bg-2016-473, 2017Manuscript under review for journal BiogeosciencesPublished: 2 January 2017c© Author(s) 2017. CC-BY 3.0 License.
3
1 Introduction 47
Soil is the largest carbon (C) pool in the terrestrial ecosystem (Batjes, 1996), and even a few 48
percent changes in stored C can have profound impacts on terrestrial C cycling (Johnson et al., 49
2007). Previous studies have shown that climate warming will likely accelerate the 50
microorganism decomposition of soil organic C (SOC) and induce greater carbon dioxide (CO2) 51
emissions into the atmosphere, thus promoting positive C-climate feedback. However, this C loss 52
from soil might be offset if the increased input of plant C to soil exceeds the increase in 53
decomposition, which would promote negative C-climate feedback (Davidson and Janssens, 54
2006). Hence, accurately unraveling SOC dynamics under climate change is crucial to determine 55
whether positive C-climate feedback has occurred. 56
Grasslands are widely distributed in temperate regions of the world, and most C in grasslands 57
stores in soil. (Fang et al., 2010). Due to this point, the SOC dynamics of grasslands have 58
attracted considerable attention in recent decades (e.g., Hanegraaf et al., 2009; Mestdagh et al., 59
2009; Yang et al., 2010). However, soil produces the largest amount of uncertainty with respect to 60
estimating the terrestrial C budget (Ciais et al., 2013; Todd-Brown et al., 2013). For example, 61
using a repeated soil inventory, Bellamy et al. (2005) reported that soils in England and Wales, 62
including grassland soils, had experienced a significant C loss from 1978 to 2003. However, 63
Emmett et al. (2010) analyzed a large-scale survey of soil profiles and found that the topsoil C 64
concentration in Great Britain did not change as much as that reported by Bellamy et al. (2005) 65
during the same study period. As an important component of global grassland ecosystem, nature 66
grasslands in China cover more than 40% of country’s territory, and the C in soil account for 67
about 96.6 % grassland ecosystem C stock in this area (Fang et al., 2010). Similarly, contrasting 68
studies have also been reported with respect to the estimation of the SOC change in China’s 69
Biogeosciences Discuss., doi:10.5194/bg-2016-473, 2017Manuscript under review for journal BiogeosciencesPublished: 2 January 2017c© Author(s) 2017. CC-BY 3.0 License.

4
northern grasslands. Using the Terrestrial Ecosystem Model, Yan et al. (2015) suggested that 70
Tibetan alpine grasslands sequestered C over the past 50 years at an annual rate of 10.1 Tg C. In 71
contrast, Yang et al. (2008, 2010) demonstrated that the SOC stock in the grasslands of northern 72
China did not change considerably between the 1980s and 2000s. These conflicting results 73
suggest that intensive investigations and appropriate methodology are required to accurately 74
assess the SOC dynamics of the grasslands in northern China. 75
In this study, we used repeated observations from two periods in the 1980s and 2000s and two 76
advanced machine learning algorithms, artificial neural network (ANN) and random forest (RF) 77
algorithms, to estimate long-term SOC changes in grasslands of northern China. The ANN and 78
RF approaches consider the spatial relationships between study sites and the influence of climatic 79
and edaphic parameters and could thus produce more accurate predictions compared with 80
traditional spatial interpolation approaches, such as process-based models or Kriging-based spatial 81
interpolations (Grimm et al., 2008; Li et al., 2013; Sreenivas et al., 2014; Yang et al., 2014). 82
Specifically, we aimed to answer the following three questions: (1) Do the new approaches we 83
used produce different estimates of SOC stocks and spatial heterogeneity compared with those 84
obtained from previous studies? (2) How do the SOC changes vary spatially across the grasslands 85
of northern China? and (3) How these changes are associated with climatic factors and vegetation 86
types? 87
88
2 Materials and methods 89
2.1 Soil inventories 90
Soil profile data in the 1980s were obtained from the National Soil Inventory (Wu, 1991; Hou and 91
Zeng, 1992; Feng and Wang, 1993; Zhao, 1993; Gong, 1994; Liu, 1995) and were used to assess 92
Biogeosciences Discuss., doi:10.5194/bg-2016-473, 2017Manuscript under review for journal BiogeosciencesPublished: 2 January 2017c© Author(s) 2017. CC-BY 3.0 License.
5
the historical status of the SOC density (SOCD) in the grasslands of northern China. The soil 93
inventory recorded the physical and chemical properties of the soils, such as geographical location, 94
land cover, layer thickness, bulk density, proportion of rock fragments, and soil organic matter 95
(SOM) concentration, which was determined using the Walkley-Black method (Nelson and 96
Sommers, 1982). We used a constant value of 0.58 to convert SOM to SOC (Wu et al., 2003; Xie 97
et al., 2007; Yang et al., 2010). A detailed description of the inventory soil profiles can be found 98
in Yang et al. (2010). 99
The soil data in the 2000s were obtained from field sampling campaigns conducted from 100
2001-2005 across the grasslands of northern China (Yang et al., 2010). The SOC concentration 101
was determined following the same methodology as the National Soil Inventory (i.e., 102
Walkley-Black method). The descriptions of this sampling method and the soil profiles (with 103
environmental variables) are detailed in Yang et al. (2008, 2010). 104
105
2.2 Vegetation information and climate/Normalized Difference Vegetation Index (NDVI) 106
data 107
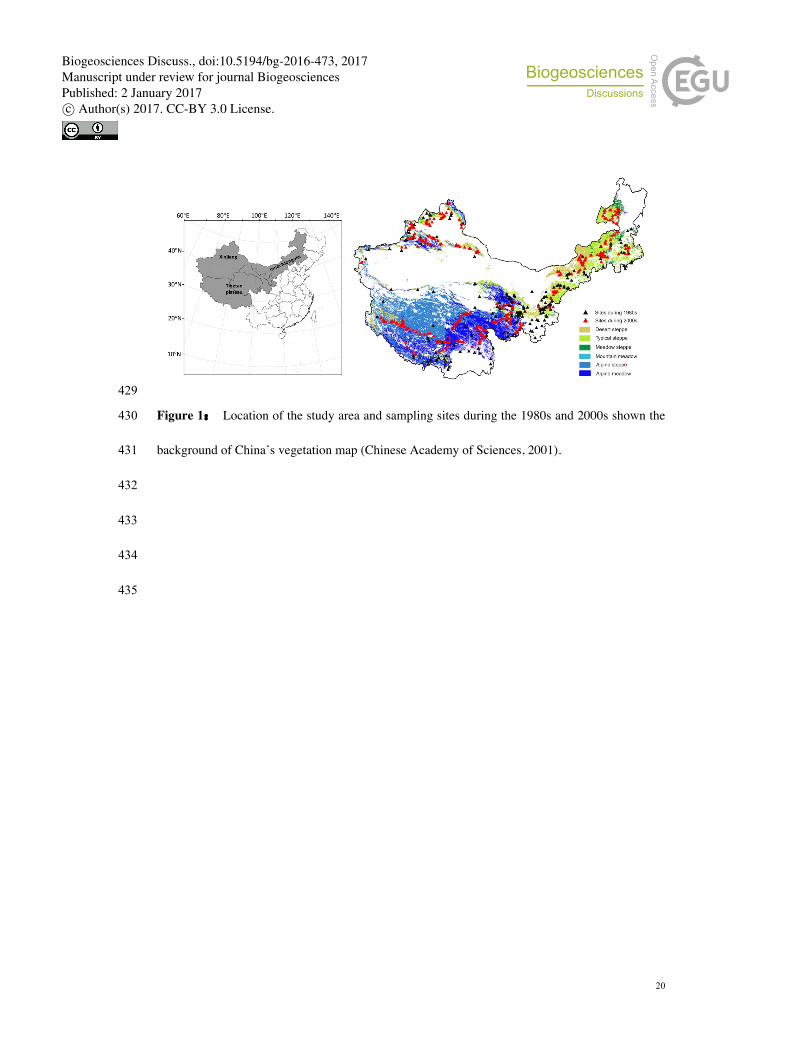
According to the vegetation map of China (Chinese Academy of Sciences, 2001), six major 108
grassland types occur in China: desert steppe (DS), typical steppe (TS), meadow steppe (MS), 109
mountain meadow (MM), alpine steppe (AS), and alpine meadow (AM) (Fig. 1). To understand 110
the variations in the SOCD dynamics among the different grassland types, the vegetation at each 111
study site was classified into temperate grasslands (i.e., DS, TS, MS, and MM) and alpine 112
grasslands (i.e., AS and AM) to examine the relationships between the SOCD dynamics and 113
climate change. In addition, to compare our results with those of previous regional studies, we 114
Biogeosciences Discuss., doi:10.5194/bg-2016-473, 2017Manuscript under review for journal BiogeosciencesPublished: 2 January 2017c© Author(s) 2017. CC-BY 3.0 License.

6
divided our study area into three landscape regions: Inner Mongolia, Xinjiang (northwestern 115
China), and the Tibetan Plateau. 116
To examine the relationships between the SOCD dynamics and environmental variables, we 117
documented the following environmental variables for each site where soil profile information 118
was collected: mean annual temperature (MAT), mean annual precipitation (MAP), seasonal 119
climate variables (precipitation, mean temperature, maximum temperature and minimum 120
temperature of each season). (National Meteorological Information Center; 121
http://www.nmic.gov.cn), and annual NDVI data at a spatial resolution of 0.1° × 0.1° (GIMMS 122
NOAA/AVHRR NDVI) (Tucker et al., 2005). 123
124
2.3 Model validation and prediction 125
First, we obtained site-level observations from Yang et al. (2010). Specifically, Yang et al. (2010) 126
calculated the SOCD in the top 30 cm of soil using Eq. 1 to provide a consistent comparison with 127
China’s National Soil Inventory from the 1980s. Because of the lack of bulk density information 128
for certain profiles surveyed in the 1980s, Yang et al. (2010) developed an empirical relationship 129
between bulk density and the SOC concentration (Eq. 2). 130
!"#$ = &')
'*+×-$'×!"#'×(1 − #'/100)/100,(1) 131
-$ = 0.29 + 1.296 exp −0.0167SOC (2) 132
(r 2 = 0.63, P = 0.0001) 133
Second, we predicted the SOCD using the RF and ANN approaches (Fig. 2). The RF approach 134
is a method that consists of averaging multiple deep decision trees trained on different parts of the 135
same training set, and the goal is to reduce variance (Hastie et al., 2009). The general technique of 136
Biogeosciences Discuss., doi:10.5194/bg-2016-473, 2017Manuscript under review for journal BiogeosciencesPublished: 2 January 2017c© Author(s) 2017. CC-BY 3.0 License.

7
bootstrap aggregating was applied in the training algorithm of the RF model. The typical ANN 137
used in this study included an input layer, a hidden layer and an output layer. Based on the 138
National Soil Inventory from the 1980s and related environmental parameters, we trained the RF 139
model and ANN to estimate the SOCD during the 1980s for those sites that were surveyed during 140
the 2000s. Moreover, to assess the SOCD in the 2000s for sites that were surveyed in the 1980s, 141
we used field observations recorded by Yang et al. (2010) and the related environmental 142
parameters to construct the RF model and ANN. Specifically, the input variables of both 143
approaches included latitude, longitude, altitude, grassland type, soil texture, NDVI, MAT, MAP, 144
and precipitation, mean temperature, maximum temperature, minimum temperature of each 145
season. The collected data sets for each period were divided into two parts. The training data set 146
(90% of all data) was used to construct the RF model and ANN. The test data set (10% of all data) 147
was used to validate the reliability of the two approaches. Moreover, the input variables of the 148
ANN were normalized to a scale between -1 and 1, and the predictions of the ANN were rescaled 149
to the actual SOCD. The predicted results were compared with field measurements to evaluate the 150
validation and performance of the ANN and RF model. We repeated the training and prediction 151
process 5000 times and adapted the mean value in both approaches. The parameters of both 152
algorithms were optimized to achieve their best performance. 153
The final results were used to estimate the SOCD in the two periods. The SOCD changes in 154
the entire grassland region, three different regions, and six grassland types were examined using a 155
paired t-test. Furthermore, linear regression model was used to explore the relationship between 156
the SOCD changes and the climate variables by grassland type. 157
158
159
Biogeosciences Discuss., doi:10.5194/bg-2016-473, 2017Manuscript under review for journal BiogeosciencesPublished: 2 January 2017c© Author(s) 2017. CC-BY 3.0 License.
8
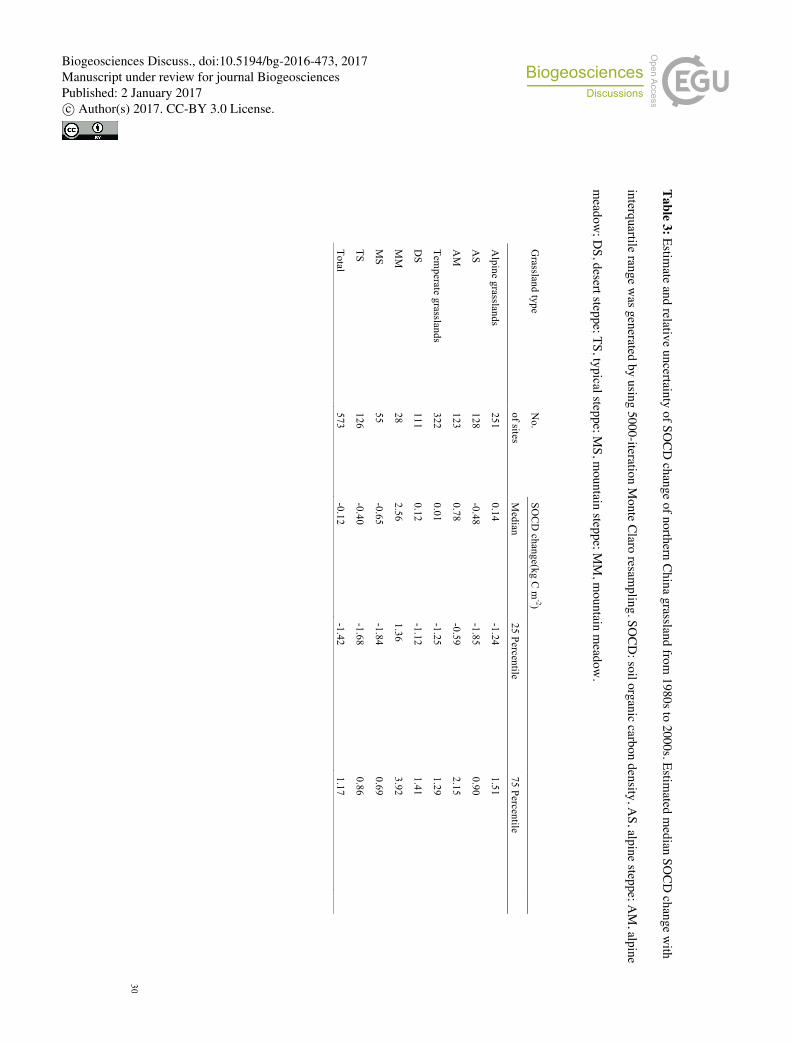
2.4 Uncertainty analysis 160
The accuracy of SOCD temporal changes was assessed by Monte Carlo simulation in this study. 161
Here, to quantify the uncertainties of our estimation, we performed 5000 Monte Carlo simulations 162
for each sites. During each stimulation, the input variables were randomly generated based on the 163
probability distribution functions of their errors. Specifically, the error of climate data (i.e., MAT, 164
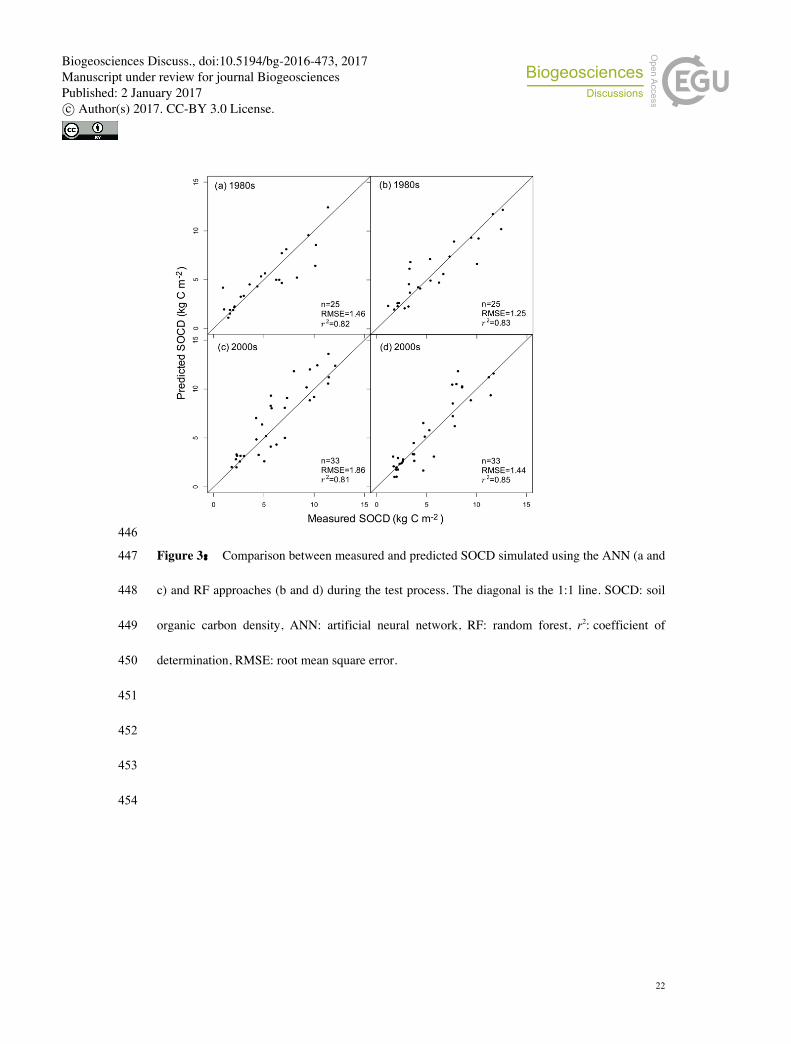
MAP etc.) were calculated from the interpolation process. For the errors associated with the 165
extrapolate models prediction of SOC density, we used values of the standard deviation of the 166
error derived from the cross-validation, we applied this error randomly to each prediction in every 167
sites. Moreover, for the soil profiles which bulk density were not recorded, we also use the error 168
of relative pedotransfer function to present the uncertainty induced by lackness of bulk density 169
record. 170
We also assumed any actual SOCD measurements was enough to present the true SOC stock, 171
thus the uncertainty of SOC change was generated by those sites had not been surveyed. Finally, 172
the interquartile range of the 5000 iterations of the simulation for each unsurveyed sites were 173
calculated, and the summed interquartile were used to assess the relative uncertainty of the SOCD 174
change over each region and grassland type (Ding et al., 2016). All analyses were performed 175
using R software (R Development Core Team, 2014). 176
177
3 Results 178
3.1 Topsoil C changes and its uncertainty 179
We tested the performance of the RF and ANN algorithms according to the root mean square 180
error (RMSE) and determined the coefficient of variation (r2) through 5000 iterations. Positive 181
linear relationships were observed between the measured and predicted SOCD during the 1980s 182
Biogeosciences Discuss., doi:10.5194/bg-2016-473, 2017Manuscript under review for journal BiogeosciencesPublished: 2 January 2017c© Author(s) 2017. CC-BY 3.0 License.

9
and 2000s; the mean r2 was 0.73 for RF and 0.62 for ANN, and the mean RMSE was 1.98 for RF 183
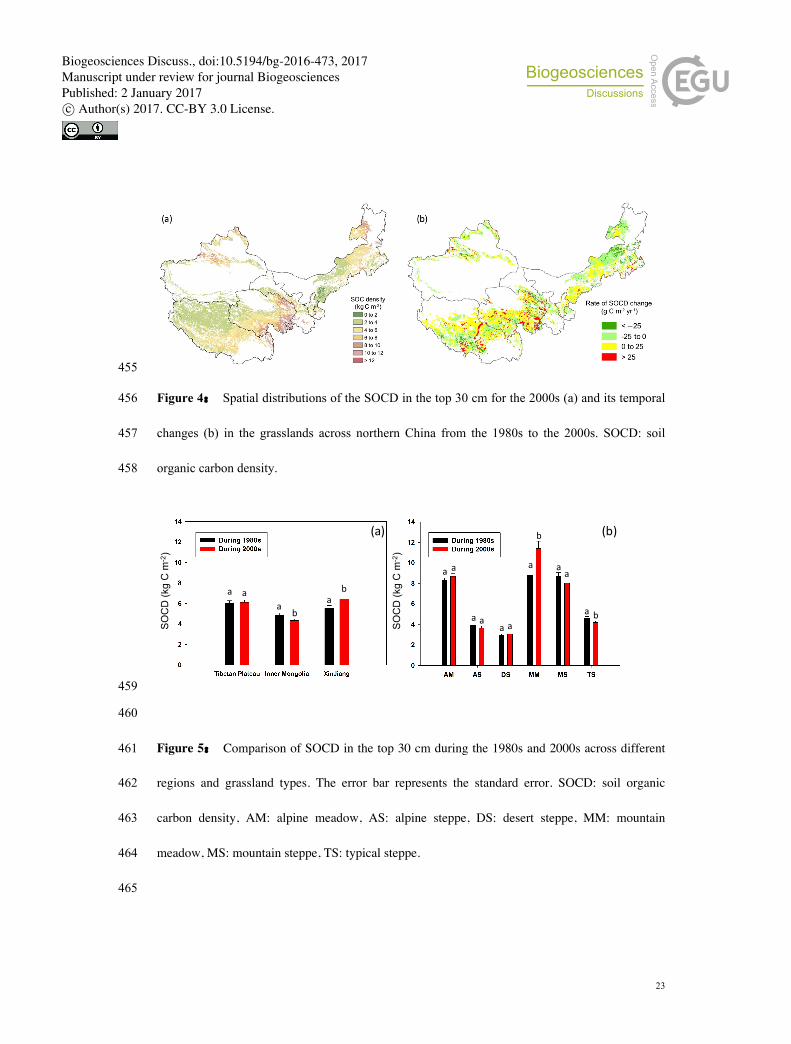
and 2.39 for ANN (Fig. 3), demonstrating that both algorithms generated accurate and dependable 184
predictions of SOCD during both time periods. 185
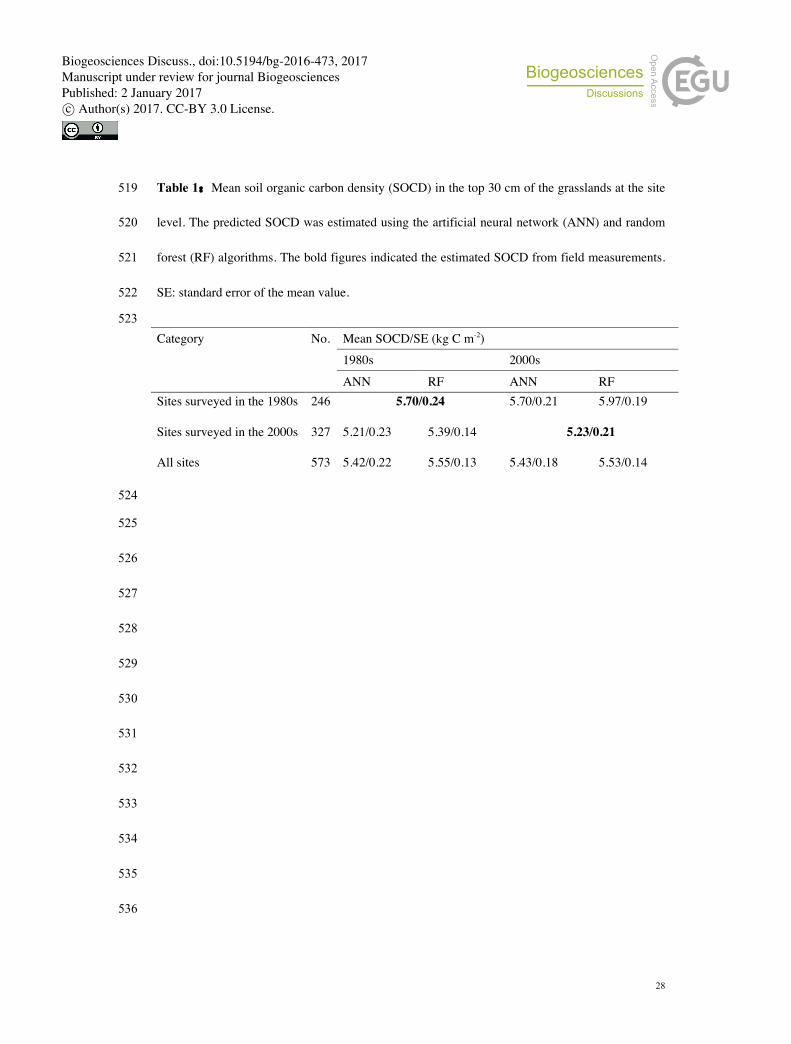
The SOCD during the 1980s for the sites surveyed in the 2000s was estimated as 5.21 kg C 186
m-2 using the ANN approach and 5.39 kg C m-2 using the RF approach (Table 1). The SOCD 187
during the 2000s for the sites surveyed in the 1980s was estimated as 5.70 kg C m-2 (ANN) and 188
5.97 kg C m-2 (RF). The comparison between the actual measurements and the predictions from 189
both approaches showed that there were no significant differences in these two methods (paired 190
t-test, P > 0.05), suggesting that the ANN and RF methods generated accurate estimates. Notably, 191
we only presented RF estimates in further analyses because of a higher r2 and lower RMSE. 192
By summarizing the estimates based on the measured SOCD profiles combined with the 193
predicted data, we estimated the mean SOCD from 573 sites as 5.55 kg C m-2 and 5.53 kg C m-2 194
for the 1980s and 2000s, respectively. A paired t-test indicated that the SOCD during the 2000s 195
was not significantly different from the corresponding value in the 1980s at the site level (P = 196
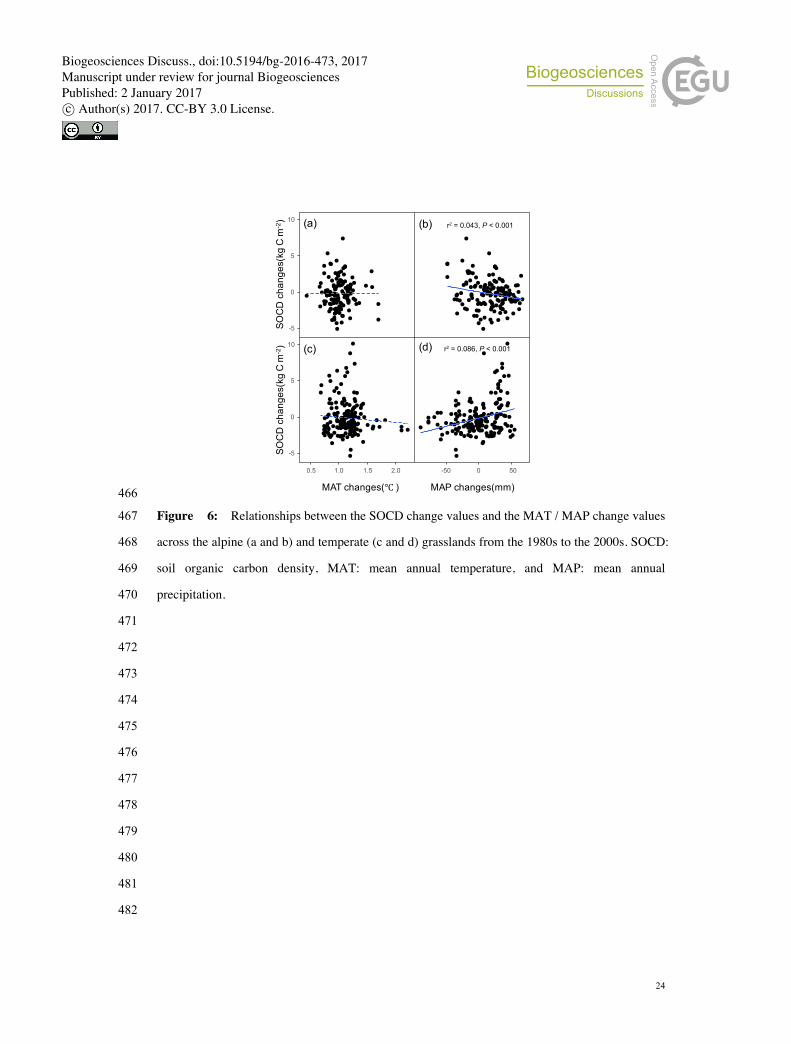
0.81), the change amounted to -0.17~ 0.22 kg C m-2 at the 95% confidence level. Taking the area 197
of each grassland type into consideration, the total change in the SOC stock in the upper 30 cm 198
depth was estimated as 11.03 Pg C in the 1980s and 11.16 Pg C in the 2000s. The overall rate of 199
the change in the SOCD at this depth was 3.68 g C m-2 yr-1 (Table 2). 200
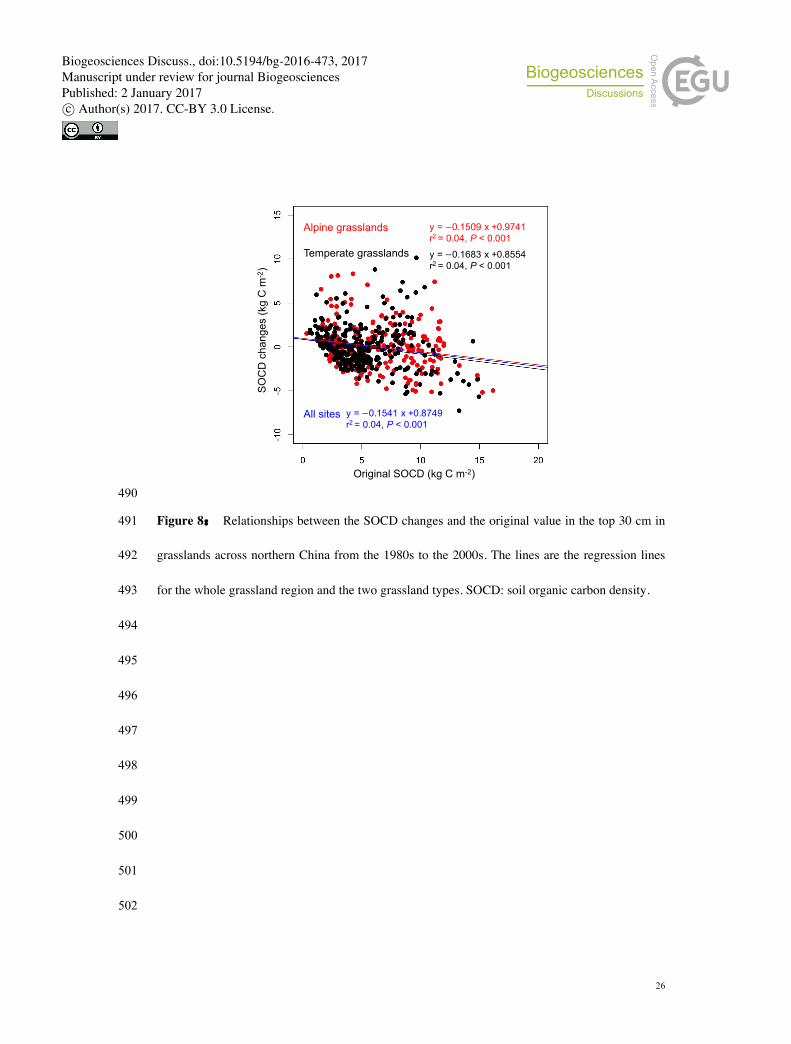
201
3.2 SOCD changes in different grassland types and regions 202
We illustrated spatial distributions in the SOCD in the topsoil in the 2000s (Fig. 4a) and its 203
changes between the 1980s and 2000s (Fig. 4b) using the RF approach. Although there was no 204
significant difference between the mean SOCD in the 2000s and the corresponding value in the 205
Biogeosciences Discuss., doi:10.5194/bg-2016-473, 2017Manuscript under review for journal BiogeosciencesPublished: 2 January 2017c© Author(s) 2017. CC-BY 3.0 License.

10
1980s at the site level (Tables 1, 2 and 3), the spatial distribution and temporal change of SOCD 206
among different regions and grassland types were markedly different (Fig. 4). The mean SOCD 207
decreased significantly in Inner Mongolia (4.86 vs. 4.33 kg C m-2, P < 0.01), at an average rate of 208
-28.46 g C m-2 yr-1, but increased significantly in Xinjiang (5.55 vs. 6.46 kg C m-2, P < 0.01), at an 209
average rate of 70.36g C m-2 yr-1. The SOCD was relatively stable in the Tibetan alpine grasslands 210
(6.12 vs. 6.06 kg C m-2, P = 0.70) (Fig. 5a). When considering the different grassland types, the 211
mean SOCD increased significantly in the MM and decreased significantly in the TS, but no 212
significant changes occurred in the AS, MS, AM and DS (Fig. 5b). 213
214
3.3 Effects of climate and soil geochemistry on SOCD changes 215
The SOCD change values for the temperate grasslands decreased with the temperature of spring 216
and summer (P < 0.01) and increased with the precipitation change values (P < 0.01) (Figure 6 217
and 7). However, in the alpine grasslands, the SOCD change values decreased with the MAP 218
change values (P < 0.01), and there was no significant trend related to other annual or seasonal 219
temperature change values (Fig. 6 and 7). Moreover, we found a significant negative linear 220
correlation between the change in SOCD and the original SOCD (P < 0.01, Fig. 8) across northern 221
China. This relationship was also observed in the temperate and alpine grasslands (P < 0.01 , Fig. 222
8). 223
224
4 Discussion 225
4.1 SOC changes in China’s grasslands 226
Several studies have explored SOC dynamics across China’s grasslands and presented 227
considerably different and even contrasting estimates because various approaches were used 228
Biogeosciences Discuss., doi:10.5194/bg-2016-473, 2017Manuscript under review for journal BiogeosciencesPublished: 2 January 2017c© Author(s) 2017. CC-BY 3.0 License.
11
(Table 4). For example, Huang et al. (2010) estimated the C sink rate in soils of Chinese 229
grasslands as 4.9±1.9 Tg C yr-1 (from 1981 to 2000). In contract, Xie et al. (2007) claimed that 230
Chinese grasslands experienced tremendous C losses in soil (-178.2 Tg C yr-1). In a recent study, 231
Yang et al. (2010) noted that there were insignificant changes in the SOC of grasslands in 232
northern China, based on a comparison between historical national soil inventory data and their 233
field soil campaign data. In the current study, we used a machine learning approach, national soil 234
inventory data and our own field survey and concluded that while Chinese grasslands remained an 235
neutral SOC sink, but it was spatially heterogeneous during the 1980s to the 2000s. 236
The uncertainties in the estimation of SOC changes are largely induced by insufficient 237
observations and methodological issues (Yang et al., 2014). In this study, we used two machine 238
learning algorithms (i.e., ANN and RF) to estimate the SOCD in the 2000s for sites that were only 239
surveyed in the 1980s, and vice versa. These algorithms generated promising predictions with 240
high coefficients of determination (r2) and low RMSE values. For both approaches, we integrated 241
field-based measurements and related environmental factors to train the models and thus acquired 242
comparable SOCD values for the two time periods at each site by generating reliable SOCD 243
predictions for unsurveyed sites at each time period. The underlying assumptions of this approach 244
were that the grassland type and soil texture did not change substantially in two decades, and the 245
SOCD change was driven by the balance of C inputs from vegetation litter (inferred from 246
Temperature, Precipitation and NDVI) and SOC decomposition (inferred from Temperature and 247
Precipitation). Compared with other widely used spatial extrapolation methods, such as 248
Kriging-based interpolations, a machine learning method combined with multiple sources of 249
relevant information shows better performance in theory and practice (Table S1)(Li et al., 2013). 250
Biogeosciences Discuss., doi:10.5194/bg-2016-473, 2017Manuscript under review for journal BiogeosciencesPublished: 2 January 2017c© Author(s) 2017. CC-BY 3.0 License.

12
Although we used an improved approach that integrates field survey data into machine 251
learning-based models to determine SOCD dynamics, there are some uncertainties in our study 252
(Table 3). The major sources of the uncertainties may originate from the models and their input 253
variables, as well as changes in land cover. First, the uncertainties and errors of the input variables 254
of the models may generate uncertainties in our estimations. For example, the lack of bulk density 255
data for some soil profiles may result in uncertainties in our estimates because bulk density is a 256
key variable for calculating SOCD. However, Yang et al. (2010) developed a well-quantified 257
relationship between bulk density and SOC (r2 = 0.63), and using it may not result in a large bias 258
in our analysis. Climate data (i.e., MAT and MAP) are also a source of uncertainty because they 259
are based on spatial interpolations. Furthermore, uneven spatial distribution of field measurements 260
may also introduce additional uncertainties. 261
Second, we used two machine learning models (ANN and RF) to predict regional SOCD 262
distribution from field-based observations, which will certainly produce some uncertainties 263
because model simulation is sensitive to upscaling, and the extrapolation ability of any model is 264
limited. However, the simulation performance of both models (ANN and RF) illustrated a good 265
agreement between the predicted and field-observed SOCD (Fig. 3). This suggests that the models 266
we used are appropriate for the estimation of SOC in Chinese grasslands. Finally, we did not 267
consider the effects of land cover changes on the estimation of SOCD dynamics, which may 268
introduce some uncertainties. However, there were no substantial land cover changes across most 269
of the study region; thus, it is likely that the estimation was not greatly biased. 270
271
272
273
Biogeosciences Discuss., doi:10.5194/bg-2016-473, 2017Manuscript under review for journal BiogeosciencesPublished: 2 January 2017c© Author(s) 2017. CC-BY 3.0 License.
13
4.2 Effects of climate changes on SOC changes in different grassland types 274
As shown in Fig. 6 and 7, climate change may play a critical role in controlling the SOCD 275
changes, and different grassland types (alpine and temperate grasslands) revealed different 276
responses to climate change. Increasing temperature, especially spring and summer maximum 277
temperature, induced a C loss from the topsoil of temperate grasslands (P < 0.001), but this trend 278
was not observed in the Tibetan alpine grasslands where the topsoil SOC remained relatively 279
stable (P = 0.70). The decrease in the topsoil C of the temperate grasslands may be caused by 280
increased substrate utilization efficiencies of soil microbial communities (Zogg et al., 1997) and 281
decreased C input into soil due to reduced biomass when temperature increases in growing season 282
(Yang et al., 2010). On the other hand, no significant change in SOC in the alpine grasslands has 283
been shown by soil warming manipulation experiments (Zhang et al. 2015) and a soil 284
transplantation experiment (Yue et al. 2015). 285
Precipitation is another critical factor that affected the SOCD change (Table 3). With an 286
increase in precipitation, the SOCD increased in temperate grasslands (P < 0.0001) and decreased 287
in alpine grasslands (P < 0.001). The underlying mechanisms that change in precipitation affects 288
the SOC change in grassland ecosystems are complex (Bellamy et al., 2005). On the one hand, 289
increased precipitation leads to an increase in plant growth and biomass and thus increased C 290
input into soils in dry climates; on the other hand, it increases soil respiration and therefore 291
enhances C emissions from soils (Thomey et al., 2011; Zhang et al., 2015). In very cold and 292
humid regions, such an interaction between the SOC and changes in precipitation may produce an 293
opposite result. Because we did not have regional soil respiration data in this study, we only 294
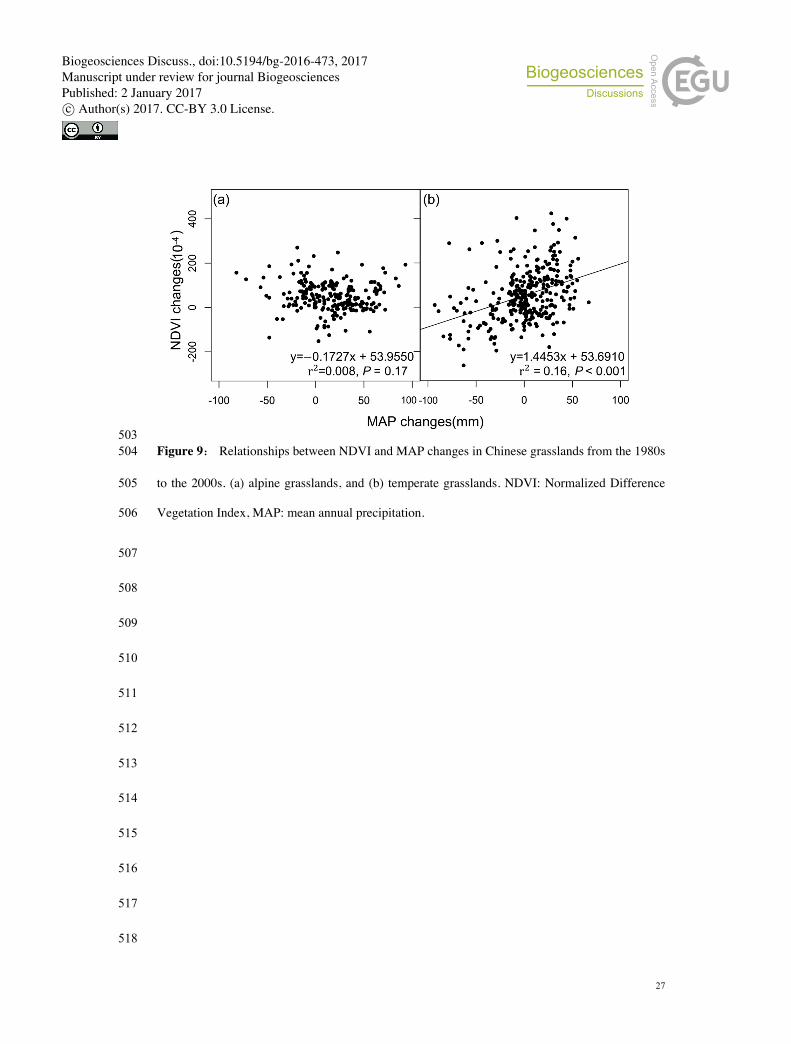
examined how changes in precipitation affect plant growth in the temperate and alpine grasslands, 295
using NDVI as an indicator of vegetation growth (Piao et al., 2005). There was a significantly 296
positive relationship between the precipitation and NDVI changes in the temperate grasslands 297
(Fig. 7a), while no such trend was found in the alpine grasslands (Fig. 7b). This suggests that 298
increased precipitation does not significantly influence the SOC in alpine grasslands but could 299
accelerate vegetation growth and therefore increase C input into the soil in temperate grasslands. 300
Biogeosciences Discuss., doi:10.5194/bg-2016-473, 2017Manuscript under review for journal BiogeosciencesPublished: 2 January 2017c© Author(s) 2017. CC-BY 3.0 License.
14
5 Conclusion 301
In summary, we integrated field survey data into two machine learning algorithms (ANN and RF) 302
to estimate the SOC stocks and dynamics in grasslands of northern China. We found that the 303
overall SOC stocks did not change significantly between the 1980s and the 2000s, which indicates 304
that the soils of these northern grasslands are a neutral C sink. Despite this overall stable SOC 305
stock, there were large spatial differences in the SOCD changes between different regions and 306
grassland types, suggesting differences in the climate changes and in the interactions between 307
ecosystem C processes and climate systems. Our analysis indicated that the SOC exhibited a 308
positive feedback to climate warming in the temperate grasslands, while this was not found for the 309
alpine grasslands. In addition, the response of the SOCD dynamics to the changes in precipitation 310
depended on grassland type. 311
312
313
314
Acknowledgements 315
This study was funded by the National Basic Research Program of China on Global Change 316
(2014CB954001), the National Natural Science Foundation of China (31330012, 31321061, 317
31470525), and the Strategic Priority Research Program of the Chinese Academy of Sciences 318
(XDA05050000). 319
320
321
322
323
Biogeosciences Discuss., doi:10.5194/bg-2016-473, 2017Manuscript under review for journal BiogeosciencesPublished: 2 January 2017c© Author(s) 2017. CC-BY 3.0 License.

15
References 324
Batjes, N.H. (1996) Total carbon and nitrogen in the soils of the world. European Journal of Soil 325
Science, 47, 151-163. 326
Bellamy, P.H., Loveland, P.J., Bradley, R.I., Lark, R.M. and Kirk, G.J. (2005) Carbon losses from 327
all soils across England and Wales 1978-2003. Nature, 437, 245-8. 328
Chinese Academy of Sciences. (2001) Vegetation atlas of China. Science Press, Beijing. 329
Ciais, P., Sabine, C., Bala, G., Bopp, L., Brovkin, V., Canadell, J., Chhabra, A., Defries, R., 330
Galloway, J. and Heimann, M. (2013) Carbon and other biogeochemical cycles. 465-570. 331
Dai, E., Zhai, R., Ge, Q. and Wu, X. (2014) Detecting the storage and change on topsoil organic 332
carbon in grasslands of Inner Mongolia from 1980s to 2010s. Journal of Geographical 333
Sciences, 24, 1035-1046. 334
Davidson, E.A. and Janssens, I.A. (2006) Temperature sensitivity of soil carbon decomposition 335
and feedbacks to climate change. Nature, 440, 165-73. 336
Ding, J., Li, F., Yang, G., Chen, L., Zhang, B., Liu, L., Fang, K., Qin, S., Chen, Y., Peng, Y., Ji, 337
C., He, H., Smith, P. and Yang, Y. (2016) The permafrost carbon inventory on the Tibetan 338
plateau: a new evaluation using deep sediment cores. Global Change Biology, 22(8). 339
Emmett, B.A., Reynolds, B., Chamberlain, P.M., Rowe, E., Spurgeon, D., Brittain, S.A., 340
Frogbrook, Z., Hughes, S., Lawlor, A.J. and Poskitt, J. (2010) Countryside Survey: Soils 341
Report from 2007. NERC/Centre for Ecology and Hydrology, 342
Fang, J., Yang, Y., Ma, W., Mohammat, A. and Shen, H. (2010) Ecosystem carbon stocks and 343
their changes in China's grasslands. Science China Life Sciences, 53, 757-65. 344
Feng, R. and Wang, F. (1993) Soil Species of Gansu. Gansu Science and Technology Press, 345
Lanzhou. 346
Biogeosciences Discuss., doi:10.5194/bg-2016-473, 2017Manuscript under review for journal BiogeosciencesPublished: 2 January 2017c© Author(s) 2017. CC-BY 3.0 License.
16
Gong, D. (1994) Soil Species of Xizang Autonomous Region. Science Press, Beijing. 347
Grimm, R., Behrens, T., Märker, M. and Elsenbeer, H. (2008) Soil organic carbon concentrations 348
and stocks on Barro Colorado Island — Digital soil mapping using Random Forests 349
analysis. Geoderma, 146, 102-113. 350
Hanegraaf, M.C., Hoffland, E., Kuikman, P.J. and Brussaard, L. (2009) Trends in soil organic 351
matter contents in Dutch grasslands and maize fields on sandy soils. European Journal of 352
Soil Science, 60, 213-222. 353
Hastie, T.J., Tibshirani, R.J. and Friedman, J.H. (2009) The Elements Of Statistical Learning 2nd 354
edition. Springer. 355
Hou, Z. and Zeng, Q. (1992) Soil Species of Xinjiang Uygur Autonomous Region. Xinjiang 356
Medical Science and Technology Press, Urumqi. 357
Huang, Y., Sun, W., Zhang, W. and Yu, Y. (2010) Changes in soil organic carbon of terrestrial 358
ecosystems in China: a mini-review. Science China Life Sciences, 53, 766-775. 359
Johnson, D.W., Todd, D.E., Trettin, C.F. and Sedinger, J.S. (2007) Soil Carbon and Nitrogen 360
Changes in Forests of Walker Branch Watershed, 1972 to 2004. Soil Science Society of 361
America Journal, 71, 1639-1646. 362
Li, Q., Yue, T., Wang, C., Zhang, W., Yu, Y., Li, B., Yang, J. and Bai, G. (2013) Spatially 363
distributed modeling of soil organic matter across China: An application of artificial 364
neural network approach. Catena, 104, 210-218. 365
Liu, S. (1995) Soil Species of Qinghai. China Agricultural Press, Beijing. 366
Mestdagh, I., Sleutel, S., Lootens, P., Cleemput, O.V., Beheydt, D., Boeckx, P., Neve, S.D., 367
Hofman, G., Camp, N.V. and Walle, I.V. (2009) Soil organic carbon stock changes in 368
Biogeosciences Discuss., doi:10.5194/bg-2016-473, 2017Manuscript under review for journal BiogeosciencesPublished: 2 January 2017c© Author(s) 2017. CC-BY 3.0 License.

17
Flemish grassland soils from 1990 to 2000. Journal of Plant Nutrition and Soil Science, 369
172, 24–31. 370
Nelson, D.W., Sommers, L.E., Sparks, D.L., Page, A.L., Helmke, P.A., Loeppert, R.H., 371
Soltanpour, P.N., Tabatabai, M.A., Johnston, C.T. and Sumner, M.E. (1982) Total carbon, 372
organic carbon, organic matter. In: Methods of Soil Analysis (ed. Page AL), American 373
Society of Agronomy, Madison. 374
Piao, S., Fang, J., Liu, H. and Zhu, B. (2005) NDVI-indicated decline in desertification in China 375
in the past two decades. Geophysical Research Letters, 32, 347-354. 376
Sreenivas, K., Sujatha, G., Sudhir, K., Kiran, D.V., Fyzee, M.A., Ravisankar, T. and Dadhwal, 377
V.K. (2014) Spatial Assessment of Soil Organic Carbon Density Through Random Forests 378
Based Imputation. Journal of the Indian Society of Remote Sensing, 42, 1-11. 379
R Development Core Team. (2014) R: a language and environment for statistical computing. R 380
Foundation for Statistical Computing, Vienna. 381
Thomey, M.L., Collins, S.L., Vargas, R., Johnson, J.E., Brown, R.F., Natvig, D.O. and Friggens, 382
M.T. (2011) Effect of precipitation variability on net primary production and soil 383
respiration in a Chihuahuan Desert grassland. Global Change Biology, 17, 1505-1515. 384
Tucker, C.J., Pinzon, J.E., Brown, M.E., Slayback, D.A., Pak, E.W., Mahoney, R., Vermote, E.F. 385
and Saleous, N.E. (2005) An extended AVHRR 8-km NDVI dataset compatible with 386
MODIS and SPOT vegetation NDVI data. International Journal of Remote Sensing, 26, 387
4485-4498. 388
Wu, H., Guo, Z. and Peng, C. (2003) Distribution and storage of soil organic carbon in China. 389
Global Biogeochemical Cycles, 17, 67-80. 390
Biogeosciences Discuss., doi:10.5194/bg-2016-473, 2017Manuscript under review for journal BiogeosciencesPublished: 2 January 2017c© Author(s) 2017. CC-BY 3.0 License.
18
Wu, Y. (1991) Soil Species of Ningxia Hui Autonomous Region. Ningxia People’s Press, 391
Yinchuan. 392
Xie, Z., Zhu, J., Liu, G., Cadisch, G., Hasegawa, T., Chen, C., Sun, H., Tang, H. and Zeng, Q. 393
(2007) Soil organic carbon stocks in China and changes from 1980s to 2000s. Global 394
Change Biology, 13, 1989-2007. 395
Yan, L., Zhou, G., Wang, Y., Hu, T. and Sui, X. (2015) The spatial and temporal dynamics of 396
carbon budget in the alpine grasslands on the Qinghai-Tibetan Plateau using the Terrestrial 397
Ecosystem Model. Journal of Cleaner Production, 108, 189-196. 398
Yang, Y., Fang, J., Smith, P., Tang, Y., Chen, A., Ji. C., Hu, H., Rao, S.,Tan, K. and He, J.(2009). 399
Changes in topsoil carbon stock in the Tibetan grasslands between the 1980s and 400
2004. Global Change Biology, 15(11), 2723-2729. 401
Yang, Y., Fang, J., Tang, Y., Ji, C., Zheng, C., He, J. and Zhu, B. (2008) Storage, patterns and 402
controls of soil organic carbon in the Tibetan grasslands. Global Change Biology, 14, 403
1592-1599. 404
Yang, Y., Fang, J., Ma, W., Smith, P., Mohammat, A., Wang, S. and Wang, W. (2010) Soil 405
carbon stock and its changes in northern China's grasslands from 1980s to 2000s. Global 406
Change Biology, 16, 3036–3047. 407
Yang, Y., Li, P., Ding, J., Zhao, X., Ma, W., Ji, C. and Fang, J. (2014) Increased topsoil carbon 408
stock across China's forests. Global Change Biology, 20, 2687-2696. 409
Yue, H., Wang, M., Wang, S., Gilbert, J.A., Sun, X., Wu, L., Lin, Q., Hu, Y., Li, X., He, Z., Zhou, 410
J. and Yang, Y. (2015) The microbe-mediated mechanisms affecting topsoil carbon stock 411
in Tibetan grasslands. ISME Journal, 9, 2012-2020. 412
Biogeosciences Discuss., doi:10.5194/bg-2016-473, 2017Manuscript under review for journal BiogeosciencesPublished: 2 January 2017c© Author(s) 2017. CC-BY 3.0 License.
19
Zhang, X., Shen, Z. and Fu, G. (2015) A meta-analysis of the effects of experimental warming on 413
soil carbon and nitrogen dynamics on the Tibetan Plateau. Applied Soil Ecology, 87, 414
32-38. 415
Zhang, Y., Tang, Y., Jiang, J. and Yang, Y. (2007) Characterizing the dynamics of soil organic 416
carbon in grasslands on the Qinghai-Tibetan Plateau. Science in China, 50, 113-120. 417
Zhao, J. (1993) Soil Species of Neimeng Autonomous Region. China Agricultural Press, Beijing. 418
Zogg, G.P., Zak, D.R., Ringelberg, D.B., White, D.C., MacDonald, N.W. and Pregitzer, K.S. 419
(1997) Compositional and Functional Shifts in Microbial Communities Due to Soil 420
Warming. Soil Science Society of America Journal, 61, 475-481. 421
422
423
424
425
426
427
428
Biogeosciences Discuss., doi:10.5194/bg-2016-473, 2017Manuscript under review for journal BiogeosciencesPublished: 2 January 2017c© Author(s) 2017. CC-BY 3.0 License.
20
429
Figure 1� Location of the study area and sampling sites during the 1980s and 2000s shown the 430
background of China’s vegetation map (Chinese Academy of Sciences, 2001). 431
432
433
434
435
Biogeosciences Discuss., doi:10.5194/bg-2016-473, 2017Manuscript under review for journal BiogeosciencesPublished: 2 January 2017c© Author(s) 2017. CC-BY 3.0 License.

21
436
Figure 2� Methodology used for observing SOCD changes during the 1980s and 2000s. SOCD: 437
soil organic carbon density, NDVI: Normalized Difference Vegetation Index, MAT: mean annual 438
temperature, MAP: mean annual precipitation, ANN: artificial neural network, and RF: random 439
forest. 440
441
442
443
444
445
SOC observationsfrom the 1980s
ANN/RF model validation
ANN/RF model construction
SOCD during the 1980s forsites surveyed in the 2000s
SOCD during the 1980sfor all sites
Mod
el in
put
12
Mod
el p
redi
ctio
nD
ata
synt
hesi
s
3
SOCD during the 2000sfor all sites
Similar methodology
Values for sites surveyed during the 1980s
Values for sites surveyed during the 2000s
Optimizedmodel parameters
SOCD changes for all sitesfrom the 1980s to the 2000s
Environmental parameters during the 1980s:(Location, altitude, soil texture, Vegetation information,
NDVI, MAP, MAT, seasonal climate variables )
v vValues for sites surveyed during the 1980s
Values for sites surveyed during the 2000s
Biogeosciences Discuss., doi:10.5194/bg-2016-473, 2017Manuscript under review for journal BiogeosciencesPublished: 2 January 2017c© Author(s) 2017. CC-BY 3.0 License.
22
446
Figure 3� Comparison between measured and predicted SOCD simulated using the ANN (a and 447
c) and RF approaches (b and d) during the test process. The diagonal is the 1:1 line. SOCD: soil 448
organic carbon density, ANN: artificial neural network, RF: random forest, r2: coefficient of 449
determination, RMSE: root mean square error. 450
451
452
453
454
Biogeosciences Discuss., doi:10.5194/bg-2016-473, 2017Manuscript under review for journal BiogeosciencesPublished: 2 January 2017c© Author(s) 2017. CC-BY 3.0 License.
23
455
Figure 4� Spatial distributions of the SOCD in the top 30 cm for the 2000s (a) and its temporal 456
changes (b) in the grasslands across northern China from the 1980s to the 2000s. SOCD: soil 457
organic carbon density. 458
459
460
Figure 5� Comparison of SOCD in the top 30 cm during the 1980s and 2000s across different 461
regions and grassland types. The error bar represents the standard error. SOCD: soil organic 462
carbon density, AM: alpine meadow, AS: alpine steppe, DS: desert steppe, MM: mountain 463
meadow, MS: mountain steppe, TS: typical steppe. 464
465
(a) (b)
a aa
ba
b
a a
a aa a
a
b
aa
a b
SOC
D (k
g C
m-2
)
SOC
D (k
g C
m-2
)
Biogeosciences Discuss., doi:10.5194/bg-2016-473, 2017Manuscript under review for journal BiogeosciencesPublished: 2 January 2017c© Author(s) 2017. CC-BY 3.0 License.
24
466
Figure 6: Relationships between the SOCD change values and the MAT / MAP change values 467
across the alpine (a and b) and temperate (c and d) grasslands from the 1980s to the 2000s. SOCD: 468
soil organic carbon density, MAT: mean annual temperature, and MAP: mean annual 469
precipitation. 470
471
472
473
474
475
476
477
478
479
480
481
482
-5
0
5
10
SO
C
-5
0
5
10
0.5 2.0
mat2000
SO
C
-50
map2000
1.0 1.5 500
r2 = 0.086, P < 0.001
r2 = 0.043, P < 0.001
MAT changes(℃) MAP changes(mm)
SOC
D c
hang
es(k
g C
m-2
)SO
CD
cha
nges
(kg
C m
-2)
(a)
(c)
(b)
(d)
Biogeosciences Discuss., doi:10.5194/bg-2016-473, 2017Manuscript under review for journal BiogeosciencesPublished: 2 January 2017c© Author(s) 2017. CC-BY 3.0 License.

25
483 Figure7: Relationships between the SOCD change values and the seasonal maximum temperature 484
change values across the alpine (a, c, e and g) and temperate (b, d, f and h) grasslands from the 485
1980s to the 2000s. SOCD: soil organic carbon density. 486
487
488
489
-5
0
5
10
Stage9S
OC
-5
0
5
10
Stage15
SO
C
-5
0
5
10
Stage21
SO
C
-5
0
5
10
Stage27
SO
C
r2 = 0.057, P < 0.001
r2 = 0.12, P < 0.001
r2 = 0.14, P < 0.001
0 2.0 4.0 0 2.0 4.0
-5
0
5
10
-10
SOC
-5
0
5
10
Stage13
SOC
-5
0
5
10
Stage19
SOC
-5
0
5
10
Stage25
SOC
r2 = 0.025, P < 0.05
r2 = 0.12, P < 0.001
100 20 -10 100 20
-40 400 -40 400
-20 100 20-10 -20 100 20-10
-5 105 150 -5 105 150
Seasonal Maximum Temperature changes (℃)
SOCD
cha
nges
(kg
C m
-2)
SOCD
cha
nges
(kg
C m
-2)
SOCD
cha
nges
(kg
C m
-2)
SOCD
cha
nges
(kg
C m
-2)
(a) Spring
(c) Summer
(e) Autumn
(g) Winter
(f) Autumn
(h) Winter
(d) Summer
(b) Spring
Biogeosciences Discuss., doi:10.5194/bg-2016-473, 2017Manuscript under review for journal BiogeosciencesPublished: 2 January 2017c© Author(s) 2017. CC-BY 3.0 License.
26
490
Figure 8� Relationships between the SOCD changes and the original value in the top 30 cm in 491
grasslands across northern China from the 1980s to the 2000s. The lines are the regression lines 492
for the whole grassland region and the two grassland types. SOCD: soil organic carbon density. 493
494
495
496
497
498
499
500
501
502
Alpine grasslands
Temperate grasslands
All sites
y = −0.1509 x +0.9741r2 = 0.04, P < 0.001y = −0.1683 x +0.8554r2 = 0.04, P < 0.001
y = −0.1541 x +0.8749r2 = 0.04, P < 0.001
Original SOCD (kg C m-2)
SOC
D c
hang
es (k
g C
m-2
)
Biogeosciences Discuss., doi:10.5194/bg-2016-473, 2017Manuscript under review for journal BiogeosciencesPublished: 2 January 2017c© Author(s) 2017. CC-BY 3.0 License.
27
503 Figure 9� Relationships between NDVI and MAP changes in Chinese grasslands from the 1980s 504
to the 2000s. (a) alpine grasslands, and (b) temperate grasslands. NDVI: Normalized Difference 505
Vegetation Index, MAP: mean annual precipitation. 506
507
508
509
510
511
512
513
514
515
516
517
518
Biogeosciences Discuss., doi:10.5194/bg-2016-473, 2017Manuscript under review for journal BiogeosciencesPublished: 2 January 2017c© Author(s) 2017. CC-BY 3.0 License.
28
Table 1�Mean soil organic carbon density (SOCD) in the top 30 cm of the grasslands at the site 519
level. The predicted SOCD was estimated using the artificial neural network (ANN) and random 520
forest (RF) algorithms. The bold figures indicated the estimated SOCD from field measurements. 521
SE: standard error of the mean value. 522
523
524
525
526
527
528
529
530
531
532
533
534
535
536
Category No. Mean SOCD/SE (kg C m-2) 1980s 2000s ANN RF ANN RF
Sites surveyed in the 1980s 246 5.70/0.24 5.70/0.21 5.97/0.19
Sites surveyed in the 2000s 327 5.21/0.23 5.39/0.14 5.23/0.21
All sites 573 5.42/0.22 5.55/0.13 5.43/0.18 5.53/0.14
Biogeosciences Discuss., doi:10.5194/bg-2016-473, 2017Manuscript under review for journal BiogeosciencesPublished: 2 January 2017c© Author(s) 2017. CC-BY 3.0 License.

29
Table 2�
Changes in topsoil (0-30 cm) SO
C in grasslands across northern China from the 1980s to the 2000s. Estim
ates of area-weighted SO
C density
and stocks were based on actual m
easured profiles and the predicted SOCD
simulated using the random
forest (RF) method. SO
CD: soil organic carbon
density, AS, alpine steppe; A
M, alpine m
eadow; D
S, desert steppe; TS, typical steppe; MS, m
ountain steppe; MM
, mountain m
eadow; and SE, standard
error of the mean value.
540
Region G
rassland type
Area
/104km
N
o. Sites sam
pled
Area-w
eighted mean SO
CD/SE
(kg C m-2)
Area-w
eighted SOC stock/SE
(Pg C) Rate of SO
CD change
(g C m-2yr
-1)
1980s 2000s
1980s 2000s
Inner Mongolia
DS
9.59 60
2.48/0.13 2.68/0.17
0.24/0.01 0.26/0.02
11.23 TS
28.65 105
4.54/0.15 4.01/0.15
1.30/0.04 1.15/0.04
-29.44 M
S 5.83
40 9.28/0.42
7.68/0.31 0.54/0.02
0.45/0.02 -88.92
Total 44.07
205 4.72
4.20 2.08
1.85 -28.46
Tibetan Plateau A
S 72.29
128 3.95/0.20
3.65/0.20 2.85/0.15
2.64/0.15 -16.68
AM
53.47
123 8.26/0.27
8.69/0.29 4.42/0.14
4.65/0.15 24.03
Total 125.76
251 5.78
5.79 7.27
7.29 0.63
Xinjiang
DS
6.15 51
3.48/0.16 3.56/0.26
0.21/0.01 0.22/0.02
4.16 TS
5.23 22
5.04/0.22 5.09/0.58
0.26/0.01 0.27/0.03
2.70 M
S 7.77
16 7.17/0.61
8.93/0.46 0.56/0.05
0.69/0.04 97.93
MM
7.36
28 8.79/0.41
11.39/0.70 0.65/0.03
0.84/0.05 144.65
Total 26.51
119 6.34
7.61 1.68
2.02 70.36
Northern China
Overall
196.34 573
5.61 5.68
11.03 11.16
3.68
Biogeosciences Discuss., doi:10.5194/bg-2016-473, 2017Manuscript under review for journal BiogeosciencesPublished: 2 January 2017c© Author(s) 2017. CC-BY 3.0 License.
30
Table 3: Estimate and relative uncertainty of SO
CD change of northern China grassland from
1980s to 2000s. Estimated m
edian SOCD
change with
interquartile range was generated by using 5000-iteration M
onte Claro resampling. SO
CD: soil organic carbon density, A
S, alpine steppe; AM
, alpine
meadow
; DS, desert steppe; TS, typical steppe; M
S, mountain steppe; M
M, m
ountain meadow
.
545
550
555
Grassland type
No.
of sites
SOC
D change(kg C
m-2)
Median
25 Percentile 75 Percentile
Alpine grasslands
251 0.14
-1.24 1.51
AS
128 -0.48
-1.85 0.90
AM
123
0.78 -0.59
2.15
Temperate grasslands
322 0.01
-1.25 1.29
DS
111 0.12
-1.12 1.41
MM
28
2.56 1.36
3.92
MS
55 -0.65
-1.84 0.69
TS 126
-0.40 -1.68
0.86
Total 573
-0.12 -1.42
1.17
Biogeosciences Discuss., doi:10.5194/bg-2016-473, 2017Manuscript under review for journal BiogeosciencesPublished: 2 January 2017c© Author(s) 2017. CC-BY 3.0 License.

31
Tables 4�
Previous estimations of carbon storage in the 2000s and its balance in Chinese grassland soil at different spatial scales using different
approaches over a comparable period.
Region
Method
Period A
rea
(106) ha)
Soil depth
(cm)
Carbon storage in the
2000s (Pg)
Carbon balance
(Tg C yr -1)
Ref.
Chinese grasslands
Literature synthesis 1980s-2000s
278.51 103.2
34.15 -178.2
Xie et al. (2007)
Literature synthesis
1981-2000 400
NA
N
A
4.9±1.6 H
uang et al. (2010)
northern Chinese
grasslands
Inventory K
riging-based
estimation
1980s-2000s 196.34
30 10.47
No
significant
change
Yang et al. (2010)
Inventory R
F-based
Estimation
1980s-2000s 196.34
30 11.16
No
significant
change
This study
Tibetan alpine grasslands Process-based m
odels 1961-2010
100 N
A
6.28-6.60 6
Yan et al. (2015)
Process-based models
1990-2002 147.74
20 9.72
Decrease
Zhang et al. (2007)
Inventory
satellite-based
estimation
1980s-2000s 112.82
30 4.99
-0.45±40.75 Y
ang et al. (2009)
Inventory R
F-based
Estimation
1980s-2000s 125.76
30 7.29
No significant
change
This study
Inner Mongolian grasslands
Inventory satellite-based
estimation
1980s-2010s 58.77
20 N
A
No
significant
change
Dai et al. (2014)
Inventory R
F-based
Estimation
1980s-2000s 44.07
30 1.85
-12.78 This study
northwest Chinese
(Xinjiang) grassland
Inventory RF-based
Estimation
1980s-2000s 26.51
30 2.20
18.89 This study
Biogeosciences Discuss., doi:10.5194/bg-2016-473, 2017Manuscript under review for journal BiogeosciencesPublished: 2 January 2017c© Author(s) 2017. CC-BY 3.0 License.