1 1 i:401098\40109880\pres\pan european deck 2004 eiaa european media consumption study ii...
TRANSCRIPT

1 1I:401098\40109880\Pres\Pan European Deck 2004
EIAA European Media Consumption Study II
Pan-European ResultsOctober 04
EIAA European Media Consumption Study II
Pan-European ResultsOctober 04

2 2I:401098\40109880\Pres\Pan European Deck 2004
EIAA Media Consumption Study II
• Annual survey of media consumption patterns across Europe based on consumer attitudinal data
• Objective:– Measure how consumers allocate their time across media options: TV,
Radio, Newspapers, Magazines and the Internet
• Methodology:– Random telephone interviews
– Nationally representative sample
– 1000 respondents per country: UK, FR, DE, ES and IT
– 500 respondents per country: Belgium, the Netherlands
– 333 respondents per country: Denmark, Sweden, and Norway
– Fieldwork completed September to October 2004

3 3I:401098\40109880\Pres\Pan European Deck 2004
Penetration by Media Type
96
79 77
5448
0
20
40
60
80
100
TV
Radio
Newsp
aper
Mag
azin
es
Inte
rnet
PercentOf
Respondents
TV remains the media of choice for most consumers with 96% of those studied watching something during a typical week
Penetration by Media Type
Base: All respondents
In a typical 5 day week, do you watch TV, read a newspaper or surf the internet? (note Magazines and Radio was during a typical 7 day week)
(7112)
4 4I:401098\40109880\Pres\Pan European Deck 2004
Internet Penetration
74 7264
53 52 50 4845 45
3734
0
20
40
60
80
100
Sw
eden
Nor
way
Net
her
lan
ds
Den
mar
k
Ger
man
y
UK
EU
Ave
rag
e
Fra
nce
Bel
giu
m
Ital
y
Spa
in
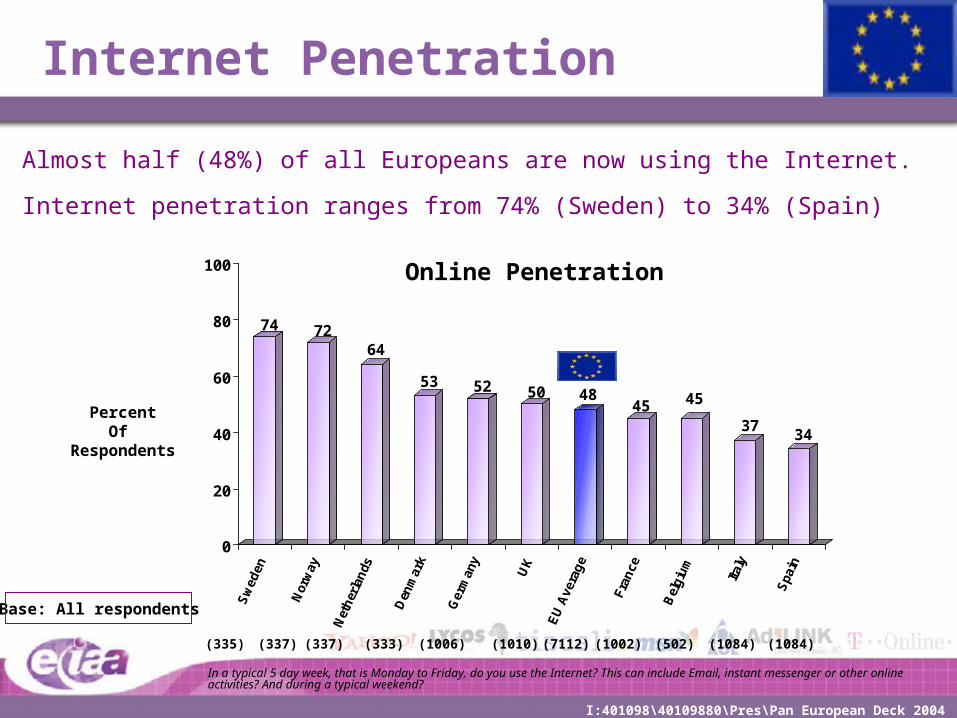
Almost half (48%) of all Europeans are now using the Internet.
Internet penetration ranges from 74% (Sweden) to 34% (Spain)
PercentOf
Respondents
Online Penetration
(335) (337) (337) (333) (1006) (1010) (7112) (1002) (502) (1084) (1084)
Base: All respondents
In a typical 5 day week, that is Monday to Friday, do you use the Internet? This can include Email, instant messenger or other online activities? And during a typical weekend?

5 5I:401098\40109880\Pres\Pan European Deck 2004
Penetration Growth
0
20
40
60
80
100
Swed
en
Norway
Netherla
nds
Denm
ark
Ger
man
yUK
EU Ave
rage
France
Belgiu
mIta
ly
Spain
Within 6 months
Within Year
Within 2 Years
Among those that are not already online, 20% plan to gain access within the next year
All of Norway plans to be online within 2 years
PercentOf
Non Users
Propensity to Gain Internet Access
Base: Non internet users
You stated that you currently do not use the internet, do you think you are likely to use it…?
(94) (276) (659)(182) (3669)(481)(155) (550)(498) (686)(88)

6 6I:401098\40109880\Pres\Pan European Deck 2004
Internet Usage Days
0
20
40
60
1 2 3 4 5 6 7
Usage Days per Week
PercentOf
InternetUsers
Among those online, 40% claim daily usage
Internet Usage Days
Base: Internet users
You stated you have internet access, during a typical 7 day week how many days do you go online?(3440)

7 7I:401098\40109880\Pres\Pan European Deck 2004
Daily Usage by Country
0
20
40
60
80
100
Belgiu
m
Denm
ark
France
Netherla
nds
Swed
en
EU Ave
rage
UKSpain
Ger
man
y
Norway
Italy
Daily usage is highest in Belgium at 57% of the online population, followed by Denmark and France
PercentOf
InternetUsers
(3440) (509) (525)(452) (342) (398)(320)(226) (178) (247) (243)
Daily Usage of Internet
Base: Internet users
You stated you have internet access, how many days per week do you go online?

8 8I:401098\40109880\Pres\Pan European Deck 2004
Daily Usage by Country
0
20
40
60
80
100
The percent of daily usage has grown (relative to last year) in UK, FR, DE, and ES
PercentOf
InternetUsers
(509) (525)(452) (342) (398)(320)(226) (178) (247) (243)
Daily Usage of Internet20042003
na na na na na
Base: Internet users
(3440)
Approximately how many days per week do you use the Internet?

9 9I:401098\40109880\Pres\Pan European Deck 2004
Hours Spent Surfing the Web
51
32
8 9
0
20
40
60
1 to 5 6 to 15 16 to 25 26 or more
Hours spent online during typical week
PercentOf
InternetUsers
Time Spent Online
Half of those studied use the Internet less than 5 hours per week.
However, one in ten are online more than 26 hours a week
Base: Internet users
In a typical 7 day week, approximately how many hours do you spend in total using the Internet?
(3440)

10 10I:401098\40109880\Pres\Pan European Deck 2004
Allocations by Media Type
0
25
50
75
100
In a typical 7 day week, approximately how many hours do you spend in total using the Internet, TV, Radio, etc?
PercentOf
SampleBy Media
Time Spent per Week
Less than 5 hours
6 to 15 hours
16 to 25 hours
More than 25 hoursPer week
Print (magazines and newspapers) have the lowest ‘involvement’ levels with60% or more of readers spending less than 5 hours per week reading
Base: Users of each medium
(3440) (6840) (5646) (3870) (5511)

11 11I:401098\40109880\Pres\Pan European Deck 2004
Time Spent by Media Type
17.12 16.50
10.78
5.163.88
0
5
10
15
20
Radio TV Internet Newspaper Magazines
Average Hours Spent by Media Type
AverageHours
ByMedia Type
The average internet user spends more than 10 hours online per week
(6840) (3440) (5511) (3870)(5646)Base: Users of
each medium
In a typical 7 day week, approximately how many hours do you spend…?
12 12I:401098\40109880\Pres\Pan European Deck 2004
Average Allocation by Media
TV33%
Newspapers10%Magazines
8%
Radio29%
Internet20%
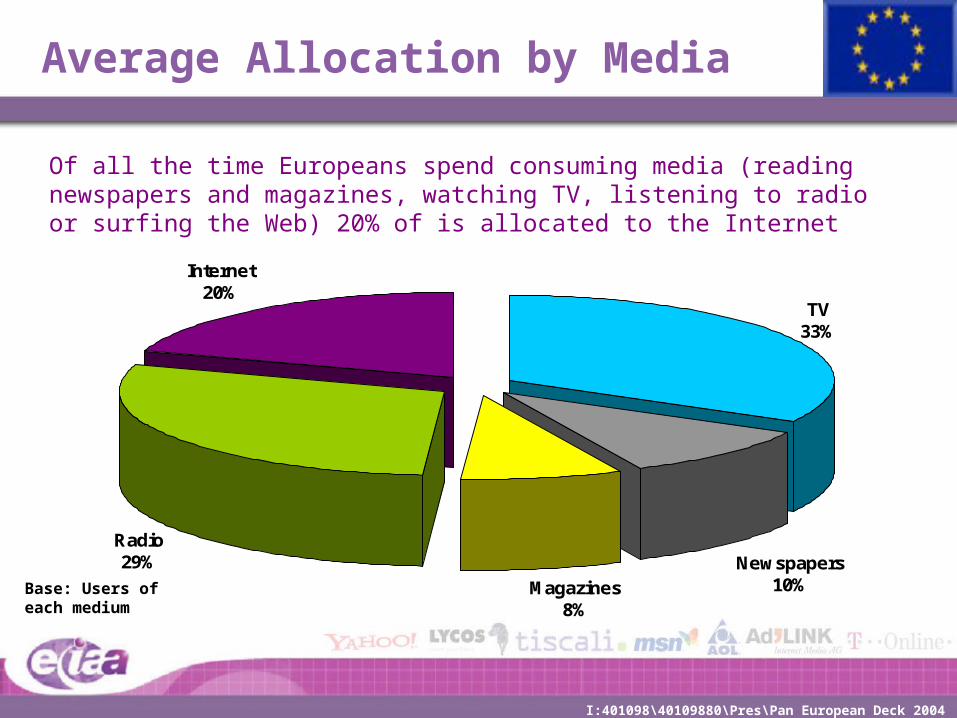
Of all the time Europeans spend consuming media (reading newspapers and magazines, watching TV, listening to radio or surfing the Web) 20% of is allocated to the Internet
Base: Users of each medium

13 13I:401098\40109880\Pres\Pan European Deck 2004
Cost of Increased Internet Usage
Watch TV 35%
Talk on the phone 27
Read Magazines 24
Read Newspapers 24
Read Books 22
Listen to Radio 16
Be Outdoors 15
Listen to Music 15
Exercise 13
Spend time w/Family and Friends 13
Work 10
One third of Europeans are watching less TV as a result of increased Internet usage One in four talk on the phone less, read fewer magazines and newspapers
‘Cost’ of Internet Usage by Activity
Base: Internet users
Q20:Which of the following do you do less often as a result of using the Internet?
(3440)

14 14I:401098\40109880\Pres\Pan European Deck 2004
Strengths of the Internet
0 20 40 60 80 100
You would be lost without it
A place where you can loseyourself
Favorite information source
For an active brain
Media that puts you in control
Media that keeps you ahead ofthe game
Has what you want when youwant it
Get what you want quick
Q: Which of these media do you think…?
The internet’s strength is that it gets you what you want quickly and when you need it, with 80% agreeing with that statement
One in four could not live without it.
Base: Users of all media
(1397)

15 15I:401098\40109880\Pres\Pan European Deck 2004
Internet Strengths vs. TV
0 20 40 60 80 100
You would be lost without it
A place where you can loseyourself
Favorite information source
For an active brain
Media that puts you in control
Media that keeps you ahead ofthe game
Has what you want when youwant it
Get what you want quick
Q: Which of these media do you think…?
InternetTV
Base: Users of all media
(1397)
6 in 10 people believe TV can influence opinions versus 2 in 10 for the Internet
TV and Internet are tie as source for news and information

16 16I:401098\40109880\Pres\Pan European Deck 2004
Web site or web pages visited
Q16. Which of the following types of website or web pages, if any, do you visit regularly?
8861
484847
39353329282625252422181414
4
EmailNews
Local informationBanking and finance
TravelMusic
ShoppingSports
Instant messengerJobs
Music download sitesCars
FilmsGames
AuctionMobile phones
Chat roomComedy
Dating
%
Base: Internet users (3440)
Email remains the most popular/important application with 88% using it. 61% visit news sites and almost half look to organise their finances online

17 17I:401098\40109880\Pres\Pan European Deck 2004
Offline Activities Moving Online
Book tickets
Read newspapers
Chat to your friends
Shop
Listen to music
Read magazines
Share music
Buy music
45
37
35
31
27
23
17
16
%
Base: Internet users (3440)
Q21. Which of these things did you previously do elsewhere but now do on the web?
Approximately 2 in 5 internet users now book tickets online around a third chat to friends via the internet

18 18I:401098\40109880\Pres\Pan European Deck 2004
6464
4948
403836353332
282828
25222120
18
4129
3531
208
623
913
20108912
7898
29
Browsing versus Buying
Travel ticketsHolidays
Theatre/cinema ticketsBooks
Electrical goodsCars
Properties - renting/purchasingBuying music
Mobile phonesMusic downloads
ClothesInsurance
Home furnishingsFinancial productsComputer games
FurnitureCar accessories
Food/grocery shoppingCar hire
BrowsingBuying
Base: Internet Users
2004%
(64)(45)(71)(65)(50)(21)(17)(66)(27)(41)(69)(36)(29)(32)(48)(32)(38)(45)(44)
Conversion (%)
(3440)
Travel tickets and holiday are the most heavily researched activities/commodities online, two thirds of those researching into tickets online proceed to purchase
Have you ever researched into…using the internet? Have you ever bought…using the internet?

19 19I:401098\40109880\Pres\Pan European Deck 2004
Pan Europe Conclusions
• Almost half (48%) of all Europeans (15 and over) are now using the Internet– Penetration is higher in the Nordic countries and lower in Southern Europe
– Among those that are not online today 20% plan to gain access within year• All of Norway plans to be online within 2 years
• TV remains the most widely used medium controlling a third of all media consumed– Virtually everyone surveyed (96%) watches something during the typical week
• While online penetration growth has slowed, more people are spending more time online
– 2 of 5 people surveyed are online daily, one in 10 spending 26 hours (or more) online
• During the typical week, the average person allocates 20% of their total media time to online activities – equal to print (newspapers + magazines at 11% and 8% respectively)
• One third (35%) of those surveyed state they are watching less TV because of the web and 25% could not live without it
• Email remains the most common online activity (88%) but activities like banking (45%) and downloading music (26%) are growing in importance
• The Internet is preferred to other media because it is “faster”, “offers more choice”, and is “more convenient”

20 20I:401098\40109880\Pres\Pan European Deck 2004
Pan Europe Recommendations
• Advertisers and their agencies need to find and follow their audiences. What this research indicates is that people are spending an increasing amount of their media time online. The average person in Europe spends one out of every five media hours online. Marketers who are not online are missing out.
• Consumers devote 20% of their media activity to the internet and yet online advertising makes up only 3% of advertising spend on average. Some advertisers are spending more online, such as BMW who devote 15% of their advertising budget to online. The vast majority, however, are not doing enough online.
• We are seeing a slow down in the growth rates for online penetration across Europe which is consistent with other studies available. What is important, is that those who are online are spending a lot more time using the Internet. Over 40% are online every single day.
• The increase in online media consumption is primarily due to the increasing adoption of broadband and the richer experience of people using the internet.